Self-reporting versus parental reporting of
physical activity in adolescents: the 11-year
follow-up of the 1993 Pelotas (Brazil) birth
cohort study
Auto-relato de atividade física na adolescência
comparado ao relato dos pais: a visita de 11 anos
da coorte de nascimentos de Pelotas, Rio Grande
do Sul, Brasil, 1993
1 Programa de Pós-graduação em Epidemiologia, Universidade Federal de Pelotas, Pelotas, Brasil. 2 Programa de Pós-graduação em Educação Física, Universidade Federal de Pelotas, Pelotas, Brasil. 3 Faculdade de Nutrição, Universidade Federal de Pelotas, Pelotas, Brasil.
Correspondence F. F. Reichert
Programa de Pós-graduação em Epidemiologia, Universidade Federal de Pelotas.
Rua Marechal Deodoro 1160, Pelotas, RS 96020-220, Brasil. [email protected]
Felipe F. Reichert 1,2 Ana M. B. Menezes 1 Cora Luiza Araújo 1,3 Pedro C. Hallal 1,2
Abstract
The aim of this study was to verify the agreement between different approaches for estimating levels of physical activity in adolescents. One question-naire was administered to parents and two were administered to the adolescents. This was a cross-sectional analysis of data collected in the 2004-2005 follow-up of the 1993 Pelotas (Brazil) birth cohort study. Parents or guardians answered the following question: “Compared to most children the same age, would you say that your child exer-cises more, less, or the same amount?”A similar question was addressed to adolescents, as was a detailed questionnaire on physical activity. Agree-ment between the questionnaires was measured by the weighted kappa statistic. A total of 4,254 adolescents and parents/guardians answered the questionnaires. Kappa values indicated low agreement for all comparisons (kappa ≤ 0.33 for all analyses). Measurement of physical activity in adolescents is complex, and available instru-ments should be validated prior to their use.
Motor Activity; Adolescent; Cohort Studies
Introduction
It is crucial to determine the level of physical ac-tivity in populations in order to plan interven-tions and verify the association between physical activity and specific diseases and mortality. How-ever, it is still a challenge for researchers to accu-rately determine patterns of physical activity in epidemiological studies, particularly in children and adolescents.
Recent years have witnessed an increase in the use of movement sensors, like accelerom-eters, and these instruments have proven to be a valid alternative 1,2,3. However, the use of these
devices in studies with large samples is still lim-ited, mainly because of the equipment’s costs. Questionnaires are still the most widely used in-struments for determining the level of physical activity in population studies, particularly in low and middle income countries like Brazil 4.
There is extensive literature on question-naires that estimate the level of physical activ-ity in children and adolescents. Some question-naires are answered by the children and adoles-cents themselves, while in others the questions are addressed to the parents or guardians. The justification in the latter case is that young people lack the capacity to accurately report their levels of physical activity 5. On the other hand, parents
In this context, the current study aimed to verify the agreement between three question-naires estimating the level of physical activity in adolescents. One of these questionnaires was an-swered by parents or guardians and the other two by the adolescents.
Methodology
All the hospital births in 1993 in the city of Pelo-tas, Rio Grande do Sul State, Brazil, were re-corded. The mothers answered a questionnaire, and the newborns were weighed and measured. Subsamples were visited at 1, 3, and 6 months and 1, 4, 6, and 9 years of age. In 2004-2005, all the cohort participants were searched for a new follow-up, the methodological details of which are described elsewhere 6. The current study was
performed with data obtained from the 2004-2005 follow-up.
Physical activity was estimated in three dif-ferent ways: level of physical activity as reported by the mother and self-reported by the adoles-cent, plus a third, more detailed questionnaire addressed to the adolescent. The following ques-tion was addressed to the adolescent’s mother (or when she was absent or unable to answer, the ad-olescent’s father or guardian): “Compared to most children the same age, would you say that your child exercises: (a) more, (b) less, or (c) the same amount?”. A similar question was addressed to the adolescents: “Compared to your friends the same age, do you exercise: (a) more, (b) less, or (c) the same amount?”. The questions were asked at different moments in the interview. The mother was unaware of her child’s answer, and vice-ver-sa. The in-depth questionnaire answered by the adolescent contained questions on the mode of transportation to school (active versus passive) and leisure-time physical activities in the school setting or out of school (with or without an in-structor) in the seven days prior to the interview. Physical education classes were not tabulated, because the level of intensity in the activities is low in both public and private schools in Brazil. Only moderate to vigorous activities were tab-ulated. The answers to the questionnaire were used to construct a score of minutes of physical activity per week 7. These instruments had
al-ready been used in previous studies 7,8 and were
chosen because of the practicality and simplicity of their application in epidemiological studies.
The data were keyed in to Epi Info 6.04 (Cen-ters for Disease Control and Prevention, Atlanta,
structed from the questionnaire was divided into tertiles. Thus, each of the three physical activity variables had three categories, indicating “low”, “medium”, and “high” level of physical activity. The percentage of agreement was calculated be-tween the categories of variables and the kappa index. Kappa is a statistical test for measuring agreement between categorical variables and which discounts the percentage of agreement expected by chance 9. Kappa values ≤ 0.40 are
in-terpreted as low agreement, from 0.41 to 0.60 as moderate, and > 0.60 as high agreement 9. Since
the variables were ordinal, the weighted kappa index was calculated, assigning different weights to disagreements according to the discrepancy’s magnitude. We used weights of 1.0 for agree-ment, 0.5 for one-category disagreeagree-ment, and 0.0 for two-category disagreement. We performed stratified analyses by gender, body mass index (BMI), and socioeconomic status (as determined by the Brazilian Association of Population Stud-ies) 10. However, since the results of these
strati-fied analyses were similar to those of the overall sample, only the latter are presented here.
The project was approved by the Research Ethics Committee of the School of Medicine, Fed-eral University in Pelotas. The parents or guard-ians signed a free and informed consent form, authorizing the children to participate in the interview, and informed consent was obtained from the adolescents.
Results
Table 1
Description of the sample. 1993 Pelotas (Brazil) birth cohort study, 2004-2005 follow-up.
Variable n %
Gender
Male 2,192 49.2
Female 2,260 50.8
Age (years)
10 886 19.9
11 3,510 78.9
12 55 1.2
Family’s socioeconomic status *
A 164 3.7
B 697 15.8
C 1,514 34.4
D 1,722 39.1
E 309 7.0
Nutritional status **
Underweight 313 7.1
Normal weight 3,100 69.8
Risk of overweight 1,029 23.2
Mother’s report of adolescent’s physical activity
Less exercise than friends 886 20.0
Same amount 2,619 59.2
More exercise than friends 921 20.8
Adolescent’s self-reported physical activity
Less exercise than friends 776 17.5
Same amount 2,966 66.9
More exercise than friends 693 15.6
Level of physical activity (minutes/week)
< 300 2,496 58.2
≥ 300 1,793 41.8
* According to criteria of the Brazilian Association of Population Studies (ABEP) 10; ** According to World Health Organization (WHO) criteria 23.
Table 2
Mother’s report and adolescent’s self-reported physical activity. 1993 Pelotas (Brazil) birth cohort study, 2004-2005 follow-up.
Mother’s report Adolescent’s self-report
More exercise Same amount Less exercise
n (%) n (%) n (%)
More exercise 364 (52.9) 471 (16.0) 79 (10.2)
Same amount 260 (37.9) 2,034 (68.9) 320 (41.3)
Less exercise 63 (9.2) 444 (15.1) 375 (48.5)
Total 687 (100.0) 2,949 (100.0) 774 (100.0)
sequent tables, high agreement is shown by the proportions in the diagonals (bold numbers). We placed the percentages in the columns to facili-tate visualizing the proportions, but the calcula-tions could also have been performed based on the total from the rows. The kappa for this table was 0.33 (low agreement), and the percentage of agreement was 79.8%.
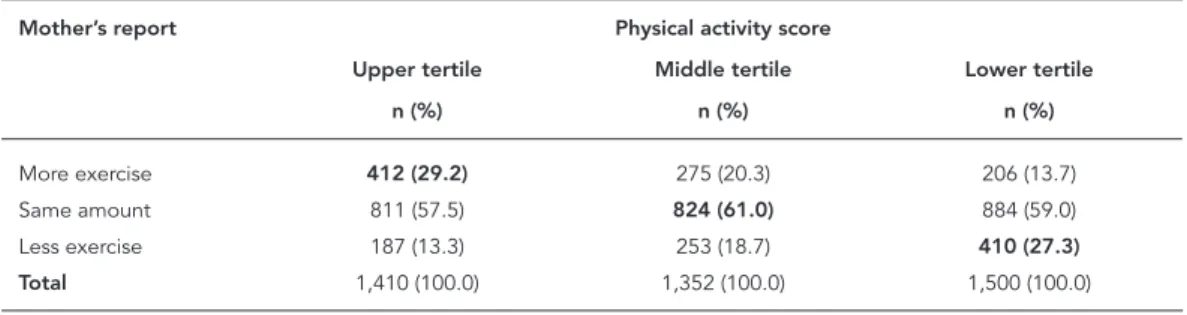
Table 3 compares the mother’s perception to the adolescent’s physical activity tertiles, and Table 4 compares the adolescent’s percep-tion to the score tertiles. These two tables show similar agreements to each other, but lower than Table 2.
Discussion
Determining the population level of physical activity still challenges researchers. The number of available instruments has increased in recent years, but questionnaires are still the most
wide-ly used tools, due mainwide-ly to their low cost and speed in obtaining data 11. Still, the accurate
de-termination of levels of physical activity through questionnaires depends on the individual’s re-call capacity for physical activities. In this sense, applying questionnaires to children and adoles-cents may pose a limitation, and an alternative has been to address the questions to parents or guardians. It is plausible to assume that the accu-racy of answers to questionnaires increases over the course of adult life. However, the minimum age at which an individual is capable of accu-rately self-reporting his or her level of physical activity remains undetermined.
The comparison of self-reporting by the child or adolescent and reporting by parents or guardians has also been studied to verify fruit and vegetable consumption 12, anxiety and
de-pression 13, asthma 14, exposure to sunlight and
sunscreen use 15, headache, fatigue,
musculo-skeletal pain, and medical history 16 , and other
health-related behaviors 17. A Chinese study 18
Table 3
Relationship between physical activity score and mother’s report of adolescent’s physical activity. 1993 Pelotas (Brazil) birth cohort study, 2004-2005 follow-up.
Mother’s report Physical activity score
Upper tertile Middle tertile Lower tertile
n (%) n (%) n (%)
More exercise 412 (29.2) 275 (20.3) 206 (13.7)
Same amount 811 (57.5) 824 (61.0) 884 (59.0)
Less exercise 187 (13.3) 253 (18.7) 410 (27.3)
Total 1,410 (100.0) 1,352 (100.0) 1,500 (100.0)
Note: kappa = 0.13; percentage agreement = 64.7%.
Table 4
Relationship between physical activity score and adolescent’s self-reported physical activity. 1993 Pelotas (Brazil) birth cohort study, 2004-2005 follow-up.
Adolescent’s self-report Physical activity score
Upper tertile Middle tertile Lower tertile
n (%) n (%) n (%)
More exercise 310 (21.9) 198 (14.6) 163 (10.8)
Same amount 938 (66.2) 930 (68.7) 992 (65.7)
and a Japanese study 19 verified the agreement
between parent-reported and teacher-reported behavior problems in children. The results of these studies varied substantially, with some comparisons indicating good agreement 14,15,
while other studies found low agreement
12,13,16,17,18,19.
In the present study we verified the agree-ment between three questionnaires to estimate the level of physical activity in adolescents 11 and 12 years old. The sample was population-based, thus including adolescents of both sexes and dif-ferent economic and nutritional levels. However, the results were similar for all the categories of these variables. Any generalization of the results to other age brackets should be done with cau-tion, since our study only included adolescents born in 1993. The agreement was higher between the mother’s report and the adolescent’s self-re-port than for the physical activity tertiles derived from the detailed questionnaire answered by the adolescent. Even so, the kappa values indicated low agreement for all the comparisons (kappa ≤ 0.33 for all the analyses). When adolescents report exercising “the same amount” as class-mates, they might be referring to classmates that actually practice some form of physical activ-ity, rather than the total adolescent population. This hypothesis is supported by the observation that the agreement between the physical activ-ity score from the more detailed questionnaire and the other questionnaires was lower than be-tween the two single-question questionnaires. In a similar study, Dowda et al. 20 also found low
association between level of physical activity es-timated by 531 adolescents and their parents. However, the evaluation of agreement between the answers is limited by the fact that the authors performed analyses by correlation coefficient, when this measure is not necessarily indicative of agreement 21. The correlation coefficients
for both answers (adolescent’s self-report and parent’s estimate) as compared to an objective and valid measurement of level of physical ac-tivity (accelerometer) were also low (≤ 0.3 for all the analyses), suggesting that on average, none of the groups accurately reported the levels of physical activity.
Some methodological aspects of the current study should be highlighted. The questionnaires used the terms “physical activity” and “physical exercise”. Although there is a conceptual differ-ence between these terms 22, we strongly believe
that the general population does not distinguish between them, and therefore that this issue does not pose a limitation to the study. The three stud-ied instruments are subjective methods. Thus, a limitation to our study is the absence of an ob-jective method that could be considered the gold standard for verifying whether any of the three questionnaires was superior to the others. Still, our findings are extremely relevant, since the weak agreement between the questionnaires in-dicates that at least two of them have low valid-ity. The answers to the questionnaires had three categories (“less exercise”, “the same amount”, and “more exercise”) and the kappa values and percentages of agreement are dependent on this number of categories. It is thus likely that questionnaires with more options for answers would show lower agreement than found in this study. The study’s positive features include the sample’s representativeness, the uniqueness of the approach to the theme among Brazilian ado-lescents, and the application of an appropriate statistical test for assessing agreement between categorical variables. Importantly, the percent-age of agreement is a simple measurement, but it does not discount the agreement expected by chance, while the kappa test is indicated to assess the agreement between categorical vari-ables and discounts the agreement expected by chance, and is thus preferable to the percentage of agreement.
Due to the benefits of regular physical activity for adolescents’ health 11, and considering that
questionnaires are the most widely used instru-ments for estimating level of physical activity 4,
Resumo
O objetivo deste estudo foi verificar a concordância entre diferentes formas de se estimar o nível de ativi-dade física de adolescentes. Um questionário foi apli-cado aos pais e outros dois aos adolescentes. O estudo foi transversal aninhado ao acompanhamento de 2004-2005 da coorte de nascimentos de 1993 em Pe-lotas, Rio Grande do Sul, Brasil. Pais ou responsáveis
responderam à questão: “Comparando com a maioria
das crianças da mesma idade, o(a) Sr(a). diria que o seu filho faz mais exercícios que elas, menos exer-cícios que elas ou a mesma quantidade que elas?”. Questão análoga foi aplicada aos adolescentes. Os adolescentes também responderam a um questionário mais detalhado sobre a prática de atividades físicas. A concordância entre os questionários foi avaliada pelo teste kappa ponderado. Um total de 4.254 adolescen-tes e responsáveis responderam aos questionários. Os valores de kappa indicaram concordância baixa para
quaisquer das comparações (kappa ≤ 0,33 para todas
as análises). A mensuração de atividade física em ado-lescentes é complexa e os instrumentos disponíveis de-vem ser validados antes do uso.
Atividade Motora; Adolescente; Estudos de Coortes
Contributors
F. F. Reichert participated in the data analysis and wri-ting of the manuscript. A. M. B. Menezes and C. L. Araú-jo contributed to the planning of the cohort follow-up and critical revision of the manuscript. P. C. Hallal colla-borated in the critical revision of the manuscript and in the statistical analyses.
Acknowledgments
The cohort study is supported by the Wellcome Trust. The initial phases of the cohort were funded by the Eu-ropean Union and the Brazilian National Program for Centers of Excellence (PRONEX), National Research Council (CNPq), and Ministry of Health. The CNPq pro-vided a PhD scholarship to F. F. Reichert.
References
1. Corder K, Brage S, Mattocks C, Ness A, Riddoch C, Wareham NJ, et al. Comparison of two methods to assess PAEE during six activities in children. Med Sci Sports Exerc 2007; 39:2180-8.
2. Brage S, Brage N, Franks PW, Ekelund U, Wareham NJ. Reliability and validity of the combined heart rate and movement sensor Actiheart. Eur J Clin Nutr 2005; 59:561-70.
3. Rowlands AV. Accelerometer assessment of physi-cal activity in children: an update. Pediatr Exerc Sci 2007; 19:252-66.
4. Hallal PC, Dumith SC, Bastos JP, Reichert FF, Si-queira FV, Azevedo MR. Evolução da pesquisa epi-demiológica em atividade física no Brasil: revisão sistemática. Rev Saúde Pública 2007; 41:453-60.
6. Araújo CL, Menezes AMB, Vieira MFA, Neutzling MB, Gonçalves H, Anselmi L, et al. The 11-year follow-up of the 1993 Pelotas (Brazil) birth cohort study: methods. Cad Saúde Pública 2010; 26:1875-86. 7. Hallal PC, Wells JC, Reichert FF, Anselmi L, Victo-ra CG. Early determinants of physical activity in adolescence: prospective birth cohort study. BMJ 2006; 332:1002-7.
8. Hallal PC, Bertoldi AD, Gonçalves H, Victora CG. Prevalência de sedentarismo e fatores associados em adolescentes de 10-12 anos de idade. Cad Saú-de Pública 2006; 22:1277-87.
9. Altman D. Practical statistics for medical research. London: Chapman & Hall; 1991.
11. Hallal PC, Victora CG, Azevedo MR, Wells JC. Ado-lescent physical activity and health: a systematic review. Sports Med 2006; 36:1019-30.
12. Reinaerts E, Nooijer J, Vries NK. Parental versus child reporting of fruit and vegetable consump-tion. Int J Behav Nutr Phys Act 2007; 4:33.
13. Rockhill CM, Russo JE, McCauley E, Katon WJ, Richardson LP, Lozano P. Agreement between par-ents and children regarding anxiety and depres-sion diagnoses in children with asthma. J Nerv Ment Dis 2007; 195:897-904.
14. Yawn BP, Wollan P, Kurland M, Bertram S. Com-parison of parent and student responses to asthma surveys: students grades 3-12 and their parents from a suburban private school setting. J Sch Health 2006; 76:241-5.
15. Dusza SW, Oliveria SA, Geller AC, Marghoob AA, Halpern AC. Student-parent agreement in self-re-ported sun behaviors. J Am Acad Dermatol 2005; 52:896-900.
16. Sundblad GM, Saartok T, Engström LM. Child-parent agreement on reports of disease, injury and pain. BMC Public Health 2006; 6:276.
17. Karver MS. Determinants of multiple informant agreement on child and adolescent behavior. J Ab-norm Child Psychol 2006; 34:251-62.
18. Deng S, Liu X, Roosa MW. Agreement between par-ent and teacher reports on behavioral problems among Chinese children. J Dev Behav Pediatr 2004; 25:407-14.
19. Satake H, Yoshida K, Yamashita H, Kinukawa N, Takagishi T. Agreement between parents and teach-ers on behavioral/emotional problems in Japanese school children using the child behavior checklist. Child Psychiatry Hum Dev 2003; 34:111-26. 20. Dowda M, Pate RR, Sallis JF, Freedson PS, Taylor
WC, Sirard JR, et al. Agreement between student-reported and proxy-student-reported physical activity questionnaires. Pediatr Exerc Sci 2007; 19:310-8. 21. Bland JM, Altman DG. Statistical methods for
as-sessing agreement between two methods of clini-cal measurement. Lancet 1986; 1:307-10.
22. Caspersen CJ, Powell KE, Christenson GM. Physi-cal activity, exercise, and physiPhysi-cal fitness: defini-tions and distincdefini-tions for health-related research. Public Health Rep 1985; 100:126-31.
23. World Health Organization. Physical status: the use and interpretation of anthropometry. Report of a WHO Expert Committee. Geneva: World Health Organization; 1995. (WHO Technical Report Se-ries, 854).
Submitted on 11/Feb/2009