Factors associated with weight loss dieting
among adolescents: the 11-year follow-up
of the 1993 Pelotas (Brazil) birth cohort study
Fatores associados à realização de regime de
emagrecimento entre adolescentes: a visita
de 11 anos da coorte de nascimentos de
Pelotas, Rio Grande do Sul, Brasil, 1993
1 Programa de Pós-graduação em Epidemiologia, Universidade Federal de Pelotas, Pelotas, Brasil. 2 Faculdade de Nutrição, Universidade Federal de Pelotas, Pelotas, Brasil. 3 Programa de Pós-graduação em Educação Física, Universidade Federal de Pelotas, Pelotas, Brasil.
Correspondence S. W. Madruga
Programa de Pós-graduação em Epidemiologia, Universidade Federal de Pelotas.
Rua Marechal Deodoro 1160, Pelotas, RS
96020-220, Brasil.
Samanta W. Madruga 1 Mario Renato de Azevedo 1 Cora Luiza Araújo 1,2 Ana M. B. Menezes 1 Pedro C. Hallal 1,3
Abstract
Evidence has shown the negative effects of unsu-pervised diets and those with excessive calorie re-striction. The aim of this study was to determine the proportion of adolescents engaging in weight loss dieting and associated factors. This was a cross-sectional study of 4,452 adolescents born in Pelotas, Rio Grande do Sul State, Brazil, in 1993. The outcome was defined as adolescents that re-ported having practiced some type of weight loss dieting in the previous 12 months. Prevalence of such dieting was 8.6% (95%CI: 7.7;9.4), and was higher in girls. Elevated maternal body mass in-dex (BMI) was associated with dieting among girls. The adolescent’s and parents’ view of the adolescent’s weight, excess weight, and consump-tion of diet or light soft drinks were associated with adolescent dieting. There was a positive as-sociation between dieting and socioeconomic status. The findings provide important backing for policies aimed at improving adolescents’ diet, since they express a major concern over weight and thus a significant percentage of individuals with erroneous and unhealthy behaviors.
Weight Loss; Food Consumption; Nutritional Sta-tus; Cohort Studies
Introduction
Brazil, like other medium and/or low income countries, is undergoing a nutritional transition in which under-nutrition is being replaced by excessive food intake 1. In addition, nutritional
quality has declined, and one of the possible rea-sons is that the cheapest and most widely avail-able foods for consumers are processed food products with high energy density, high in satu-rated and trans fats and low in food fiber 2.
As a consequence of this transition, the nutri-tional status of populations has changed, includ-ing that of children and adolescents. The decrease in the prevalence of under-nutrition has been ac-companied by an increase in the number of over-weight individuals 3. This phenomenon and the
resulting appearance of diseases related to excess weight, like diabetes, hypertension, and dyslipi-demia, have led to studies seeking to understand individuals’ attitudes towards this problem.
Weight loss dieting is one of the main meth-ods for controlling and/or losing weight. How-ever, one of the principal concerns with the use of this method, especially among adolescents, is the development of complications arising from eating disorders. Weight loss dieting, depend-ing on the level of food restriction, is associated with various eating disorders, the main ones being anorexia and bulimia 4. In addition,
of recommended daily intake levels for various macro and micronutrients 5.
The literature is still limited on the evaluation of the frequency of weight loss dieting at the pop-ulation level. There also few studies on factors associated with dieting, although there is some evidence that such behavior is affected by body self-image, parents’ perceptions and influence, and other variables such as nutritional status, food intake, and physical activity.
The aim of this study was to determine the frequency of weight loss dieting and associated factors among adolescents 11 years of age in the 1993 Pelotas (Brazil) birth cohort study.
Methods
All hospital births in the city of Pelotas in 1993 were monitored. The mothers answered a ques-tionnaire and the newborns were weighed and measured. Sub-samples of these individuals were visited at 1, 3, and 6 months and 1, 4, 6, and 9 years of age 6. In 2004-2005, all the cohort
members were searched for a new follow-up, the methodology of which has been described else-where 7.
In this 2004-2005 follow-up, the adolescents answered questions on eating, including the outcome described in this study. “Weight loss di-eting” was defined as the adolescent reporting some type of diet or eating restriction with the aim of losing weight, in the 12 months prior to the interview.
Food fiber and fat intake frequencies were ob-tained from the self-scored screening question-naire proposed by Block, divided into two seg-ments: fiber and fat intake 8. Low-fiber diet was
defined as a score of less than 20 points. High-fat diet was defined as a score greater than 27 points. Soft drink consumption was assessed with the following question: “When you drink soft drinks, what kind do you drink?”.
The adolescents’ nutritional status was as-sessed according to World Health Organization (WHO) criteria 9, including body mass index
(BMI) and tricipital and subscapular skinfolds. The categories “underweight” (BMI/age: percen-tile < 5) and “normal” (BMI/age: 5 ≤ percentile < 85) were grouped together, since the former in-cluded only a few individuals. Obesity and risk of overweight were defined according to the WHO: obesity (BMI/age ≥ P85 and tricipital and
sub-ecapular skinfolds ≥ P90) and risk of overweight
(BMI/age ≥ P85) 9.
The other independent variables were: house-hold assets index (in quintiles), skin color (self-reported by the interviewee), maternal schooling
(in complete number of years or passing school grades), maternal nutritional status according to WHO criteria (underweight: BMI < 18.5kg/m2;
normal weight: BMI from 18.5 to 24.9kg/m2;
overweight: BMI from 25.0 to 29.9kg/m2;
obe-sity: BMI > 30.0kg/m2) 10. The two variables “how
the adolescent perceives his or her weight” and “what the parents think of their child’s weight” used the same answers (thin/very thin, normal, or fat/very fat). In relation to physical activity, adolescents were defined as sedentary when they reported less than 300 minutes of physical activ-ity per week 11.
The interviewers received 40 hours of train-ing before applytrain-ing the standardized, pre-cod-ed questionnaires. Weight, height, and skinfold measurements were standardized according to the Technical Error Measurement (TEM) meth-odology 12, which analyzes intra and
inter-ob-server errors.
Data analysis used a hierarchical model for determination of the outcome 13, in which the
first level (most distal) included the socioeco-nomic and demographic variables (skin color, maternal schooling, and household assets in-dex). The second level (intermediate) included the health-related and weight perception vari-ables (maternal BMI, adolescent’s perception of own weight, and parents’ perception of child’s weight). The most proximal level in relation to the outcome included the nutritional and behavioral variables (fiber, fat, and soft drink consumption, sedentary lifestyle, and nutritional status).
Statistical analysis of the data used Stata 9 (Stata Corp., College Station, USA). Statistical sig-nificance was assessed with the Wald test using Poisson regression with robust variance and 5% significance level. The adjusted analysis main-tained variables with p ≤ 0.20 in the model. Ad-justment for confounding factors used a hierar-chical model in which each variable’s effect on the outcome was controlled for those at the same level or above.
The research project was approved by the In-stitutional Review Board of the School of Medi-cine of the Federal University in Pelotas. The parents or guardians signed a free and informed consent form authorizing their children to par-ticipate in the study.
Results
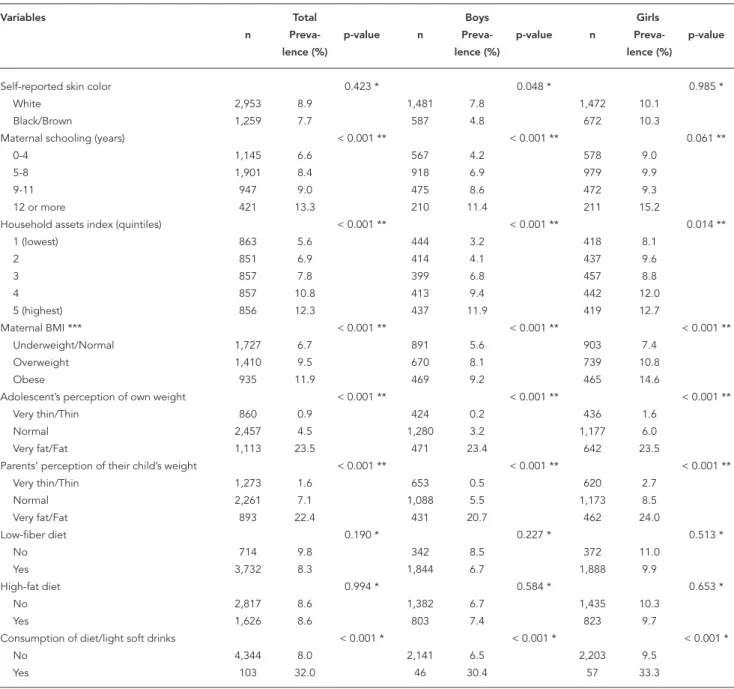
Table 1 shows the proportion of adolescents that reported weight loss dieting in the previ-ous year, according to the independent variables for the entire sample and separately for boys and girls. White skin color was only significant-ly associated with weight loss dieting for boys (p = 0.048). Maternal schooling was not associ-ated with dieting among girls (p = 0.061). In both sexes, the household assets index was directly
as-sociated with weight loss dieting. For both the overall sample and separately for boys and girls, there was a positive linear trend in the association between maternal BMI and dieting (p < 0.001). In relation to perception of body weight (accord-ing to parents and the adolescents themselves), the proportion of adolescents that dieted was higher among those classified as fat or very fat (p < 0.001). Importantly, weight loss dieting was
Table 1
Description of the sample and prevalence of weight loss dieting, according to demographic, socioeconomic, and behavioral variables in adolescents. 1993 Pelotas (Brazil) birth cohort study, 2004-2005 follow-up (N = 4,452).
Variables Total Boys Girls
n Preva- p-value n Preva- p-value n Preva- p-value
lence (%) lence (%) lence (%)
Self-reported skin color 0.423 * 0.048 * 0.985 *
White 2,953 8.9 1,481 7.8 1,472 10.1
Black/Brown 1,259 7.7 587 4.8 672 10.3
Maternal schooling (years) < 0.001 ** < 0.001 ** 0.061 **
0-4 1,145 6.6 567 4.2 578 9.0
5-8 1,901 8.4 918 6.9 979 9.9
9-11 947 9.0 475 8.6 472 9.3
12 or more 421 13.3 210 11.4 211 15.2
Household assets index (quintiles) < 0.001 ** < 0.001 ** 0.014 **
1 (lowest) 863 5.6 444 3.2 418 8.1
2 851 6.9 414 4.1 437 9.6
3 857 7.8 399 6.8 457 8.8
4 857 10.8 413 9.4 442 12.0
5 (highest) 856 12.3 437 11.9 419 12.7
Maternal BMI *** < 0.001 ** < 0.001 ** < 0.001 **
Underweight/Normal 1,727 6.7 891 5.6 903 7.4
Overweight 1,410 9.5 670 8.1 739 10.8
Obese 935 11.9 469 9.2 465 14.6
Adolescent’s perception of own weight < 0.001 ** < 0.001 ** < 0.001 **
Very thin/Thin 860 0.9 424 0.2 436 1.6
Normal 2,457 4.5 1,280 3.2 1,177 6.0
Very fat/Fat 1,113 23.5 471 23.4 642 23.5
Parents’ perception of their child’s weight < 0.001 ** < 0.001 ** < 0.001 **
Very thin/Thin 1,273 1.6 653 0.5 620 2.7
Normal 2,261 7.1 1,088 5.5 1,173 8.5
Very fat/Fat 893 22.4 431 20.7 462 24.0
Low-fiber diet 0.190 * 0.227 * 0.513 *
No 714 9.8 342 8.5 372 11.0
Yes 3,732 8.3 1,844 6.7 1,888 9.9
High-fat diet 0.994 * 0.584 * 0.653 *
No 2,817 8.6 1,382 6.7 1,435 10.3
Yes 1,626 8.6 803 7.4 823 9.7
Consumption of diet/light soft drinks < 0.001 * < 0.001 * < 0.001 *
No 4,344 8.0 2,141 6.5 2,203 9.5
Yes 103 32.0 46 30.4 57 33.3
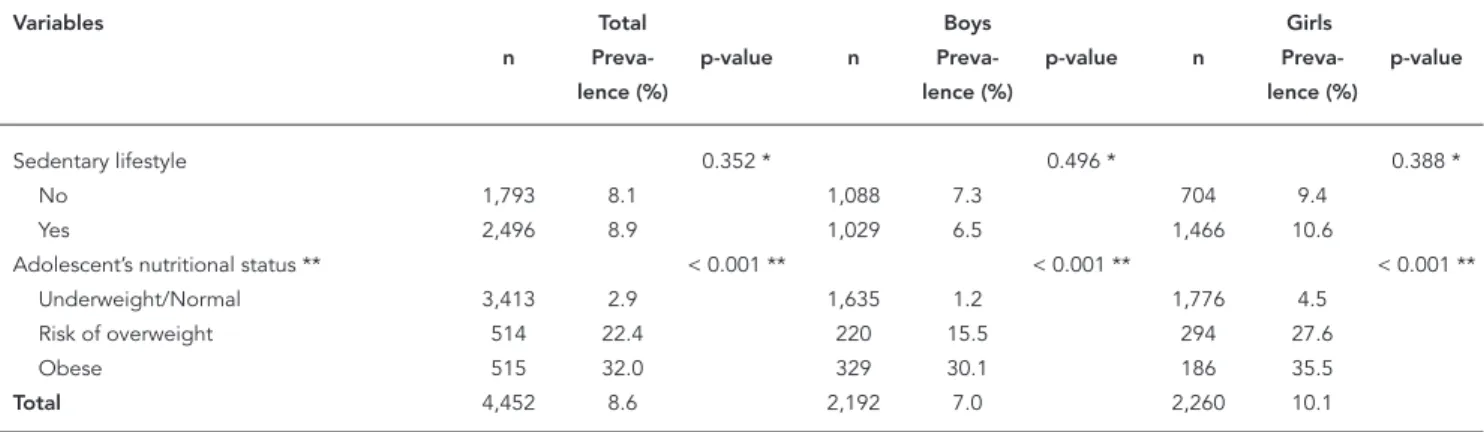
present even among adolescents classified as thin or very thin or normal. Diet (low consump-tion of fiber and high consumpconsump-tion of fat) and sedentary lifestyle were not associated with the outcome in any of the subgroups. Consumption of “diet” or “light” soft drinks showed a strong association with dieting (p < 0.001). There was a positive linear trend association between the adolescents’ nutritional status and dieting. Over-weight adolescents dieted more than their thin or normal-weight peers (p < 0.001).
Table 2 shows the crude and adjusted preva-lence ratios for the association between weight loss dieting and the independent variables in boys. The adjusted analysis shows that weight loss dieting was associated with higher house-hold assets index (p < 0.001), parents’ or adoles-cents’ perception of the adolesadoles-cents’ body weight as fat or very fat (p < 0.001), consumption of diet/ light soft drinks (p = 0.002), and adolescent’s over-weight/obesity (p < 0.001). Interestingly, there was no significant association between maternal BMI and adolescent’s dieting (p = 0.479). It is im-portant to recall that the variables with p > 0.20 were removed from the hierarchical model.
Among girls (Table 3), household assets index (p = 0.015) and maternal BMI (p = 0.005) were directly associated with dieting. Adolescents that classified themselves as fat or very fat, those whose parents also considered their child fat or very fat, and those that only consumed diet or light soft drinks showed significantly higher diet-ing rates. In relation to nutritional status, girls at risk of overweight and obesity showed a threefold likelihood of dieting as compared to underweight or normal-weight girls (p < 0.001).
Discussion
The current study was based on a population-based cohort and showed a high follow-up rate. The probability of selection bias is thus low. However, extrapolation of the results to adoles-cents in general should be done with caution, since the study population covered a narrow age bracket.
Weight loss dieting was more frequent in girls than boys. This finding is consistent with a study by Field et al. 14 analyzing American adolescents
12 to 18 years of age, with 8% and 3% prevalence rates for dieting in the previous year by girls and boys, respectively. Calderon et al. 15 evaluated
adolescents from 13 to 17 years of age in pub-lic schools in Los Angeles, California, and found similar results (dieting was more prevalent in girls than boys). This different behavior between girls and boys appears to be well documented in the literature and may reflect a greater con-cern among girls, particularly in relation to ap-pearance and health, as compared to their male peers 14,15,16,17.
As in Drewnowski et al. 18, the current study
found that higher-income individuals are more inclined to do weight loss dieting. One possible hypothesis for this finding is a greater concern over physical appearance among these adoles-cents. It is also likely that the parents of these more economically privileged adolescents are more alert to the problem of overweight, since they tend to be more knowledgeable about the harmful effects of excess body fat on their chil-dren’s current and future health. A final aspect to be considered is the constant social pressure
Table 1 (continued)
Variables Total Boys Girls
n Preva- p-value n Preva- p-value n Preva- p-value
lence (%) lence (%) lence (%)
Sedentary lifestyle 0.352 * 0.496 * 0.388 *
No 1,793 8.1 1,088 7.3 704 9.4
Yes 2,496 8.9 1,029 6.5 1,466 10.6
Adolescent’s nutritional status ** < 0.001 ** < 0.001 ** < 0.001 **
Underweight/Normal 3,413 2.9 1,635 1.2 1,776 4.5
Risk of overweight 514 22.4 220 15.5 294 27.6
Obese 515 32.0 329 30.1 186 35.5
Total 4,452 8.6 2,192 7.0 2,260 10.1
BMI: body mass index. * Chi-square test; ** Linear trend test;
Table 2
Crude and adjusted analyses of the association between weight loss dieting and independent variables in male adolescents. 1993 Pelotas (Brazil) birth cohort study, 2004-2005 follow-up (N = 2,192).
Variable Crude analysis Adjusted analysis
PR (95%CI) p-value PR (95%CI) p-value
Skin color 0.015 * 0.532 *
White 1.00 1.00
Black/Brown 0.61 (0.41; 0.91) 0.77 (0.50; 1.19)
Maternal schooling (years) < 0.001 ** 0.706 **
0-4 1.00 1.00
5-8 1.62 (1.03; 2.56) 1.17 (0.74; 1.86)
9-11 2.04 (1.25; 3.32) 1.14 (0.66; 1.95)
12 or more 2.70 (1.57; 4.65) 1.18 (0.61; 2.29)
Household assets index (quintiles) < 0.001 ** < 0.001 **
1 (lowest) 1.00 1.00
2 1.30 (0.65; 2.61) 1.30 (0.65; 2.61)
3 2.15 (1.14; 4.03) 2.15 (1.14; 4.03)
4 2.99 (1.65; 5.43) 2.99 (1.65; 5.43)
5 (highest) 3.77 (2.12; 6.71) 3.77 (2.12; 6.71)
Maternal BMI 0.010 ** 0.479 **
Underweight/Normal 1.00 1.00
Overweight 1.44 (0.99; 2.08) 1.05 (0.74; 1.50)
Obese 1.63 (1.10; 2.42) 1.15 (0.79; 1.66)
Adolescent’s perception of own weight < 0.001 ** < 0.001 **
Very thin/Thin 1.00 1.00
Normal 13.58 (1.87; 98.47) 5.18 (0.62; 43.52) Very fat/Fat 99.02 (13.88; 706.42) 23.21 (2.63; 205.19)
Parents’ perception of child’s weight < 0.001 ** < 0.001 **
Very thin/Thin 1.00 1.00
Normal 12.00 (3.78; 38.13) 5.32 (1.53; 18.50) Very fat/Fat 44.95 (14.31; 141.15) 7.69 (2.15; 27.52)
Low-fiber diet 0.225 * 0.132 *
No 1.27 (0.86; 1.87) 1.30 (0.92; 1.83)
Yes 1.00 1.00
High-fat diet 0.584 * 0.332 *
No 1.00 1.00
Yes 1.09 (0.80; 1.50) 0.86 (0.64; 1.16)
Consumption of diet/light soft drinks < 0.001 * 0.002 *
No 1.00 1.00
Yes 4.72 (2.96; 7.52) 1.92 (1.26; 2.93)
Sedentary lifestyle 0.497 * 0.234 *
No 1.00 1.00
Yes 0.90 (0.65; 1.23) 0.84 (0.63; 1.12)
Nutritional status < 0.001 ** < 0.001 **
Underweight/Normal 1.00 1.00
Risk of overweight 13.30 (7.72; 22.90) 5.98 (3.19; 11.21) Obesity 25.89 (16.08; 41.70) 9.28 (4.89; 17.61)
95%CI: 95% confi dence interval; BMI: body mass index. * Wald test for heterogeneity;
Table 3
Crude and adjusted analyses of the association between weight loss dieting and independent variables in female adolescents. 1993 Pelotas (Brazil) birth cohort study, 2004-2005 follow-up (N = 2,260).
Variable Crude analysis Adjusted analysis
PR (95%CI) p-value PR (95%CI) p-value
Skin color 0.879 * 0.322 *
White 1.00 1.00
Black/Brown 1.02 (0.78; 1.34) 1.16 (0.87; 1.54)
Maternal schooling (years) 0.068 ** 0.643 **
0-4 1.00 1.00
5-8 1.10 (0.80; 1.52) 1.02 (0.73; 1.43)
9-11 1.04 (0.71; 1.52) 0.86 (0.57; 1.31)
12 or more 1.69 (1.12; 2.54) 1.35 (0.81; 2.26)
Household assets index (quintiles) 0.015 ** 0.015 **
1 (lowest) 1.00 1.00
2 1.18 (0.77; 1.82) 1.18 (0.77; 1.82)
3 1.08 (0.69; 1.67) 1.08 (0.69; 1.67)
4 1.47 (0.98; 2.22) 1.47 (0.98; 2.22)
5 (highest) 1.56 (1.03; 2.34) 1.56 (1.03; 2.34)
Maternal BMI < 0.001 ** 0.005 **
Underweight/Normal 1.00 1.00
Overweight 1.46 (1.07; 1.99) 1.21 (0.89; 1.63)
Obese 1.97 (1.43; 2.71) 1.58 (1.16; 2.16)
Adolescent’s perception of own weight < 0.001 ** < 0.001 **
Very thin/Thin 1.00 1.00
Normal 3.70 (1.72; 8.00) 2.37 (1.04; 5.42)
Very fat/Fat 14.65 (6.93; 30.96) 6.46 (2.77; 15.08)
Parents’ perception of child’s weight < 0.001 ** < 0.001 **
Very thin/Thin 1.00 1.00
Normal 3.11 (1.88; 5.15) 1.68 (0.97; 2.90)
Very fat/Fat 8.76 (5.34; 14.39) 2.66 (1.49; 4.76)
Low-fiber diet 0.512 * 0.250 *
No 1.11 (0.81; 1.53) 1.19 (0.89; 1.59)
Yes 1.00 1.00
High-fat diet 0.653 ** 0.296 **
No 1.00 1.00
Yes 0.94 (0.73; 1.22) 0.87 (0.67; 1.13)
Consumption of diet/light soft drinks < 0.001 * 0.008 *
No 1.00 1.00
Yes 3.51 (2.38; 5.19) 1.73 (1.15; 2.61)
Sedentary lifestyle 0.389 * 0.476 *
No 1.00 1.00
Yes 1.13 (0.86; 1.48) 0.91 (0.69; 1.19)
Nutritional status < 0.001 ** < 0.001 **
Underweight/Normal 1.00 1.00
Risk of overweight 6.12 (4.61; 8.12) 3.51 (2.36; 5.21)
Obesity 7.88 (5.90; 10.52) 4.19 (2.77; 6.34)
from classmates, friends, and the media to lose weight, sometimes even unnecessarily.
The current study found no association be-tween the type of diet consumed by adolescents and weight loss dieting. The literature review found only one study that evaluated the associa-tion between weight gain, weight maintenance, and weight loss dieting and adolescents’ food consumption. The study also failed to show a sig-nificant association between the types of foods consumed (in this case, carbohydrate, protein, fat, and energy) and dieting 19. This point should
be evaluated with care, since nutritional ap-proaches in population-based studies are still a complex, due to the wide diversity of methods and instruments for evaluating individual diet.
Interestingly, maternal BMI was only asso-ciated with weight loss dieting among female adolescents. Perhaps the stronger identifica-tion of teenage girls with their mothers plus the mother’s concern over not reproducing her own unwanted physical appearance may be influenc-ing the decision by girls to engage in weight loss dieting, since the study showed that daughters of obese mothers were more inclined to diet. Ado-lescents whose mothers considered their weight important wanted to be thinner and dieted more often 14.
Consumption of diet/light soft drinks was strongly associated with dieting. Since this was a cross-sectional analysis, this association is prob-ably affected by a reverse causality bias, i.e., con-sumption of diet/light soft drinks may be part of the adolescent’s weight loss strategy.
In this sample of adolescents, those that saw themselves as fatter showed higher odds of weight loss dieting. This finding suggests a great-er concgreat-ern ovgreat-er body image, beginning in child-hood and adolescence, as already shown in other studies 20,21,22. The challenge is to steer this
con-cern towards the development of healthy habits among adolescents, especially healthy, varied, and balanced diet, rather than merely crash
di-eting motivated by a preoccupation with body image.
Field et al. 23 showed that girls who perceive
their parents’ concern over their weight are also more preoccupied with their weight. The current study did not evaluate levels of concern in rela-tion to weight, although it did find a significant association between weight loss dieting and par-ents’ opinion of the adolescent’s weight. Thus, the fact that parents considered their children fat may be influencing the children’s behavior (among both boys and girls).
As for the adolescents’ nutritional status, the current study found a clear linear trend between excess weight and weight loss dieting in both boys and girls, consistent with the literature. In addition, like Calderon et al. 15, our study showed
that weight loss dieting was more strongly associ-ated with BMI among boys, with a twofold risk as compared to girls. One interesting finding is that the overall prevalence of excess weight among adolescents in the cohort was 23.2%. This asso-ciation can be approached in two different ways. First, weight loss dieting is being done by those who really need it, namely adolescents with ex-cess weight. On the other hand, it is worrisome that adolescents 11 years of age already show a high proportion of weight loss dieting, probably as a consequence of excess weight. In addition, these adolescents may be suffering from societal pressure to pursue a slim appearance.
Resumo
Evidências mostram efeitos negativos de dietas sem orientação e de alta restrição calórica. O objetivo do estudo foi determinar o percentual de adolescentes que realizaram regime de emagrecimento e os fatores associados a este comportamento. Estudo transversal incluindo 4.452 nascidos em Pelotas, Rio Grande do Sul, Brasil, no ano de 1993. Os adolescentes que rela-taram ter feito algum tipo de regime com a finalidade de emagrecimento nos últimos 12 meses foram posi-tivos ao desfecho. A freqüência de realização de regi-me foi de 8,6% (IC95%: 7,7;9,4), sendo maior entre as meninas. O índice de massa corporal (IMC) materno elevado associou-se à realização de regime entre me-ninas. O sentimento do adolescente e dos pais em re-lação ao peso do jovem, o excesso de peso e o consumo de refrigerantes diet/light mostraram-se associados ao desfecho. Encontrou-se associação positiva entre regi-me e nível econômico. Tais achados constituem-se um importante subsídio para formação de políticas a fim de melhorar a dieta de adolescentes, uma vez que ex-pressa a grande preocupação com o peso, e assim, um porcentual significativo de indivíduos tendo compor-tamentos equivocados.
Perda de Peso; Consumo de Alimentos; Estado Nutri-cional; Estudos de Coorte
Contributors
S. W. Madruga participated in the literature review, data analysis and interpretation, and writing of the manus-cript. M. R. Azevedo collaborated in the data analysis and interpretation. C. L. Araújo, A. M. B. Menezes, and P. C. Hallal contributed to the coordination of the data collection, orientation, and revision of the manuscript.
Acknowledgments
The cohort study is supported by the Wellcome Trust. The initial phases of the cohort were funded by the Eu-ropean Union and the Brazilian National Program for Centers of Excellence (PRONEX), National Research Council (CNPq), and Ministry of Health.
References
1. Corvalán C. Latin America: avoiding the nutrition transition “trap”. Geneva: United Nations Standing Committee of Nutrition; 2006. (SCN News, 32). 2. Drewnowski A, Specter SE. Poverty and obesity:
the role of energy density and energy costs. Am J Clin Nutr 2004; 79:6-16.
3. de Onis M, Blössner M. Prevalence and trends of overweight among preschool children in develop-ing countries. Am J Clin Nutr 2000; 72:1032-9. 4. Patton GC, Selzer R, Coffey C, Carlin JB, Wolfe R.
Onset of adolescent eating disorders: popula-tion based cohort study over 3 years. BMJ 1999; 318:765-8.
5. Neumark-Sztainer D, Hannan PJ, Story M, Perry CL. Weight-control behaviors among adolescent girls and boys: implications for dietary intake. J Am Diet Assoc 2004; 104:913-20.
6. Victora CG, Araújo CLP, Menezes AMB, Hallal PC, Vieira MF, Neutzling MB, et al. Methodological aspects of the 1993 Pelotas (Brazil) birth cohort study. Rev Saúde Pública 2006; 40:39-46.
8. Thompson FE, Byers T. Dietary assessment re-source manual. J Nutr 1994; 124(11 Suppl):2245S-317S.
9. World Health Organization. WHO Expert Commit-tee on Physical Status: the use and interpretation of anthropometry. Geneva: World Health Organi-zation; 1995. (WHO Technical Report Series, 854). 10. World Health Organization. Obesity: preventing
and managing the global epidemic. Geneva: World Health Organization; 1998.
11. Biddle S, Cavill N, Sallis J. Young and active? Young people and health-enhancing physical activity: evidence and implications. London: Health Edu-cation Authority; 1998.
12. Mueller WH, Martorell R. Reliability and accuracy of measurement. In: Lohman TG, Roche AF, Mar-torell R, editors. Anthropometric standardization reference manual. Champaign: Human Kinetics Books; 1988. p. 83-6.
13. Victora CG, Huttly SR, Fuchs SC, Olinto MT. The role of conceptual frameworks in epidemiological analysis: a hierarchical approach. Int J Epidemiol 1997; 26:224-7.
14. Field AE, Austin SB, Striegel-Moore R, Taylor CB, Camargo Jr. CA, Laird N, et al. Weight concerns and weight control behaviors of adolescents and their mothers. Arch Pediatr Adolesc Med 2005; 159:1121-6.
15. Calderon LL, Yu CK, Jambazian P. Dieting practic-es in high school students. J Am Diet Assoc 2004; 104:1369-74.
16. Field AE, Aneja P, Austin SB, Shrier LA, de Moor C, Gordon-Larsen P. Race and gender differences in the association of dieting and gains in BMI among young adults. Obesity (Silver Spring) 2007; 15: 456-64.
17. Yannakoulia M, Karayiannis D, Terzidou M, Kokke-vi A, Sidossis LS. Nutrition-related habits of Greek adolescents. Eur J Clin Nutr 2004; 58:580-6. 18. Drewnowski A, Kurth CL, Krahn DD. Body weight
and dieting in adolescence: impact of socioeco-nomic status. Int J Eat Disord 1994; 16:61-5. 19. Boutelle KN, Hannan PJ, Neumark-Sztainer D,
Himes JH. Identification and correlates of weight loss in adolescents in a national sample. Obesity (Silver Spring) 2007; 15:473-82.
20. Shi Z, Lien N, Kumar BN, Holmboe-Ottesen G. Per-ceptions of weight and associated factors of ado-lescents in Jiangsu Province, China. Public Health Nutr 2006; 10:298-305.
21. Cheung PC, Ip PL, Lam ST, Bibby H. A study on body weight perception and weight control be-haviours among adolescents in Hong Kong. Hong Kong Med J 2007; 13:16-21.
22. Strauss RS. Self-reported weight status and dieting in a cross-sectional sample of young adolescents: National Health and Nutrition Examination Sur-vey III. Arch Pediatr Adolesc Med 1999; 153:741-7. 23. Field AE, Camargo Jr. CA, Taylor CB, Berkey CS,
Roberts SB, Colditz GA. Peer, parent, and media influences on the development of weight concerns and frequent dieting among preadolescent and ad-olescent girls and boys. Pediatrics 2001; 107:54-60.
Submitted on 05/Feb/2009