http://dx.doi.org/10.1590/s2175-97902017000400088
A
r
*Correspondence: H. V. A. Rocha. Laboratório de Sistemas Farmacêuticos Avançados, Farmanguinhos/Fiocruz. Av. Comandante Guaranys, 447 – Jacarepa-guá – 22775-903 - Rio de Janeiro – RJ – Brasil. E-mail: [email protected]
Prednisone raw material characterization and formulation
development
Leonardo Henrique Toehwé
1,2, Livia Deris Prado
3, Helvécio Vinícius Antunes Rocha
2,3,*¹Laboratório Químico-Farmacêutico da Aeronáutica, Rio de Janeiro, Brasil, ²Mestrado Proissional em Gestão, Pesquisa e Desenvolvimento na Indústria Farmacêutica, Farmanguinhos/Fiocruz, Rio de Janeiro, Brasil, ³Laboratório de Sistemas
Farmacêuticos Avançados, Farmanguinhos/Fiocruz, Rio de Janeiro, Brasil
Solid dosage forms for oral use, particularly tablets, are the most highly used dosage forms in therapy because they are easily administered, have high productivity and relatively low cost and provide a more stable drug to form a semi-solid net. Numerous parameters inluence the quality of the inal dosage form. In this study, the dissolution proile of 20-mg prednisone tablets bioequivalent to the reference product and three test formulations were evaluated using stability testing. During the study, prednisone tablets and the active pharmaceutical ingredient (API) prednisone from two diferent manufacturers were characterized with respect to their physical and physicochemical properties. The results showed that the dissolution proiles of the test batches and the reference product did not retain pharmaceutical equivalence throughout all the stability study. Notably, both samples of API prednisone were of the same crystal form, and any phase transition that occurred during the study could not be attributed to dissolution variation during stability.
Keywords: Prednisone/tablets/dissolution. Solubility. Formulation. Stability
INTRODUCTION
Prednisone is a glucocorticoid that is extensively used in clinical practice (Romanholi, Salgado, 2007). Its therapeutic use is recommended for a variety of acute and chronic diseases, such as arthritis, hepatitis, allergic diseases, asthma, leprosy, and numerous other autoimmune
and inlammatory diseases (Kaiser, Kley, 2002).
In Brazil, there are several industries commercialising prednisone in the form of oral immediate release tablets. Currently, Meticorten® is the reference product for these formulations at concentrations of 5, 20 and 50 mg (Anvisa, 2013).
Prednisone has the molecular formula C21H25O5 and a molar mass of 358.43 g/mol (Farmacopeia Brasileira, 2010). It is an odourless white or almost white powder that melts at 233 °C with decomposition and may exhibit polymorphism. At room temperature, this drug is poorly soluble in methanol, ethanol, chloroform and dioxane, with
low solubility in water (Farmacopeia Brasileira, 2010).
Prednisone is a neutral molecule, and its pKa values are not reported in the literature. Its solubility in water is 0.133 mg/
mL at 25 °C, and three values for the partition coeicient
(Log P) are reported in the literature: 1.46, 1.47 and 1.6 (Vogt et al., 2007; Passion, Gouveia, Morais, 2012).
Commercially active pharmaceutical ingredient (API) prednisone is an anhydrous, monohydrate or prednisone acetate salt. However, only the anhydrous and monohydrate forms are referenced in the Brazilian, European and United States Pharmacopoeia (European Pharmacopoeia, 2010; Farmacopeia Brasileira, 2010; USP, 2012).
According to parameters adopted by the International
Pharmaceutical Federation (FIP), prednisone is classiied as a class I drug of the Biopharmaceutical Classiication
System (BCS) and is highly soluble and permeable (Storpirtis et al., 2009). However, Vogt et al. (2007) argued in a review study that in the absence of conclusive data on permeability, absorption and solubility under the conditions recommended by the BCS, this drug does not
have a classiication deined in relation to the BCS.
in characteristics, such as crystal structure, particle size,
and luidity, can signiicantly impact on bioavailability
parameters, processability and stability (Fung, Ng, 2003; Iacocca, Burcham, Hilden, 2010).
Another issue that is rarely evaluated is related to the monitoring of the dissolution properties of formulations during stability. Although there is a regulatory prerogative
requiring the completion of the dissolution test for the stability study, there is no requirement for an analysis of the dissolution proile. Few authors have demonstrated the manner in which it makes a diference (Ochi et al., 2016; Payghan et al., 2012; Vidal et al., 2010).
The objective of the present study was to characterize the active pharmaceutical ingredient (API) prednisone and the formulation of a solid dosage form (tablet) for registration as a generic medicine and to evaluate the dissolution stability of this formulation.
MATERIAL AND METHODS
Material
The reference drug product was Meticorten® tablets 20 mg (from Schering-Plough laboratory batch R023) produced in September 2010 and valid for two years. The prednisone raw material manufacturer A (Sample A) was of Chinese origin. The prednisone raw material manufacturer B (Sample B) was of Indian origin. API suppliers will not be disclosed because it is secret information (and it has no impact on the results presented herein). The excipients were corn starch (Quimica BPAR), croscarmellose sodium (Blanver), magnesium stearate (Magnesia), sodium starch glycolate (Amishi Drugs and Chemicals Ltd), lactose monohydrate (DFE Pharma), sodium lauryl sulfate (Stephan Philippines Inc.), mannitol (Shandong Tianli
Pharmaceutical Co.), polyvinylpyrrolidone K30 (Nanhang
Industrial Co.), and magnesium silicate (Talmag Pharma-S).
METHODS
Raw material characterization
Differential scanning calorimetry
Analyses were performed using an exploratory differential calorimeter model 822e Mettler Toledo.
Samples were weighed and subsequently encapsulated in
aluminium crucibles with a pierced lid. The DSC curves were obtained at temperatures ranging from 25 to 300 °C
using nitrogen at a low rate of 80 mL/min as the purge
gas. Measurements were performed at the heating rates of 2.5, 5 and 10 °C/min.
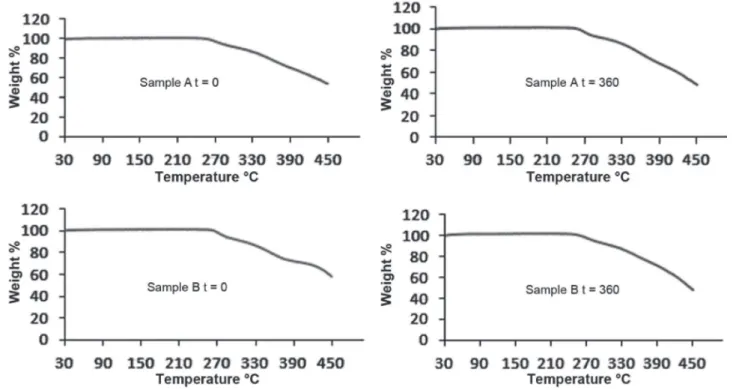
Thermogravimetric analysis (TGA)
T h e a n a l y s e s w e r e p e r f o r m e d u s i n g a thermogravimetric analyser Model Mettler Toledo 851e. Samples of approximately 3.5 mg were weighed and encapsulated in open aluminium pans. The TGA curves were obtained at a heating rate of 10 °C/min in the temperature range from 30 to 450 °C using nitrogen at a
low rate of 80 mL/min as the purge gas.
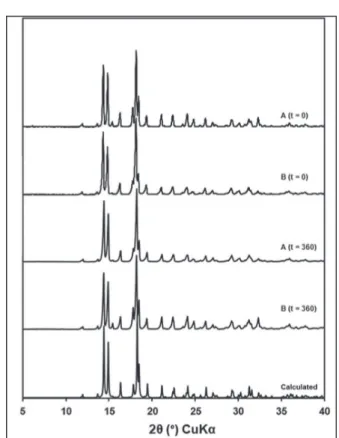
Powder X-ray diffraction
The X-ray diffractometer was operated with a potential difference across the tube of 30 kV and 15 mA. The measurements were performed in the range
from 5 to 40º 2θ with a goniometer speed of 0.05 °/ sec. The radiation used was CuKα (λ = 1.5418 Å). The experimental difraction patterns were compared with a simulated difraction pattern obtained from the Mercury
software (Macrae et al., 2008), which was prepared using the deposited structure at the Cambridge Crystallographic Data Structure Database (CSD) (Allen, 2002).
Fourier transform infrared spectroscopy
The analyses were conducted on a Shimadzu 8000 FTIR spectrometer Prestige applying infrared spectroscopy with Fourier transform (FTIR). Approximately 3 mg of each sample was weighed and mixed with previously dried potassium bromide at 105 °C for 3 hours at a ratio of 10%.
Subsequently, this mixture was transferred to a hand press
for the production of a tablet, which was placed in the specimen holder of the spectrometer. The same procedure was performed for the chemical reference substances (SQR) of the USP and Brazilian Pharmacopoeia. The spectra were recorded at 4000-400 cm-1.
Intrinsic dissolution
To determine the intrinsic dissolution, tablets were prepared from prednisone samples (manufacturers A and B). The samples were subjected to different levels of compressive forces. Then, their physical integrity was
veriied to be free from erosions, and the X-ray difraction
analysis was performed to evaluate a possible phase transformation. The pressure selected for the experiment was 1200 psi because the inserts exhibited no erosion and the drug showed no phase transition under this condition. Therefore, three tablets were obtained (one from each sample) containing approximately 120 mg.
Analyses were performed in a Distek Evolution 6100 dissolutor using the apparatus 2 for intrinsic
dissolution called the ixed disk. The ixed disc assembly
containing the inserts was deposited using forceps in a
sodium lauryl sulfate (w/v). During the experiment,
10-mL aliquots were collected without medium replacement
at 5, 10, 15, 20, 30, 45 and 60 minutes. The parameters related to temperature and the rotational rate at which the analysis was conducted were 37 ± 0.5 °C and 150 rpm, respectively. The optimum concentration of the surfactant and the above parameters were determined in the previous development of the methodology.
The analyses were performed in triplicate, and the amount of active drug released was obtained by reading the absorbance in a UV spectrophotometer at a wavelength of 242 nm. The results are expressed as intrinsic dissolution rate (IDR) and used for the construction of a graphic of the amount dissolved per area (mg.cm-2) versus time (minutes).
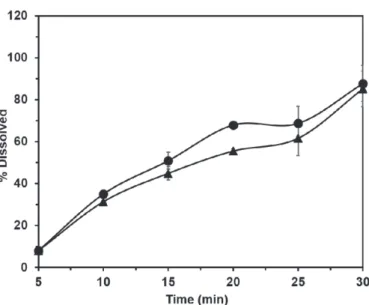
Powder dissolution
To determine powder dissolution behaviour by dispersion, 20 mg of each sample (A and B) was added to
the dissolution vessel containing 900 mL of puriied water.
The analysis was performed in triplicate with the same parameters used for the dissolution test for prednisone tablets described in the Brazilian Pharmacopoeia (Farmacopeia Brasileira, 2010) (temperature of 37 ± 0.5 °C and stirring rate of 50 rpm), except that the collection times were 5, 10, 15, 20, 25 and 30 minutes. The
dissolution proiles were compared using the similarity (F2) and diference (F1) factors.
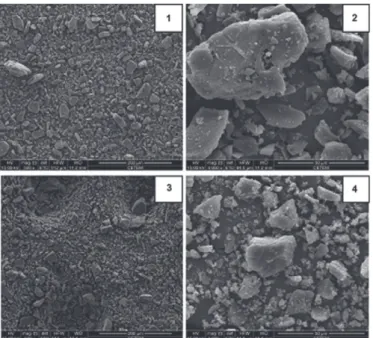
Scanning electron microscopy
Photomicrographs were obtained using a Quanta 400 scanning electron microscope (FEI). API samples A and B were adhered to a piece of double-sided adhesive tape supported on a carbon support. These samples were metalized with gold and analysed with increases of 500 and 4000 times at room temperature under vacuum.
Solubility
To determine the solubility of the samples (A and B), an excess of powder was added to the dissolution vessels
containing 500 mL of the following three diferent media: hydrochloric acid bufer pH 1.2, phosphate bufer pH 6.8
and distilled water pH 5.5. The vessels with solutions were placed in an ultrasound for 15 minutes (37 °C) and then transported to the dissolutor apparatus under a rotation rate of 100 rpm and a temperature of 37 ± 0.5 °C for 24 hours.
After this period, a 20-mL aliquot was withdrawn from each vessel, and the suspensions were iltered through a
0.45-µm membrane, diluted and then analysed by UV-Vis spectrophotometry at a wavelength of 242 nm (Okumu, Dimaso, Löbenberg, 2009; Wei, Löbernberg, 2006). Each
experiment was performed in triplicate, and the pH of each sample was monitored during the experiment.
Evaluation of the API according to pharmacopoeic criteria
The assay for prednisone samples A and B was performed using ultraviolet absorption spectrophotometry according to the method (A) described in the Brazilian Pharmacopoeia 5th edition (Farmacopeia Brasileira, 2010).
Formulation
The process used in the manufacturing of the pilot batches was wet granulation based on high shear with an
aqueous-based solution followed by luidized bed drying. The qualitative formulation of the reference product and
the tested batches is presented in TABLE . Three batches were produced: P0020020910, MEST01 and MEST02. All of the batches followed the same manufacturing process. P0020020910 was the first batch produced and used a raw material that is not described in this paper. This batch
was used in the bioequivalence study. Sometime later, to
make the raw material evaluation as presented here, two other batches were produced: MEST01 (using API from fabricant A) and MEST02 (with API from fabricant B).
The only diference between the batches is the raw material
fabricant (all other properties are the same). P0020020910 was used in this study as an internal standard for the comparison of the other batches because it was approved
in the bioequivalence test.
Tablet characterization
Tablet evaluation according to pharmacopoeic tests
Average weight tests, hardness, friability, disintegration time, assay and humidity followed the recommendations in the Brazilian Pharmacopoeia 5th edition (Farmacopeia Brasileira, 2010).
Dissolution profile
The dissolution profiles of the test and reference products were determined from the measurement of prednisone released at intervals of 5, 10, 15, 20, 25 and 30 minutes. The apparatus 2 (paddle) was used with a stirring rate of 50 rpm. The dissolution medium used was 900 mL of distilled water at 37 °C. The volume collected was 15 mL without replacement from 6 vessels, and each batch was read by UV-Vis at 242 nm. An SR8 PLUS Hanson Research dissolutor was used. To compare the dissolution
proiles of the samples under study, the independent model simple method based on a diference (F1) and a similarity
Stability study
Samples from all batches were stored in a controlled climate room with a temperature of 30 °C ± 2 °C and a relative humidity (RH) of 75% ± 5%. Analyses for the determination of content, hardness, disintegration time,
humidity and the dissolution proile were performed at 0,
90, 180, 270 and 360 days of the study.
RESULTS AND DISCUSSION
Prednisone API characterization
Thermogravimetric analysis (TGA)
From the TG curves (Figure 1) obtained for samples A and B, at zero and 360 days, both samples were thermally stable up to approximately 261 °C. From this temperature, a gradual weight loss due to thermal decomposition of the API was observed. This result excludes the possibility of said samples when treating the monohydrate form or solvate with chloroform, as reported in the literature, because the samples studied exhibited no mass loss until
the beginning of their thermal decomposition
(Kuhnert-Bramdstätter, Gasser, 1971; Mesley, Johnson, 1965).
Differential scanning calorimetry (DSC)
The calorimetric profiles presented in Figure 2 indicate the possibility that two different crystalline
forms exist because the melting peaks displayed diferent
temperatures. The results of the tests at 2.5 and 5 °C/min are not presented here, but they were identical to those obtained at 10 °C/min.
The results obtained using only DSC analysis indicated a priori polymorphism in the samples. These data
however contradict those obtained by X-ray difraction.
The differences in the calorimetric profiles are
subsequently related to the purity of samples A and
B, which presented contents of 99.7% and 98.5%, respectively. The presence of small amounts of impurities in a substance may decrease the melting point and increase its melting range (Donnelly et al., 1990). In the literature, authors have also used DSC to determine the purity of a given substance (Ferguson et al., 2000; Schnitzler et al., 2001). However, this technique should not be used for this purpose when the analyte decomposes during its fusion (Dooren, Muller, 1984), such as for prednisone (Farmacopeia Brasileira, 2010). Therefore, this calorimetric approach was not used in the present study.
Powder X-ray diffraction
Despite the question raised by DSC regarding the
presence of polymorphism in the samples, characterization
by X-ray difraction (Figure 3) conirmed the presence of
the same crystalline phase in samples A and B. The peaks
in the difraction pattern are the same in both samples. At both the initial and inal stability study times, there were no diferences in the 2θ peak positions. The study
also demonstrated that compared with an XRD pattern simulated from crystallographic data of an anhydrous crystalline form of prednisone deposited in the CSD (Allen, 2002), the samples had the same crystalline phase as that described here. Therefore, it is concluded that during the study period and at the temperature and relative humidity conditions used for storage, no crystalline phase transition was observed in the samples.
Infrared spectroscopy
T h e i n f r a r e d a b s o r p t i o n s p e c t r u m r e s u l t s demonstrated that at time zero, prednisone samples A and B alone exhibited absorption maxima at the same wavelength and the same relative intensities as those observed in the spectrum of samples of the USP and Brazilian Pharmacopoeia standards (Figure 4). At the
end of the study (t = 360), the spectra of samples A and B did not exhibit a signiicant shift in the positions of bands
related to the main functional groups compared with the results at time zero, suggesting no crystalline phase transition in the samples.
Intrinsic dissolution
The intrinsic dissolution rate (IDR) is an important
tool to evaluate the diferences between polymorphs and
solvates, particularly when there is a small amount of sample available (Qiu, Chen, Zhang, 2009). This type of dissolution evaluates the API in an isolated form, i.e.,
TABLE I - Excipients present in the reference medicine and pilot batches
Excipients R023 Test batches
Starch (corn) X X
Croscarmellose sodium X
Magnesium stearate X X
Sodium starch glycolate X
Lactose monohydrate X
Sodium lauryl sulfate X
Mannitol X
Povidone (PVP) X X
Magnesium silicate X
FIGURE 1 - TG curves obtained for prednisone samples A and B at zero and 360 days of study.
FIGURE 2 - DSC curves of samples A and B at a heating rate of 10 °C/min.
without the presence of excipients (Gibson, 2009). The IDR of a drug is expressed in mg/min/cm2, and its value
is obtained by dividing the angular coeicient obtained
from the straight dissolution equation by the surface area
As shown in Figure 5, the intrinsic dissolution
proiles revealed a pronounced linear behaviour because both samples had a coeicient of determination that was
greater than 0.99. With this linearity, it was concluded that there was no phase transition during the analysis and that the sink condition was also maintained during all times considered in the analysis.
Samples A (6.71 mg/min/cm2) and B (6.73 mg/ min/cm2) exhibited similar dissolution proiles and IDR. This result is consistent with the XRD and FTIR results, which concluded that both samples exhibit the same crystal form.
Similar to the results obtained in the solubility test to classify the samples as highly soluble according to the BCS, a study correlating the IDR of 15 drugs performed by Yu et al. (2004) considered that an IDR greater than 0.1 mg.min-1.cm-2 indicates high solubility, and drugs with lower values exhibit low solubility. Thus, according to
this study, both samples are classiied as highly soluble.
Zakeri-Milani et al. (2009) mentioned approximately 0.58, 0.63, and 3.45 mg/min/cm2 for furosemide (solubility of 1.474 mg/mL), ketoprofen (2.12 mg/mL), and atenolol (16.87 mg/mL), respectively. Dezani et al. (2013) reported that the zidovudine (solubility of ~20 mg/mL) IDR is 0.75 mg/min/cm2.
FIGURE 3 - Difraction patterns of prednisone samples A and
B at zero and 360 days of the stability study and the simulated pattern.
Powder dissolution
The results of the powder dissolution for both samples are presented in Figure 6. Samples A and B had a mean dissolution of 87.7% and 85.1% at 30 minutes, respectively. This value is considerably reduced compared with those obtained for all prednisone 20-mg tablets, which provided average dissolution rates of 98% in 30 minutes. This discrepancy in the results may have occurred
during the analysis because part of the active drug loated
on the surface of the medium and/or attached to the apparatus (paddle), forming a cluster. Therefore, part of the active added mass did not come into contact with the environment and did not undergo the dissolution process. This observation is not so common in tablet dissolution because the excipients in this case can enhance powder wettability and lower static properties verified in the powder alone.
Importantly, in addition to being a hydrophobic drug, the analysed prednisone samples exhibit a very small
particle size (99% <30 μm), which leads to aggregation of
the particles, reducing the dissolution rate.
To enable the numerical comparison of dissolution profiles obtained for samples A and B of the API, the
diference factor (F1) and similarity (F2) were determined,
and the results were 10.03 and 58.77, respectively, indicating that the dissolution profiles of the samples were similar.
Solubility (saturation)
The solubility, understood here as saturation, is a parameter that expresses a state of thermodynamic
equilibrium between the solvent and solute. This equilibrium is dependent on a number of experimental
conditions, such as temperature (Qiu, Chen, Zhang, 2009). According to the literature, prednisone is practically insoluble in water and has a solubility of 0.133 mg/mL at 25 °C (Vogt et al., 2007).
The knowledge of the solubility of an API is of fundamental importance to the determination of its
biopharmaceutical classiication. In accordance with the
BCS, the solubility should be determined at 37 °C and
in an aqueous medium with diferent pH values. Table II
presents the solubility values experimentally obtained according to the BCS for prednisone samples A and B.
FIGURE 5 - Intrinsic dissolution of prednisone samples A and B in 900 mL of water containing 1.2% sodium lauryl sulfate using apparatus 2 at 150 rpm.
FIGURE 6 - Comparison between powder dissolution proiles
of prednisone samples A (circle) and B (triangle).
TABLE II - Solubility values experimentally obtained according to the BCS for prednisone samples A and B
Media Solubility (mg/mL) at 37 ºC Volume (mL) necessary to solubilize 50 mg
Sample A Sample B Sample A Sample B
HCl bufer, pH 1.2 4.48 4.51 11.03 11.08
Water, pH 5.5 4.53 4.54 11.04 11.01
S a m p l e s A a n d B e x h i b i t e d a s o l u b i l i t y o f approximately 4.5 mg/mL at 37 °C for all tested pH values. This result is consistent with the information obtained from the literature that ranks prednisone as a
neutral molecule; therefore, changes in pH do not afect
its solubility (Vogt et al., 2007).
Based on these results, both samples can be
classiied as highly soluble, and the volume of medium required to dissolve 50 mg of prednisone (a larger dose
available for domestic dosage) was approximately 11 mL
at all pH values tested, which is signiicantly less than the
250 mL recommended by the BCS.
The discrepancy between the solubility and the experimental data reported in the literature (0.133 mg/
mL) may be related to the diferent temperatures at which
the solubility was determined because prednisone exhibits endothermic properties, i.e., its solubility increases with increasing temperature (Vogt et al., 2007).
Scanning electron microscopy
The photomicrographs obtained for both samples A and B (Figure 7) reveal irregular and small particles that are mostly smaller than 30 micrometres. Note that
these data are consistent with the results (99% ≤ 30 mM) obtained by laser difraction provided on the certiicate
of analysis (CoA) of the samples supplied by the manufacturers of both samples.
Active pharmaceutical ingredient evaluation using pharmacopeic criteria
Samples A and B were approved in all pharmacopeial tests. The contents found for the raw materials A and B at
diferent time intervals are presented in Table III.
The contents of both samples showed no signiicant
variation over the entire course of the study.
Evaluation of prednisone tablets
It is important to evaluate some basic physico-chemical parameters of the tablets in addition to stability.
During the development of drug products, quality control
of the dosage forms must be evaluated from a variety of
diferent aspects (Table IV).
According to the limits recommended by the Brazilian Pharmacopoeia 5th edition to assess weight change in uncoated tablets, all samples were within the established limit. Notably, in general, all lots had a small increase in average weight and values for the maximum and minimum weights observed. This finding may be related to the small increase in moisture that occurred in all lots during the stability study.
Regarding disintegration, lots P0020020910, MEST01 and MEST02, which were produced with the same formulation, presented maximum values of 3 minutes and 20 seconds.
Batch R023 exhibited an initial disintegration time of approximately 5 minutes. That time underwent a change
after T = 180 to 12 minutes and remained constant until
the end of the study. This increase may be related to the excipient povidone present in the formulation, as this polymer can form a film on particles of the granulate
and consequently the induration of the tablets over time,
thereby jeopardizing the process of disintegration and dissolution (Blok, 2007; Murthy, Guebre-Sellassie, 1993).
The Brazilian Pharmacopoeia 5th edition does not recommend tests for moisture in prednisone tablets, but
FIGURE 7 - SEM photomicrographs of sample A (1 and 2) and sample B (3 and 4).
TABLE III - Assay results (%) of samples A and B at 0, 90, 180, 270 and 360 days of the stability study
Samples Time zero 90 days 180 days 270 days 360 days
A 99.7 99.8 99.6 99.8 99.6
this parameter was evaluated during stability studies to assess a possible correlation with the mechanical strength
test and the dissolution proile of the tablets studied because
these data directly afect these parameters (Aulton, 2005).
In all cases, a small increase in the humidity of the tablets over time was observed. This pattern was also observed
TABLE IV - Compilation of the results of pharmacopoeic parameters of the formulations evaluated during the stability study
Parameter Result
R023 P0020020910 MEST01 MEST02
Average weight (mg)
T = 0 303.4 142.1 143.2 140.7
90 days 303.7 142.3 143.4 140.9
180 days 303.6 143.1 143.6 141.2
270 days 304.1 143.0 143.7 141.3
360 days 304.3 143.4 144.0 141.2
Disintegration (speciication <30 min)
T = 0 5 min 27 s 2 min 38 s 2 min 16 s 2 min 26 s
90 days 5 min 50 s 2 min 20 s 2 min 22 s 2 min 34 s
180 days 12 min 12 s 2 min 50 s 2 min 58 s 2 min 40 s
270 days 12 min 47 s 2 min 44 s 2 min 15 s 2 min 05 s
360 days 12 min 20 s 3 min 20 s 3 min 05 s 3 min 20 s
Humidity content (%)
T = 0 2.53 5.71 4.71 4.67
90 days 2.62 5.85 4.78 4.70
180 days 2.75 6.26 4.65 4.73
270 days 2.68 6.32 4.77 4.87
360 days 3.23 6.25 5.20 4.96
Hardness (N) (average ± RSD)
T = 0 57.4 ± 8.7 53.1 ± 8.1 21.6 ± 6.1 33.0 ± 6.5
90 days 60.5 ± 5.1 55.6 ± 10.5 23.4 ± 10.7 33.6 ± 11.3
180 days 64.9 ± 9.5 56.8 ± 5.6 23.9 ± 5.9 35.5 ± 6.7
270 days 65.8 ± 5.6 56.2 ± 7.5 25.2 ± 7.4 38.5 ± 5.9
360 days 66.4 ± 6.8 55.8 ± 5.7 25.7 ± 5.6 38.7 ± 7.3
Friability (speciication < 1%)
T = 0 0.42 0.33 0.72 0.58
90 days NR 0.36 0.67 0.43
180 days NR 0.29 0.54 0.49
270 days NR 0.25 0.45 0.33
360 days NR 0.21 0.20 0.24
Assay (speciication 90-110%) (average ± RSD)
T = 0 106.7 ± 0.3 100.6 ± 0.4 100.4 ± 0.4 101.7 ± 0.2
90 days 106.0 ± 0.2 100.4 ± 0.2 100.0 ± 0.9 101.2 ± 0.3
180 days 105.9 ± 0.5 100.1 ± 0.4 100.7 ± 0.2 101.3 ± 0.3
270 days 105.7 ± 0.3 100.2 ± 0.7 100.3 ± 8.4 100.7 ± 0.5
360 days 105.8 ± 0.3 99.9 ± 0.2 100.1 ± 0.7 100.4 ± 0.2
for the reference drug product, and a humidity variation slightly greater than the reference remains for the test drug. For a PVC, i.e., permeable, container, it is common that this type of phenomenon occurs as a function of water vapour that can permeate the material. Because there is
no speciication for this parameter, it was only evaluated
for monitoring and possible correlation with other data. According to the Brazilian Pharmacopoeia, the hardness test is informative but does have existing approval parameters (Farmacopeia Brasileira, 2010). Therefore, this test is used in process control in the pharmaceutical industry for internally monitoring and controlling a variation of this
parameter in tablets of the same batch or in diferent batches, as a signiicant change in hardness may be due to a deviation in the quality of the raw materials used or the production
process. However, the mechanical strength of the tablets can also be altered during storage. Such changes can be caused by numerous factors, including moisture absorption, changes in crystal structure and plastic deformation of particles (Aulton, 2005).
The results obtained during the stability study indicate a small increase in hardness for all batches. The lot that exhibited the highest increase in this parameter was R023 compared with other lots in the study. Similar to disintegration, the increase in hardness was potentially triggered by the association of factors, such as increased moisture absorption and the use of povidone in the tablets
(Blok, 2007; Murthy, Guebre-Sellassie, 1993).
The friability results reveal an increase in the mechanical resistance to attrition of the tablets during the stability study, which may be associated with the moisture absorbed by the tablets. This moisture would lead to the formation of solid bridges between particles, increasing their resistance (Aulton, 2005). Importantly, the friability for the R023 batch was not assessed at all study times due to the unavailability of that lot on the market, but it has no impact on the statements presented here.
All results of content and uniformity of content are approved. However, a certain strangeness was noted in the content values for the reference product. Despite falling in the range of approval, these values are well above average, tending towards the upper range limit. This type of result suggests that one cannot categorically state that there is an addition of excess active ingredient during manufacturing, a practice known as overage, which is not recommended by regulators. No statement of fact is reported here, only that the results are peculiar and may denote a practice out
of favour in the pharmaceutical ield.
Dissolution profiles of the tablets
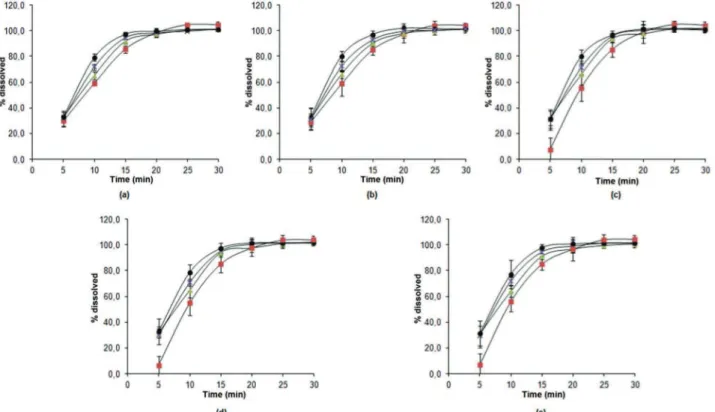
The individual results of the dissolution profiles of lots R023, P0020020910, MEST01, and MEST02 at zero, 90, 180, 270 and 360 days of the stability study are presented in Figure 8.
FIGURE 8 – Dissolution proiles of prednisone tablets for batches R023(■), P0020020910 (●), MEST01 (▲), and MEST02 (x) at
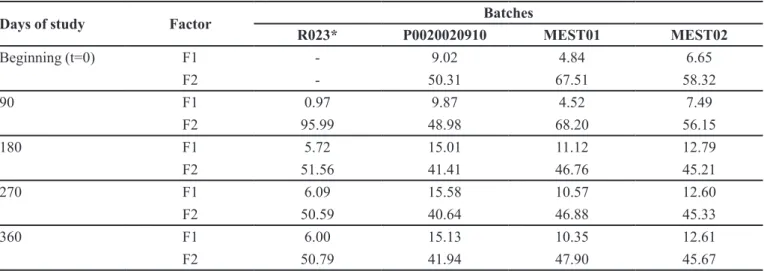
The F1 and F2 values, comparative indices used for
the evaluation of the similarity and diference between
two dissolution profiles were also calculated to better verify the monitoring of lots for stability. The results are presented in Table V.
Batch P0020020910 exhibited an average release rate that was greater than 85% within 15 minutes for all
time points in the stability proile, which was maintained
during the entire study. Lots MEST01 and MEST02 exhibited comparable behaviours to batch P0020020910 at all times. Therefore, in a manner analogous to the above analysis, it is concluded that these batches maintained
their respective dissolution proiles compared with those
obtained at time zero.
Although batch R023 presented an average release rate exceeding 85% within 15 minutes and values less than 15 for F1 and greater than 50 for F2 at all times of the stability study, the results presented in Table 5 and Figure
24 indicate that this batch underwent a signiicant change in its dissolution proile. This change began at t = 180 and remained at t = 270 and t = 360, when an active release within ive minutes of 7.5%, 6.6% and 6.7%, respectively, was observed. These values difer from the percentage release rates observed at time t = 0 and t = 90, which were 29.9% and 28.8%, respectively, within ive minutes. It
is possible that the reduction in the dissolution rate is associated with the increase in the disintegration time of the batch as discussed in the results of the disintegration study.
Comparison of dissolution profiles is a useful tool when the behaviour of two drugs must be known before conducting a study of relative bioavailability/
bioequivalence or pharmaceutical equivalence to claim
exemption from such studies or for a possible post-registration change (Anvisa, 2011; 2010). However, when performed during the stability study, this comparison enables the evaluation of whether a formulation that has an
initial dissolution proile equivalent to another formulation
maintains that status throughout its shelf life.
Importantly, the rate at which a drug is released from its dosage form can be a limiting factor in the rate of absorption. Thus, a possible variation in this parameter during storage can cause a change in the beginning intensity or duration of a therapeutic response (Murthy, Guebre-Sellassie, 1993).
All batches of 20-mg prednisone tablets submitted to the study met the acceptance criteria established in
the oicial monograph (Farmacopeia Brasileira, 2010),
which must have a dissolution rate greater than 80% after 30 minutes of the test. According to the current Brazilian regulatory perspective, it is not necessary to
calculate factor F1 or F2 for drugs of high solubility and rapid dissolution formulations. Therefore, batches P0020020910, MEST01 and MEST02 maintained their
dissolution proiles equivalent to that of batch of R023
because these batches exhibited a dissolution that was
greater than 85% for the irst 15 minutes (Anvisa, 2010).
However, during the study period, the F1 and F2 values calculated for lots P0020020910, MEST01 and MEST02 (Table V) showed a reduction of similarity and an increase in the difference between their dissolution profiles compared with batch R023. Of note, such a reduction
was more directly related to the diferent proile of the
reference product than to the problems or discrepancies in test batches.
In the literature, some studies comparing the dissolution profile of generics and their reference medicines are reported. Operto and collaborators (2008) compared 10 brands of paracetamol tablets produced in Argentina. They concluded that despite the tablets
fulilling all pharmacopeial requirements, they exhibited a remarkable diference in dissolution proiles. Kohler et al. (2009) evaluated the dissolution proiles of ive generic 500 mg dipyrone tablets and concluded that none were
equivalent to the reference drug product.
Similarly, Brum et al. (2012) analysed 8 brands of 750-mg paracetamol tablets available in Brazil and also found that one of the generic brands did not show
a dissolution proile equivalent to that of the reference product. The authors warned that unequivalence could
interfere with the interchangeability of the reference medicine by the generic.
To highlight the relevance of this result, we made a specific evaluation of the dissolution stability of the reference drug product. Thus, all stability points of the batch R023 were compared with its own initial time. This type of evaluation has been reported by Murthy and Guebre-Sellassie (1993) as an important tool to predict the performance of a tablet during stability and to
demonstrate whether it retains the same quality during the
shelf-life. Most regulatory recommendations (as in Brazil) exclusively claim the dissolution results for registration
but not the dissolution proile.
As noted in Table V, based on F1 and F2 values, the
reference medicine was stable during the irst year of the
stability study. However, F2 was reduced from 95.99 at 90 days to 50.79 in one year, which is at the borderline of the approval limit. In the next stability point, the drug would likely be disapproved. Given that the shelf-life declared in
the package of the medicine is 2 years, it can be questioned
whether a patient taking this product close to this time is
clinical eiciency. Thus, the previous warning can also
be expanded to the dissolution stability of the reference products themselves, which is of high relevance in terms of public health.
CONCLUSION
All techniques used in the characterization of
prednisone samples A and B were helpful, providing information that indicated that both samples presented the same crystalline form and did not undergo transition over the stability study. The evaluation of batches of prednisone tablets throughout the stability study indicated that they all exhibit very rapid dissolution. Notably, when analysed
individually, the dissolution proiles of all batches, except
R023, exhibited minimal variation and remained similar during the entire study period. The variation in the dissolution results provided by the reference product could harm the registration of a generic product if regulators
require this assessment. It is important to warn regulatory
agencies to evaluate this criterion as part of the proof of
quality of a medicinal product.
REFERENCES
Agência Nacional de Vigilância Sanitária. ANVISA. Instrução Normativa nº. 2, de 14 de março de 2013. Determina a publicação da lista de fármacos candidatos à bioisenção baseada no sistema de classiicação biofarmacêutica. Diário Oicial da União, 4 mar. 2013.
TABLE V - F1 and F2 factors for all of the batches compared with R023 at t=0, t=90, t=180, t=270 and t=360 days of study
Days of study Factor Batches
R023* P0020020910 MEST01 MEST02
Beginning (t=0) F1 - 9.02 4.84 6.65
F2 - 50.31 67.51 58.32
90 F1 0.97 9.87 4.52 7.49
F2 95.99 48.98 68.20 56.15
180 F1 5.72 15.01 11.12 12.79
F2 51.56 41.41 46.76 45.21
270 F1 6.09 15.58 10.57 12.60
F2 50.59 40.64 46.88 45.33
360 F1 6.00 15.13 10.35 12.61
F2 50.79 41.94 47.90 45.67
* This batch was evaluated by comparing its own results during stability to t=0.
Agência Nacional de Vigilância Sanitária. ANVISA. Resolução nº. 31, de 11 de agosto de 2010. Requisitos para realização dos estudos de equivalência farmacêutica e de peril de dissolução, a serem atendidos pelos centros de equivalência farmacêutica e patrocinador do estudo. Diário Oicial da União, 12 ago 2010.
Agência Nacional de Vigilância Sanitária (Brasil). ANVISA. Resolução nº. 16, de 2 de Março de 2007. Registro de Medicamento Genérico. Diário Oicial da União, 5 ago. 2011.
Allen FH. The Cambridge structural database: a quarter of million crystal structures and rising. Acta Crystallogr, Sect B: Struct Sci. 2002;58(1):380-8.
Aulton ME. Delineamento de formas farmacêuticas.Porto Alegre: Artmed; 2005. 677 p.
Blok LC. Desenvolvimento e caracterização de comprimidos de metformina 500 mg de liberação imediata: efeito de aglutinantes [mestrado]. Itajaí: Universidade do Vale do Itajaí; 2007. 91 p.
Brum TF, Laporta LV, Junior FRP, Gonçalves CA, Santos MR. Equivalência farmacêutica e estudo comparativo dos peris de dissolução de medicamentos genéricos contendo paracetamol. Rev Cienc Farm Basica Apl. 2012;33(3):373-8.
Donnelly JR, Drewes LA, Johnson RL, Munslow WD, Knapp KK. Purity and heat of fusion data for environmental standards as determined by diferential scanning calorimetry. Thermochim Acta. 1990;167(2):155-87.
Dooren AA, Miiller BW. Purity determinations of drugs with
diferential scanning calorimetry (DSC): critical review. Int J
Pharm. 1984;20(3):217-33.
European Pharmacopoeia. 6. ed. Council of Europe:Strasbourg; 2010.
Farmacopeia Brasileira. 5. ed. São Paulo: Atheneu; 2010.
Ferguson HF, Frurip DJ, Pastor AJ, Peerey LM, Whiting LF. A review of analytical applications of calorimetry. Thermochim Acta. 2000;363(1):1-21.
Fung KY, Ng KM. Product-centered processing: pharmaceutical tablets and capsules. AIChE J. 2003;49(5):1193-215.
Gibson M. Pharmaceutical Preformulation and Formulation. 2. ed. v.199. New York: Informa Healthcare USA; 2009. 541 p.
Iacocca RG, Burcham CL, Hilden LR. Particle engineering: A strategy for establishing drug substance physical property speciications during small molecule development. J Pharm Sci. 2010;99(1):51-75.
Kaiser H, Kley HK. Cortisontherapie: corticoide in klinik und praxis. 11. ed. Thieme: Stuttgart; 2002.
Kohler LF, Nascimento HD, Schwengber ELL, Bandeira ZMP, Pazin GV, Machado SRP. Avaliação biofarmacotécnica e peril de dissolução de comprimidos de dipirona: equivalências farmacêutica entre medicamentos de referência, genéricos e similares. Rev Bras Farm. 2009;90(4):309-15.
Kuhnert-Bramdstätter M, Gasser P. Solvates and polymorphic m o d i f i c a t i o n s o f s t e r o i d h o r m o n e s . M i c r o c h e m J . 1971;16(4):590-601.
Macrae CF, Bruno IJ, Chisholm JA, Edgington PR, Mccabe P, Pidcock E, Rodrigues-Monge L, Taylor R, Van de Streek J, Wood PA. New features for the visualization and investigation of crystal structures. J Appl Crystallogr. 2008;41:466-70.
M e s l e y R J , J o h n s o n C A . I n f r a r e d i d e n t i f i c a t i o n o f pharmaceutically important steroids with particular reference to the occurrence of polymorphism. J Pharm Pharmacol. 1965;17:329-40.
Murthy KS, Ghebre-Sellassie I. Current perspectives on the dissolution stability of solid oral dosage forms. J Pharm Sci. 1993;82(2):113-25.
Ochi M, Kimura K, Kanda A, Kawachi T, Matsuda A, Yuminoki K, Hashimoto N. Physicochemical and pharmacokinetic characterization of amorphous solid dispersion of meloxicam with enhanced dissolution property and storage stability. AAPS PharmSciTech. 2016;17(4):932-9.
Okumu A, Dimaso M, Löbenberg R. Computer simulations using GastroPlus™ to justify a biowaiver for etoricoxib solid oral drug products. Eur J Pharm Sci. 2009;72(1):91-8.
Operto MA, Castellano PM, Kaufman TS. Evaluacion y analisis de parametros de calidad de comprimidos de paracetamol. Lat Am J Pharm. 2008;27(4):603-7.
Passion P, Gouveia LF, Morais JAG. Prediction of the human oral bioavailability by using in vitro and in silico drug related parameters in a physiologically based absorption model. Int J Pharm. 2012;429(1-2):84-98.
Payghan SA, Kate VK, Purohit S, Bhandari A. Efect of aging conditions on the dissolution and diffusion stability of non aqueous emulsion. Inventi Rapid: Pharm Tech. 2012;3:1-7.
Qiu Y, Chen Y, Zhang GZ. Developing solid oral dosage forms: pharmaceutical theory and practice. London: Elservier; 2009. 907 p.
Romanholi DJPC, Salgado LR. Síndrome de cushing exógena e retirada de glicocorticóides. ABEM. 2007;51(8):1280-92.
Schnitzler E, Carvalho-Filho MAS, Stadler CC, Volpato AM, Ionashiro M. Aplicação da calorimetria exploratória diferencial (DSC) na caracterização térmica do acetato de dexametasona, excipientes e do creme de dexametasona. Eclética Quím. 2001;26:1-18.
S t o r p i r t i s S , G o n ç a l v e s J E , C h i a n n C , G a i M N . Biofarmacotécnica. Ganabara Koogan: Rio de Janeiro; 2009. 321 p.
United States Pharmacopeia. USP 35. Rockville: The United States Pharmacopeial Convention; 2012.
Vogt M, Derendorf H, Krämer J, Junginger HE, Midha KK, Shah S, Dressman JB, Barends DM. biowaiver monographs for immediate release solid oral dosage forms: prednisone. J Pharm Sci. 2007;96(6):1480-9.
Wei H, Löbenberg R. Biorelevant dissolution media as a predictive tool for glyburide a class II drug. Eur J Pharm Sci. 2006;29(1):45-52.
Yu LX, Carlin AS, Amidon GL, Hussain AS. Feasibility studies of utilizing disk intrinsic dissolution rate to classify drugs. Int J Pharm. 2004;270(1–2):221-7.
Zakeri-Milani P, Barzegar-Jalali M, Azimi M, Valizadeh H. Biopharmaceutical classification of drugs using intrinsic dissolution rate (IDR) and rate intestinal permeability. Eur J Pharm Biopharm. 2009;73(1):102-6.
Received for publication on 29th November 2016