Phenotypic stability in cassava estimated by the
AMMI analysis with supplementary genotypes
Lizz Kezzy de Morais
1*, Antônio Dias Santiago
1and Manoel
Henrique Bonfim Cavalcante
2Abstract: Adaptability is the yield response of cassava genotypes to
environmen-tal improvement, and stability is the predictability of this response to variations. The objective of this study was to evaluate the yield stability and adaptability of cassava varieties and clones using the AMMI (Additive Main Effects and Multipli
-cative Interaction) methodology and auxiliary tools as supplementary genotype and environment. The responses of 24 cassava genotypes were evaluated in
three environments located in the state of Alagoas, Brazil, in randomized blocks
design, with 24 treatments and three replications. The effects of genotype and genotype x environment interactions significantly influenced yield. Genotypes differed regarding the adaptability and stability of yield response, and the va
-rieties Cria Menino and Preta do Araripe were considered ideal genotypes due to high adaptability and yield stability. Among the three tested environments, Limoeiro de Anadia was the best since it presented high yield, phenotypically stable genotypes for cassava breeding programs.
Key words: Manihot esculenta, ideal genotype, ideal environment, genotype
x environment interaction.
Crop Breeding and Applied Biotechnology
17: 366-372, 2017
Brazilian Society of Plant Breeding. Printed in Brazil
http://dx.doi.org/10.1590/1984-70332017v17n4a55
ARTICLE
*Corresponding author:
E-mail: [email protected]
Received: 17 August 2016
Accepted: 13 June 2017
1 Embrapa Tabuleiros Costeiros, Unidade de Execução de Pesquisa de Rio Largo (UEP - Rio Largo), Campus Delza Gitaí, 57.100-000, Rio Largo, AL, Brazil 2 Secretaria Municipal de Agricultura de Ara -piraca, 57.310-245, Ara-piraca, AL, Brazil
INTRODUCTION
Cassava is an economically and socially important root vegetable since it generates labor and income for small farmers in large areas of the developing world. The use of Cassava co-products, such as the aerial parts and roots, has grown in recent years, being used to produce tapiocas, special flours, appetizers, and animal feeding. Brazil is currently the world’s second largest cassava producer, although the mean yield (14.82 ton ha-1) is 59% lower than that of
India (35.65 ton ha-1) (FAO 2016). Cassava is the sixth most widely planted crop
in Brazil. Cassava yield accounted for 22.53 million tons in the year of 2016, most of which (61%) was produced in the North, Northeast and South-Central regions (IBGE 2016). In the Northeast, in the 2015/2016 harvest, the largest planted areas occurred in the states of Bahia (290 million ha) and Maranhão (158 million ha), and the most productive states were Alagoas (14.17 ton ha-1)
and Sergipe (15.39 ton ha-1) (IBGE 2016).
genotype x environment interactions, by repeating the trials in several regions of interest and testing a large number of genotypes in several different environments (Sagrilo et al. 2008). Phenotypic variation in characteristics such as yield is a result of the joint action of the genotype (G), environment (E) and their interaction (GxE), and reflects differences in the response of genotypes to environmental variation (Allard and Bradshaw 1964). Consequently, selection procedures solely based on the mean yield of genotypes in a given environment are ineffective, and the identification of high yield cultivars should be based on GxE interactions (Morais et al. 2008).
The evaluation of the GxE interactions using the F-test is relatively straightforward. However, this analysis does not generate detailed information on how the genotypes respond to environmental variations. Therefore, the study on both adaptability and stability of genotypes is desirable in order to identify those with the most predictable responses to diverse environments. Among the several methodologies to analyze adaptability and stability (Eberhart and Russel 1966, Lin and Binns 1988, Gauch and Zobel 1996, Toler and Burrows 1998), the multivariate AMMI or Additive Main Effects and Multiplicative Interaction Analysis is the most widely used in Brazil (Carbonell et al. 2004, Pacheco et al. 2005, Kvitschal et al. 2007, Kvitschal et al. 2009, Gonçalves et al. 2009, Gonçalves et al. 2010, Oliveira et al. 2010, Mattos et al. 2013, Barros et al. 2013, Oliveira et al. 2014). This method combines analysis of variance and principal components to adjust the main effects (genotypes and environments) and the effects of G×E interactions (Duarte and Vencovsky 2001, Zobel et al. 1988). The AMMI analysis can assist the identification of high yield genotypes that are adapted to different environmental conditions, and these analyses are ideal to generate recommendations for regions of agronomic zoning. The purpose of this study was to evaluate the phenotypic stability and adaptability of 24 cassava genotypes in three distinct environments in the state of Alagoas, using the AMMI analysis with a supplementary genotype tool to identify the ideal genotype and the environment for cultivation.
MATERIAL AND METHODS
Yield stability of 24 genotypes of cassava roots was evaluated in three municipalities in the agrestic region of the state of Alagoas, Brazil: Arapiraca (lat 9°45’ 9” S, long 36° 39’ 39” W, alt 264 m asl), in Lagoa da Canoa (lat 9° 55’ 31” S, long 36° 28’ 33” W, alt 175 m asl), and Limoeiro de Anadia (lat 9° 45’ 9” S, long 36°39’ 40” W, alt 264 m asl).
All experiments consisted of randomized block design with three replications. Plots of 40 m2 were used and cultivated
according to the technical recommendations for cassava (Ferreira Filho et al. 2013). Genotypes were evaluated for root yield (ton ha-1). Data for root yield per plot were acquired 16 months after planting. Initial analysis of variance
was performed for each environment to verify the existence of differences between varieties. After these analyses, homogeneity between residual variances was determined using the Hartley test (Ramalho et al. 2005). Joint analysis of variance was used to test genotype effects, environment effects and the magnitude of the G×E interaction. Joint analysis and homogeneity test were performed using the Genes software (Cruz 2013).
In the presence of significant interactions, stability and adaptability phenotypic analyses were performed according to the AMMI methodology (Zobel at al. 1988), using the supplementary genotype and environment proposed by Duarte and Vencovsky (1999), Pacheco et al. (2005), which in this study will be called genotype and ideal environment. Multivariate procedures have been studied in cassava by Kvistichal et al. (2006), Carvalho et al. (2008) and Ojulong et al. (2010).
The AMMI analysis (Zobel et al. 1988) combines, in a single model, additive components for the main effects of genotypes (gi); environments (ej) and multiplicative components to the effect of the interaction (geij). Besides the
conventional terms of a joint analysis (μ, gi, ej, ε
ij), the model includes terms from the principal component analysis
(PCA) applied to the matrix of interactions GE(mxn) = [(ge�)ij], being (ge�)ij = Yij–Ȳi.–Ȳ.j + Ȳ... Therefore, the model that
describes the mean yield of the genotype i in environment j (j=1,2,…, n)is:
Yij = μ + gi + ej + Σn
k=1 λkγikαjk + ρij + εij , in which Y
ij is the mean yield from genotype i in environment j; μ is the general mean yield; gi is the effect of genotype i; e
j is the effect of environment j; λk is the k singular value of GE (scalar) from matrix GE(mxn); γik is the genotype i in
the singular column vector of matrix GE(mxn); αjk is the environment j in the singular vector line of matrix GE(mxn) ; ρ ij
is the residue (noise portion) associated with the term (GE)ij of classic interaction of the genotype i with environment j; and the ε
The AMMI analysis recovers the systematic portion of the sum of squares of the genotype interaction with environments (SQGE), known as standard and noise portion, being the latter considered the portion with mistakes discarded to improve
the predictive capacity of the model. In AMMI models, the most appropriate choice in terms of the number of axis to be retained (PCA) and capable of explaining the interaction of the standard portion is determined by the (SQGE) ratio,
accumulated until the nth axis (Σn
k–1 λk/SQGE).
The FR test (Cornelius et al. 1992) was used to evaluate the AMMI residue and the choice of the significant PCA axis. A significant result suggests that at least a multiplicative term must still be added to the already adjusted n axis until
the best AMMI model is found. The results of the stability and adaptability analysis can be interpreted with a biplot graph obtained from combinations of the PCA scores capturing the standard portion interaction (stable). A hypothetical genotype and environment were then introduced, referred to as the supplementary genotype and environment (GS and
E
S), according to Pacheco et al. (2005).
This study also included the ideal genotype and environment (GI and EI), which were estimated according to Lin and
Binns (1988). The quadratic distances were estimated between a point corresponding to an evaluated genotype and GI(d2is),
and between the environments and the EI(d2js). These distances provide measures of similarity between the evaluated
genotypes and GI, and between the tested environments and EI, and identify the genotypes and the environments with
the highest yield stability and adaptability. A quadratic distance can be easily calculated by: d2
is= Σ
n
k=1 (CPAik–CPAsk) 2 and
d2
js = (CPAjk–CPAsk)
2 , where i and j represent, respectively, the genotype and environment evaluated; s is the genotype
or supplementary environment or ideal genotype and ideal environment; and k is the axis or principal component
by interaction (PCA) selected by the AMMI model, according to Pacheco et al. (2005). Analyses were carried using a computer routine in the Statistical Analysis System/Interaction Matrix Language (SAS/IML), based on a software made available by Duarte and Vencovsky (1999).
RESULTS AND DISCUSSION
The joint analysis of variance showed significant differences (p<0.001) and (p<0.005) for environments (E), genotypes (G) and the GxE interactions (Table 1). Significant GxE interaction indicates the different performance of genotypes in different environments. The coefficient of variation (CV) of the joint analysis performed with original data was of 16.13%, indicating good experimental precision.
Significant interactions between environment and cassava cultivars have been reported by different authors (Rimoldi et al. 2003, Kvitschal et al. 2007, Kvitschal et al. 2009, Costa et al. 2013, Santiago et al. 2015). The GxE interaction was decomposed by the AMMI into two principal components, but only de first axis was significant based on the FR test
(Cornelius et al. 1992).
An AMMI analysis of cassava root yield in three production environments in the state of Alagoas showed that 72.88% of the sum of squares of the G×E interaction was explained, respectively. PCA1 explained 72.88% of SSGE, indicating that the entire pattern adjacent to the genotype x environment interactions focuses on the first axis (Table 1). The first AMMI axis shows that 72.88% of the SSGE of the interaction corresponds to the standard adjacent to the genotype x
Table 1. Summary of the AMMI analysis for root yield (ton ha-1) and the respective values of F for 24 cassava genotypes (Manihot
esculenta Crantz) in three environments in the state of Alagoas, and proportion of SSGxE interaction (sum of squares of the interac -tion) for each main axis of the analysis
Sources of variation df MS F/FR Proportion/Axis (%) Accumulated
Genotype (G) 23 165.9108 2.85**
Environment (E) 2 6995.63 120.34**
G x E 46 96.5964 1.66*
PCA12 24 34.9748 0.3692 0.7288 72.8831
Residue 1 22 14.1957 0.1499
PCA22 22 14.1957 0.1499 0.2712 100.0000
Residue 2 0 0.0000 0.0000
Mean error 79 94.7207
2 PCA=Principal Component Analysis; *, ** Significant at 5 and 1% by the F
environment interaction related to the characteristics of agronomic importance, and 27.12% represents the noise, i.e., the random variation resulting from the influence of micro environmental factors with no agronomic importance. Comparison of AMMI analysis applied to several different cultures indicates that this analysis typically explains 60% of the total variation by the SSGE interaction (Carbonell et al. 2004, Kvitschal et al. 2007, Gonçalves et al. 2009, Gonçalves et al. 2010, Barros et al. 2013, Costa et al. 2013, Mattos et al. 2013, Oliveira et al. 2014).
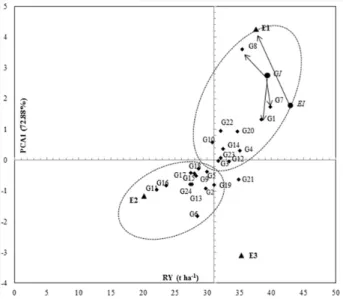
According to Barros et al. (2013) and Duarte and Vencovsky (1999), to estimate and remove noises, the AMMI analysis is a powerful tool to remove the random variation process, which improves the accuracy of the GxE interactions estimates, and consequently improves the genotypes means. Thus, in this study, genotypes response was estimated based on the AMMI1 model, and the graphical interpretation of adaptability and stability was performed using PCA1 by in the AMMI1 biplot graph (Figure 1).
Figure 1 shows the biplot graph resulting from the AMMI1 method, in which the abscissa represents the mean of genotypes and environments, and the ordinate represents the first principal component axis (PCA1).
The cassava variety Platina (G7) had the highest root yield (39.84 ton ha-1). Varieties Preta do Araripe (G1), Cria
Menino (G8), Sergipe (G20), and the Clone 1986-86-24 (G21)
were characterized by means between 34 and 40 ton ha-1. Limoeiro de Anadia (E1), Arapiraca (E2) and Lagoa da Canoa
(E3) have mean root yield of 35.58 ton ha-1, 20.14 ton ha-1, and 35 ton ha-1, respectively (Tables 1 and 2). Kvitschal et al.
(2007) evaluated the adaptability and yield stability of cassava in the state of Paraná, and concluded that the analysis was efficient in evaluating yield stability and adaptability, indicating the clone IAC 190 as the most promising variety.
According to Duarte and Vencovsky (1999), stability is evaluated by genotypes with PCA values close to zero. In this study, the genotypes BRS Poti Branca (G3), Irará (G12), and BRS Tapioqueira (G7) presented this characteristic and the most productive were Irará (33.40 ton ha-1) and BRS Tapioqueira (32.17 ton ha-1).
Becker (1981) explains that stability in the biological context refers to a stable genotype that has minimal variance under different environmental conditions, while stability in the agronomic context refers to stable genotype that exhibits minimal interaction with environments and generates predictable yields to the level of the environmental yield. The genotypes described in the current study fit the agronomic stability concept. As such, they should be characterized by a desirable performance, or desirable agronomic characteristics, such as greater height, resistance to damping off, resistance to disease, and high yield (Carbonell et al. 2004, Morais et al. 2008). Selection by stable and yielding varieties is an indirect way to identify such characteristics.
Based on the AMMI analysis, varieties Poti Branca, BRS Tapioqueira, and Irará have the highest stability indicated by values near the origin of the PCA1 axis, which is indicative of a smaller contribution to the GxE interaction (Figure 1). In contrast, varieties Preta do Araripe (G1), Caravela do Olho Roxo (G6) Platina (G7) and Cria Menino (8), as well as the Clone 1998-1-006 (G2) (Table 2, Figure 1) were the least stable, despite being characterized as high root yields. These genotypes also show high adaptability, which, according to the concept of Allard and Bradshaw (1964) about individual homeostasis, is the potential ability of genotypes to advantageously assimilate environmental stimulus.
The greatest environmental contribution to the GxE interaction was observed in Limoeiro de Anadia (E1) and Lagoa
Figure 1. AMMI1 biplot for additive effects PCA1 component in
24 varieties of cassava root yield from three environments in
the state of Alagos, Brazil. RY = Root yield (ton ha-1), GI = Ideal
genotype, EI = Ideal environment, G1 = Preta do Araripe, G2 =
Clone 1998-1-006, G3 = BRS Poti Branca, G4 = Clone 1997-83-13, G5 = BRS Aramaris, G6 = Caravela, G7 = Platina, G8 = Cria Menino, G9 = BRS Verdinha, G10 = Clone 1997-71-2, G11 = Cigana, G12 = Irará, G13 = Mani Branca, G14 = Clone 1997-71-2, G15 = Caravela do olho roxo; G16 = Campinas, G17 = Jalé, G18 = Palmeira, G19
= Valença, G20 = Sergipe, G21 = Clone 1986-86-24, G22 = Bran
da Canoa (E3) environments, which were also characterized by the highest mean yield. Limoeiro de Anadia environment had the highest contribution to the GxE interaction, reflected in a high PCA score (Table 2, Figure 1). The genotypes in this environment had the highest mean predictive yields (37.58 ton ha-1), while genotypes in Arapiraca (E2) had the
lowest mean predictive yields (20.13 ton ha-1). This fact is probably due to factors such as geographical location, soil type,
rainfall distribution, etc., suggesting that the group of genotypes studied, with positive interaction in Arapicara (Figure 1), could be adapted to specific conditions. Arapiraca presented instability associated with low yield, while Limoeiro de Anadia had instability associated with high yield. The predicted values obtained by the AMMI analysis (Table 1) indicate the true performance of genotypes where the noise was discarded and the predictive ability of the model was improved, enabling accurate identification of the interaction, and facilitating the identification of adapted genotypes.
Genotypes and environments in close proximity on the biplot graph have positive associations, which facilitate the identification of zones of similar agronomic performance. For instance, varieties Cria Menino (G8), Platina (G7), Preta do Araripe (G1), Sergipe (G20), Branquinha (G22), BRS Tapioqueira (G23), and Clones 1996-96-24 (G10), 1997-71-2 (G14) and 1997-83-13 (G4) were specifically adapted to Limoeiro de Anadia, which is associated with intermediate and high yields (Figure 1). In conclusion, Limoeiro de Anadia is the most promising environment to grow cassava.
Clones 1998-1-006 (G2) and 1986-86-24 (G21), as well as the varieties Palmeira (G18), Caravela (G6), BRS Aramaris (G5), Campinas (G16), Cigana (G11), BRS Verdinha (G9), Valença (G19), and Caravela do Olho Roxo (G15) were characterized
Table 2. Mean yield predicted by the AMMI1 model for genotype x environment interaction captured by the first principal component
of the interaction, general means, ideal genotype (GI), ideal environment (EI) scores, and quadratic distances between genotype and
environments of the 24 cassava genotypes (Manihot esculenta Crantz) in three environments of the state of Alagoas
Code Genotypes Predicted mean yield General means PCA1 Quadratic distance
E1 E2 E3
G1 Preta do Araripe 50.6 26.0 38.7 38.4 1.3110 2.0686
G2 Clone 1998-1-006 30.5 17.4 34.1 27.3 -0.7988 12.5888
G3 BRS Poti Branca 38.21 20.9 36.1 31.7 -0.0315 7.7327
G4 Clone 1997-83-13 42.9 23.9 38.5 35.1 0.2951 6.0228
G5 BRS Aramaris 32.2 17.0 33.0 27.4 -0.4275 10.0922
G6 Caravela 27.3 19.7 38.4 28.5 -1.8283 20.9543
G7 Platina 53.7 26.9 38.8 39.8 1.7215 1.0562
G8 Cria Menino 57.3 20.4 28.6 35.4 3.5935 0.7128
G9 BRS Verdinha 32.7 18.0 34.2 28.3 -0.5151 10.6565
G10 Clone 1996-96-24 39.8 19.3 33.3 30.8 0.5759 4.7233
G11 Cigana 24.5 12.4 29.4 22.1 -0.9719 13.8471
G12 Irará 39.7 22.5 37.8 33.4 -0.0513 7.8433
G13 Mani Branca 32.3 19.9 36.9 29.7 -0.9373 13.5915
G14 Clone 1997-71-2 40.5 21.2 35.7 32.5 0.3502 5.7555
G15 Caravela do Olho Roxo 34.9 19.5 35.4 29.9 -0.3918 9.8668
G16 Campinas 30.8 17.6 34.3 27.6 -0.7903 12.5290
G17 Jalé 26.6 13.7 30.5 23.6 -0.8362 12.8560
G18 Palmeira 34.0 18.1 33.8 28.6 -0.2864 9.2158
G19 Valença 34.2 21.2 37.9 31.1 -0.8226 12.7583
G20 Sergipe 45.2 22.8 36.2 34.7 0.9164 3.3591
G21 Clone 1986-86-24 38.8 24.7 41.1 34.9 -0.6299 11.4189
G22 Branquinha 42.7 20.1 33.5 32.1 0.9486 3.2423
G23 BRS Tapioqueira 39.0 21.2 36.2 32.1 0.0570 7.2481
G24 Isabel de Souza 32.7 17.7 33.7 28.0 -0.4501 10.2365
E1 Limoeiro de Anadia 37.5 4.2522 6.1122
E2 Arapiraca 20.1 -1.1645 8.6702
E3 Lagoa da Canoa 35.3 -3.0877 23.6948
EI Environment Ideal 42.9 1.7799
by low yields (Table 1, Figure 1). Palmeira (G18), Caravela (G6), BRS Aramaris (G5), Campinas (G16), Cigana (G11), BRS Verdinha (G9), and Valença (G19) were better adapted to Arapiraca environment (E2), which should be considered the most suitable for the development of these genotypes. A recent evaluation of BRS Tapioqueira, Irara, BRS Poti Branca, Mestiça, and Clone 1997-83-13 by the AMMI analysis indicated that these genotypes are highly unstable, but have high mean yield (Costa et al. 2013). However, in contrast to Costa et al (2013), in the present study, the varieties BRS Poti Branca, Irara and BRS Tapioqueira had high mean yields, coupled with high phenotypic stability (Table 2 and Figure 1).
Close proximity (quadratic distance) was observed between varieties Platina (G7) (39.84 ton ha-1) and Cria Menino
(G8)(35.48 ton ha-1) and the ideal genotype (GI) (39.34 ton ha-1) (Figure 1), here conceived as the one that reached the
highest mean yield in each location sampled by the experiments (which has positive interactions with the environments). Poti Branca (G3) and Irará (G12) showed high stability and yield above the overall mean (Figure 1); these genotypes also had high stability, with PCA1 score close to zero. Values close to zero characterize genotypes and environments as stable, with low contribution to the interaction. According to Pacheco et al. (2005), genotypes stability is an indication of adaptation to the tested environments. However, for agricultural purposes, stable genotypes should also have other desirable characteristics, such as high yield.
Table 2 presents the quadratic distances between the projections of each genotype evaluated and the ideal genotype on the first principal components axes. In this study, the genotypes Platina and Cria Menino were closer to the ideal genotype than Preta do Araripe, and are therefore the genotypes that show the most positive interactions with environments in the experimental conditions. Conversely, BRS Poti Branca, Irara and BRS Tapioqueira have high mean yield, high phenotypic stability, but showed high quadratic distance to the ideal genotype (GI). Barros et al. (2013), in their study with cowpeas (Vigna unguiculata), also used the ideal genotype and environment in the AMMI analysis; these authors found that the genotypes most distant from the GI had high dissimilarity, and consequently low phenotypic stability (unstable) and adaptability to the tested environments. The most distant genotypes from the ideal genotypes in the present study were Caravela (G6), Cigana (G11), and Mani Branca (G13), indicating low stability and adaptability to the environments tested (Table 2 and Figure 1).
According to Pacheco et al. (2005), the most favorable agronomical environment presents the lowest quadratic distance estimates between real distance of the environments with the ideal environment (EI) created by the methodology (Table 2, Figure 1). Arapiraca (E2) and Lagoa da Canoa (E3) have higher quadratic distance from EI, indicating poorer conditions for cassava cultivation. Unfavorable environments are characterized by the occurrence of uncontrollable environmental factors, such as low distribution of rainfall, which leads to drought, insect attack, and diseases with difficult control, etc. Such conditions limit the capacity of genotypes to express their yield potential. Nevertheless, varieties Cigana (G11) and Campinas (G16) had specific adaptations to Arapiraca (E2) (Figure 1). Lagoa da Canoa (E3) was the most unfavorable environment for the evaluation of the adaptability and phenotypic stability of cassava varieties, as indicated by the highest quadratic distance from EI (Table 2).
The graphical interpretation of the AMMI analysis has the capacity to identify different varieties of cassava with high and stable yield. Varieties BRS Poti Branca, Irará, and BRS Tapioqueira show high yield and phenotypic stability. Varieties Cria Menino, Platina, Preta do Araripe, Sergipe, Branquinha, BRS Tapioqueira, and Clones 1996-96-24, 1997-71-2, 1997-83-13 are adapted to Limoeiro de Anadia environment; Varieties Campinas and Cigana are adapted to Arapiraca environment. Among the three test environments, Limoeiro de Anadia was the best for the identification of high yield, phenotypically stable genotypes for cassava breeding programs. Varieties Cria Menino and Preta do Araripe have genes for adaptability and stability, and thus are considered as ideal genotypes.
ACKNOWLEDGEMENTS
To ‘Embrapa Mandioca e Fruticultura’ for the supply of genetic material, and to the Fundação de Apoio a Pesquisa do Estado de Alagoas (FAPEAL) for the financial support of research in cassava.
REFERENCES
Allard RW and Bradshaw AD (1964) Implications of genotype-environmental interactions in applied plant breeding. Crop Science
4: 503-508.
semiprostrado. Pesquisa Agropecuária Brasileira 48: 403-410.
Carbonell SAM, Azevedo Filho JA, Dias LA, Garcia AAF and Morais LK (2004) Common bean cultivars and lines interaction with environments.
Scientia Agricola 61: 169-177.
Cornelius PL, Seyedsadr M and Crossa J (1992) Using the shifted multiplicative model to search for “separability” in crop cultivar trials.
Theoretical and Applied Genetics 84: 161-172.
Costa EFN, Carvalho HWL, Santos VS, Rangel MAS, Pinho JLN, Alves MCS, Silva ADA, Gomes MCM, Menezes WMM and Santos DL (2013) Adaptabilidade e estabilidade de cultivares de mandioca via regressão bissegmentada e multivariada. Boletim de Pesquisa da Embrapa Tabuleiros Costeiros 78: 1-20.
Cruz CD (2013) GENES – a software package for analysis in experimental statistics and quantitative genetics. Acta Scientiarum Agronomy 35: 271-276.
Duarte JB and Vencovsky R (1999) Interação genótipos x ambientes: uma introdução à análise ‘‘AMMI’’. SBG, Ribeirão Preto, 32p. (Série Monografias, 9).
Eberhart SA and Russel WA (1966) Stability parameters for comparing varieties. Crop Science 6: 36-40.
FAO (2016) Census from yield, production and harvest of cassava from world. Available at <http://www.fao.org/economic/ess/esc-fs/en>.
Accessed in Feb, 2016.
Ferreira Filho JR, Silveira HF, Macedo JJG, Lima MB and Cardoso CEL (2013)
Cultivo, processamento e uso da mandioca. Embrapa Mandioca e Fruticultura, Brasília, 34p.
Gauch HG and Zobel RW (1996) Ammi analysis of yield trials. In Kang MS and Gauch HG (eds) Genotype by environment interaction. CRC Press, Boca Raton, 85-122.
Gonçalves JGR, Chiorato AF, Morais LK, Perina EF, Farias FL and Carbonell SAM (2010) Estudo da estabilidade fenotípica de feijoeiro com grãos especiais. Ciência e Agrotecnologia 34: 922-931.
Gonçalves JGR, Chiorato AF, Perina EF and Carbonell SAM (2009) Estabilidade fenotípica em feijoeiro estimada por análise AMMI com genótipo suplementar. Bragantia 68: 863-871.
IBGE (2016) Banco de Dados Agregados do Sistema IBGE de Recuperação Automática - SIDRA. Available at <http://www.sidra.ibge.gov.br/>. Accessed in Aug, 2016.
Kvitschal MV, Vidigal Filho PS, Scapim CA, Gonçalves-Vidigal MC, Pequeno MG, Sagrilo ED and Rimoldi F (2007) Evaluation of phenotypic stability of cassava clones by AMMI analysis in northwestern Paraná state.
Crop Breeding and Applied Biotechnology 6: 236-241.
Kvitschal MV, Vidigal Filho PS, Scapim CA, Gonçalves-Vidigal MC, Sagrilo E, Pequeno MG and Rimoldi F (2009) Comparison of methods for phenotypic stability analysis of cassava (Manihot esculenta Crantz) genotypes for yield and storage root dry matter content. Brazilian Archives of Biology and Technology 52: 163-175.
Lin CS and Binns MR (1988) A superiority measure of cultivar performance for cultivar x location data. Canadian Journal of Plant Science 68:
193-198.
Mattos PHC, Oliveira RA, Bespalhok Filho JC, Daros E and Veríssimo MAA (2013) Evaluation of sugarcane genotypes and production environments in Paraná by GGE biplot and AMMI analysis. Crop Breeding and Applied Biotechnology 13: 83-90.
Morais LK, Moura MF, Vencovsky RV and Pinheiro JB (2008) Adaptabilidade e estabilidade fenotípica em soja avaliada pelo método de Toler.
Bragantia 67: 275-284.
Nick C, Carvalho M, Assis LHB and Carvalho SP (2008) Genetic dissimilarity in cassava clones determined by multivariate techniques Crop Breeding and Applied Biotechnology 8: 104-110.
Ojulong HF, Labuschagne MT, Herselman L and Fregene M (2010) Yield traits as selection indices in seedling populations of cassava Crop Breeding and Applied Biotechnology 10: 191-196.
Oliveira RL, Pinho RGV, Balestre M and Ferreira DV (2010) Evaluation of maize hybrids and environmental stratification by the methods AMMI and GGE biplot. Crop Breeding and Applied Biotechnology 10: 247-253.
Oliveira EJ, Freitas JPX and Jesus ON (2014) AMMI analysis of the adaptability and yield stability of yellow passion fruit varieties.
Scientia Agricola 71: 139-145.
Pacheco RM, Duarte JB, Vencovsky R, Pinheiro JB and Oliveira AB (2005) Use of supplementary genotypes in AMMI analysis. Theoretical and Applied Genetics 110: 812-818.
Ramalho MAP, Ferreira DFF and Oliveira AC (2005) Experimentação em genética e melhoramento de plantas. Editora UFLA, Lavras, 322p. Rimoldi F, Vidigal Filho PS, Scapim CA and Vidigal MCG (2003) Avaliação
de cultivares de mandioca nos municípios de Maringá e Rolândia no Estado do Paraná. Acta Scientiarum: Agronomy 25: 459-465.
Sagrilo E, Vidigal Filho PS, Pequeno MG, Gonçalves-Vidigal MC and Kvitschal MV (2008) Dry matter production and distribution in three cassava (Manihot esculenta Crantz) cultivars during the second vegetative plant cycle. Brazilian Archives Biology and Technology 51: 1079-1087.
Sampaio Y, Costa EF, Sampaio LMB and Santiago AD (2003) Eficiência econômica da cadeia produtiva da mandioca em Alagoas. SEBRAE AL, Maceió, 84p.
Santiago AD, Morais LK and Cavalcante MHB (2015) Recomendação de diferentes épocas de colheita de mandioca tipo indústria em Alagoas.
Comunicado Técnico da Embrapa Tabuleiros Costeiros 164: 1-6. Toler JE and Burrows PM (1998) Genotypic performance over
environmental arrays: a non-linear grouping protocol. Journal of Applied Statistics 25: 131-143.