Article
Printed in Brazil - ©2015 Sociedade Brasileira de Química0103 - 5053 $6.00+0.00A
*e-mail: [email protected]
Development and Validation of a Dissolution Test Method for Albendazole and
Praziquantel in Their Combined Dosage Form
Silvana E. Vignaduzzo,a,b María A. Opertoa and Patricia M. Castellano*,a,b
aÁrea Análisis de Medicamentos, Facultad de Ciencias Bioquímicas y Farmacéuticas,
Universidad Nacional de Rosario, S2002LRK Rosario, Argentina
bInstituto de Química Rosario (IQUIR-CONICET), S2002LRK Rosario, Argentina
A dissolution test method and an analytical procedure by HPLC were developed and validated for the evaluation of the dissolution of tablets containing albendazole and praziquantel. Two different commercially tablets containing 500 mg of albendazole and 50 mg of praziquantel for veterinary use were selected for this study. A dissolution medium containing a mixture of 300 mL ethanol and 600 mL of 0.1 mol L-1 HCl was found suitable to ensure sink conditions. USP Apparatus 2, 900 mL dissolution medium and 75 rpm were fixed. Dissolution profiles were generated at 45 min. Dissolution samples were analyzed with a reversed-phase high-performance liquid chromatography (RP-HPLC) method with ultraviolet (UV) detection at 210 nm, developed and validated for this purpose. Each product was also assayed for analyte content according to USP 35. The dissolution test described here could be proposed as a means of assessing finished product quality.
Keywords: dissolution test, albendazole, praziquantel, tablets, HPLC
Introduction
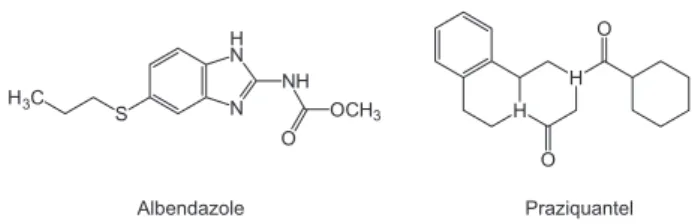
Albendazole (ALB) is methyl[5-(propylthio)-l-H-benzimidazol-2yl]carbamate (Figure 1). It is found to inhibit the polymerization of the parasite tubulin into microtubules. There is a higher affinity of ALB for the parasite tubulin and so, the activity is mainly influenced by the parasite rather than by the host. The loss of the cytoplasmic microtubules leads to impaired uptake of glucose by the larval and adult stages of the parasites. The worm is then unable to maintain energy production, which leads to its immobilization and eventual death.1
Praziquantel (PRA) [2-(cyclohexylcarbonyl)-1,2,3,6,7,11b-hexahydro-4hpyrazino(2,1a) isoquinoline-4-one] (Figure 1) is a pyrazinoisoquinolone derivative which has been shown to be highly effective against a broad spectrum of cestode and trematoda parasites in humans and animals.2 The detailed molecular mechanism of action
of PRA has not been elucidated yet, but it rapidly causes tegumental damage and paralytic muscular contraction of parasites. This may be due to an action on parasite glutathione S-transferase and intracellular calcium level.3
In addition, adequate analytical procedures should be applied to the determination of the amount of ALB and PRA dissolved during dissolution testing. The method should be sufficiently sensitive, selective, robust and rapid in order to analyze the large number of samples generated from dissolution experiments. ALB-PRA association does not appear in any Pharmacopoeia and they have been individually determined in several matrices. ALB has been determined in milk by high-performance liquid chromatography (HPLC)4-6 in swine tissues and
aquaculture fish samples by ultra- high performance liquid chromatography (UHPLC) coupled with mass spectrometry (MS) methods.7,8 On the other hand, PRA
has been determined by liquid chromatography coupled with MS (LC/MS),9,10 LC,11 HPLC,12 cathodic adsorptive
stripping differential-pulse voltammetry,13 UHPLC-MS14
methods in milk and human plasma.
N H N
NH OCH3 O S
H3C
H H
O O
Albendazole Praziquantel
ALB and PRA were determinated by second derivative spectrophotometry and multivariated calibration methods in veterinary pharmaceutical formulations15 but this technique
could not be applied to the dissolution test. Two HPLC methods were reported for the determination of ALB and PRA. One method16 determines both analytes in plasma.
The second one17 determines both analytes in bulk and
synthetic mixtures, but does not provide information about the development and optimization of the method, and is not specific and sensitive enough for this purpose.
In this study, a dissolution test and a simple HPLC method were developed and validated to evaluate the dissolution performance of tablets containing ALB and PRA for veterinary use.
Experimental
Chemicals and reagents
Experiments were performed with pharmaceutical grade ALB and PRA (Saporiti, Buenos Aires, Argentina) and analytical grade reagents (Merck, Darmstadt, Germany). Three lots of tablets, corresponding to three different commercial brands (Brand 1, Brand 2 and Brand 3) were obtained from the local veterinary market. The pharmaceutical preparations were declared to contain 500 mg ALB, 50 mg PRA and excipients. The average weights were 715, 900 and 665 mg/tablet for Brand 1, Brand 2 and Brand 3, respectively. Capsules containing 500 mg of ALB and 50 mg of PRA were prepared in our laboratory in order to develop a dissolution test as reference formulation. HPLC-grade solvents (J. T. Baker, Mexico) and double-distilled water were employed for analyses. The mobile phase was filtered through 0.2 µm nylon filters before use.
Equipment
Dissolution testing
Dissolution testing was performed using a Hanson SR8-Plus dissolution Test Station, operated as USP Apparatus 2 (paddle) at 75 rpm and 37.0 ± 0.5 °C. Conditions were 300 mL of ethanol and 600 mL of 0.1 mol L-1 HCl, as
dissolution medium. Six tablets were processed in each dissolution experiment. Sample aliquots were collected at 5, 10, 20, 30 and 45 min and analyzed by the HPLC procedure for dissolution samples described above.
Analysis of dissolution samples
Chromatographic separations were performed with an Agilent Technologies 1200 Series chromatograph (Santa Clara, U.S.A.) equipped with four pumps, an automatic
injector fitted with a 20 µL loop and a diode array detector. Analysis of aqueous solutions of ALB and PRA were performed on a Luna C18 column (250 × 4.6 mm i.d., 5 µm particule size) provided by Phenomenex, thermostatized at 30 °C with a mobile phase containing 50% acetonitrile (ACN) and 50% phosphate buffer solution (30 mmol L-1,
pH 2.9), pumped at a flow rate of 1.3 mL min-1 with UV
detection at 210 nm.
Spectrophotometer
The UV spectra were obtained with a Shimadzu 1601PC double beam UV-Vis spectrophotometer (Kyoto, Japan) employing 10 mm matched quartz cells.
Hardness, friability and disintegration time
Hardness testing was determined with a model DU V, AVIC. Friability was determined using a Friabilator F II, AVIC. Disintegration time was determined with a Disintegration DE-II, AVIC. The USP 3518 conditions
were used.
Software
Experimental designs were carried out using Design Expert v.7 (Stat-Ease, Inc., Minneapolis, U.S.A.) and statistical analyses were performed using SPSS v.9 (SPSS, Inc., Chicago, U.S.A.).
Standard solutions
The stock standard solution of ALB (0.226 mg mL–1)
was prepared by accurately transferring weighed amounts of the drug to a 10 mL volumetric flask and completing to the mark with the diluent (methanol (MeOH), 1% v/v in H2SO4), then, by transferring 2 mL to a 100 mL volumetric
flask and completing to volume with the same diluent. The stock standard solution of PRA (0.02216 mg mL-1) was
prepared by dissolving an accurately weighed amount of the drug with MeOH in a 25 mL volumetric flask, then, by transferring 1 mL to 100 mL volumetric flask and completing to volume with MeOH. The solutions were stored at 4 ºC and left to attain room temperature before use.
Validation samples
Linearity of the method was evaluated at nine different concentration levels by diluting the standard solutions with methanol to obtain solutions over the range 10-130% for ALB (6.78-101.7 mg L-1) and PRA (0.665-9.972 mg L-1).
were derived by calculating the signal-to-noise ratio (S/N, i.e., 3.3 for LOD and 10 for LOQ) using the following equations designated by the International Conference on Harmonization (ICH):19
LOD = 3.3 × σ/S (1)
LOQ=10 × σ/S (2)
where, σ is the standard deviation of the response and S is
the slope of the calibration curve.
For recovery studies, known amounts of the analytes were added to samples of tablets pre-analyzed with the proposed method, containing the analytes at the 70% level in order to obtain samples fortified with corresponding concentration of 80, 90 and 100% of the label.
In order to verify the repeatability and the robustness of the method, a solution containing a mixture of standards of both analytes at a level of 100% was prepared.
For intermediate precision, three samples of mixed standard solutions were prepared by three different analysts at 100% level were employed.
The specificity was determined by the peak purity indices of the analytes in sample solutions employing a photodiode-array (PDA) detector under the optimized chromatographic conditions.
Preparation of pharmaceutical samples
For the dissolution testing
Under the optimized conditions, a single tablet was added to each of the six vessels of the dissolution test-station just before starting the test. At the pre-established times (5, 10, 15, 20, 30 and 45 min for dissolution profiles and after 45 min for dissolution testing), 10 mL of the samples were withdrawn from the vessels (without solvent replacement) and filtered through 0.2 µm nylon membrane filters, discarding the initial portions. The samples were diluted with 0.1 mol L-1 HCl in 10 mL flasks and filtered before
chromatography analysis.
For the analysis of tablets
For each brand, twenty tablets were weighed, crushed and mixed in a mortar. A portion of the powder, equivalent to 20 mg of ALB and 2 mg of PRA, was transferred to a 25 mL volumetric flask and 2.5 mL of the diluentand 10 mL of MeOH were added. The flask was mechanically shaken for 15 min, to ensure complete extraction of the drugs and completed to the mark with MeOH. An aliquot (10 mL) was taken, centrifuged for 10 min at 3000 rpm and 1.0 mL of the supernatant was transferred to a 10 mL volumetric
flask, completed to the mark with MeOH and filtered before chromatography analysis. The procedure was performed in triplicate for each brand.
Results and Discussion
Analysis of dissolution samples
Optimization of detection wavelength
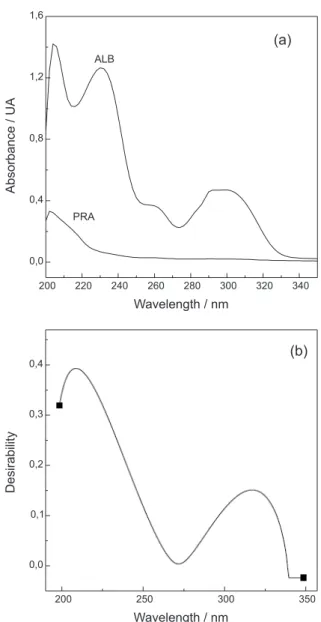
Figure 2a shows the UV spectra of ALB and PRA dissolved in mobile phase, between 200 and 350 nm, keeping the relationship found in pharmaceutical formulations. It can be observed that PRA exhibits poor absorbance at wavelength below 220 nm while ALB shows three absorption peaks at 204, 230 and 300 nm, respectively. The most suitable detection wavelength was rationally selected employing a multi-objective optimization strategy, which consisted in building and evaluating a desirability function upon the UV-Vis spectral data of the analytes. The overall desirability D, a value between 0 and 1, is defined by combining the individual desirability values. Then, the optimal setting is determined by maximizing D.20
The desirability function was built with the goals of maximizing the absorbance of PRA, while simultaneously minimizing the absorption of ALB, the most abundant analyte. Under these conditions, the optimum detection wavelength was 210 nm (D = 0.40, Figure 2b).
Optimization of separation
In the screening phase, a Plackett-Burman design was applied considering pharmacopoeial conditions for each analyte.18 The following factors were studied: organic
phase (MeOH-ACN) and aqueous phase (water-buffer phosphate). The best results were obtained using a mixture of ACN- sodium phosphate buffer, which was employed as a starting point for further optimization.
Temperature had no significant effect on the separation and the use of a 30 mmol L-1 buffer improved peak shapes.
Therefore, column temperature was fixed at 30.0 ± 0.2 °C and the buffer concentration was established at 30 mmol L-1.
A response surface methodology (RSM) was used to achieve the optimum conditions for analysis during method development. A Box-Behnken experimental design was applied to optimize HPLC responses such as the resolution and retention time of both analytes. The factors considered were pH sodium phosphate buffer (2.5-4.5), organic phase (50-70%) and flow rate (0.70-1.30 mL min-1).
of sodium phosphate buffer (30 mmol L-1, pH 2.9) and ACN,
pumped at 1.3 mL min-1 and thermostated at 30 ± 0.2 °C.
The analytes were detected at 210 nm.
Typical chromatogram of the mixed standard solution is shown in Figure 4a.
Robustness
Method parameters, such as buffer pH, amount of ACN in the mobile phase and flow rate, were modified in order to evaluate the potential impact on the performance of the analytical development method. The influence of these variables on the method was studied through intentional small variations in buffer pH (2.8-3.0), amount of ACN in the mobile phase (47-53%) and flow rate (1.25-1.35 mL min-1), following a 33 factorial design.
Under each condition, the samples were analyzed, recoveries of each analytes were recorded and the effects of the changes were statistically evaluated by means of the analysis of variance test (ANOVA). An increase in the flow rate resulted in a decrease in the recoveries, while the percentage of organic modifier and pH had no important effect on the response. In conclusion, by examining the ANOVA results, it can be confirmed that recoveries are not robust for the flow rate; thus, a precautionary statement should be included in the analytical procedure for this factor.
Method validation
The validation of the optimized method was performed in agreement with ICH guidelines19 with respect to specificity,
accuracy, precision (repeatability and intermediate precision), linearity and range (Table 1).
Dissolution testing development and dissolution profile construction
The tablets of ALB and PRA are official in the relevant pharmacopoeias,18 but their association is not. Furthermore,
200 220 240 260 280 300 320 340 0,0
0,4 0,8 1,2 1,6
A
b
s
o
rb
a
n
c
e
/
U
A
Wavelength / nm
ALB
PRA
(a)
200 250 300 350 0,0
0,1 0,2 0,3 0,4
D
e
s
ir
a
b
ili
ty
Wavelength / nm
(b)
Figure 2. UV-Vis spectra of ALB and PRA dissolved in mobile phase
(a); desirability plot for the optimization of the detection wavelength (b).
there is no literature evidencing dissolution test for both analytes. With the aim of developing the dissolution test, combinations of individual pharmacopoeial conditions,18
such as 0.1 mol L-1 HCl and sodium lauryl sulfate in
0.1 mol L-1 HCl were tested with unsatisfactory results.
Approaches usually used in the design of dissolution media for poorly soluble drugs include: (i) induction of
drug solubility by increasing the volume of the aqueous sink or removing the dissolved drug; (ii) solubilization of the drug by co-solvents up to 40% and by anionic or non-ionic surfactants added to the dissolution medium in postmicellar concentrations; (iii) alteration of pH to enhance the solubility of ionizable drug molecules. The last two approaches seem less cumbersome and have been more widely employed in pharmaceutical dissolution tests.21
Therefore, based on the literature for poorly soluble drugs,22 mixtures containing sodium lauryl sulfate in
0.1 mol L-1 HCl acetic acid and ethanol23,24 were assayed.
As it was observed that the addition of acetic acid had not influenced the dissolution of the analytes, a 32 factorial
design was used to optimize conditions for dissolution. The factors to be considered were: sodium lauryl sulfate (1.0 and 2.0 mg mL-1 dissolved in HCl 0.1 mol L-1) and ethanol
(0, 150 and 300 mL) with a replica of the central point. Official guidelines recommend the use of apparatus 2 USP and 75 rpm in case of associations. In addition, taking into account the problems of solubility of both analytes, 900 mL of dissolution medium were employed. The bath temperature was set at 37.0 ± 0.5 °C. The dissolution samples were analyzed using the HPLC development method. Then, when applying an ANOVA test, it was found that the presence of sodium lauryl sulfate had not affected the dissolution of analytes while the increase of ethanol had significantly favored it. The optimum conditions of the dissolution test were: 900 mL dissolution medium comprised by a mixture of 300 mL of ethanol and 600 mL of 0.1 mol L-1 HCl, USP apparatus 2, 75 rpm in a bath
preheated to 37.0 ± 0.5 °C (Figure 5).
The term sink conditions is defined as the volume of medium at least greater than three times of that required to form a saturated solution of a drug substance. The sink conditions were determined and a percentage of drugs released were satisfactory.
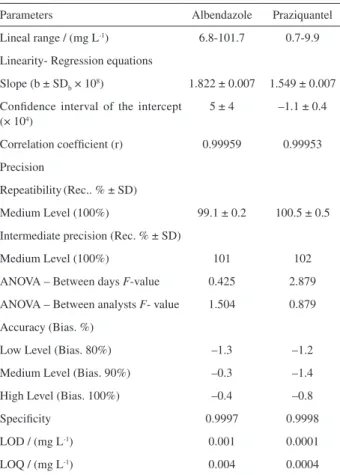
Table 1. Summary of method validation results
Parameters Albendazole Praziquantel
Lineal range / (mg L-1) 6.8-101.7 0.7-9.9
Linearity- Regression equations
Slope (b ± SDb × 108) 1.822 ± 0.007 1.549 ± 0.007
Confidence interval of the intercept (× 104)
5 ± 4 –1.1 ± 0.4
Correlation coefficient (r) 0.99959 0.99953
Precision
Repeatibility(Rec.. % ± SD)
Medium Level (100%) 99.1 ± 0.2 100.5 ± 0.5
Intermediate precision (Rec. % ± SD)
Medium Level (100%) 101 102
ANOVA – Between days F-value 0.425 2.879
ANOVA – Between analysts F- value 1.504 0.879
Accuracy (Bias. %)
Low Level (Bias. 80%) –1.3 –1.2
Medium Level (Bias. 90%) –0.3 –1.4
High Level (Bias. 100%) –0.4 –0.8
Specificity 0.9997 0.9998
LOD / (mg L-1) 0.001 0.0001
LOQ / (mg L-1) 0.004 0.0004
FC between days (0.95,1,35) = 4.451; FC between analysts (0.95,2,17) = 3.592.
0 1 2 3 4 5 6
0 200 400 600 800 1000 1200
A
b
s
o
rb
a
n
c
e
/
m
A
U
time / min
a b
c
ALB
PRA
Figure 4. Typical chromatograms of the separation of ALB and PRA.
Solution samples: mixture of standards at 100% level for each analyte in (a); dissolution sample in (b) and tablet containing ALB and PRA in (c).
Figure 5. Response surface plots corresponding to the desirability function
The optimized conditions were used by building the dissolution profiles of the tablets and capsules used as a reference for both analytes (Figure 6). From the curves obtained, it can be seen that none of the trademarks reached the desired value of 80%.
Assay
Furthermore, the validated HPLC method was applied to the simultaneous determination of the analytes in samples corresponding to three commercial veterinary brands (brand 1, brand 2 and brand 3). Analyses were carried out in triplicate and results (mean and RSD) are shown in Table 2. Typical chromatograph is shown in Figure 4c.
The observed concentrations of ALB and PRA were within the range of 90-110% of their corresponding labeled contents and with RSD values of less than 2% complying with usually accepted specifications.18
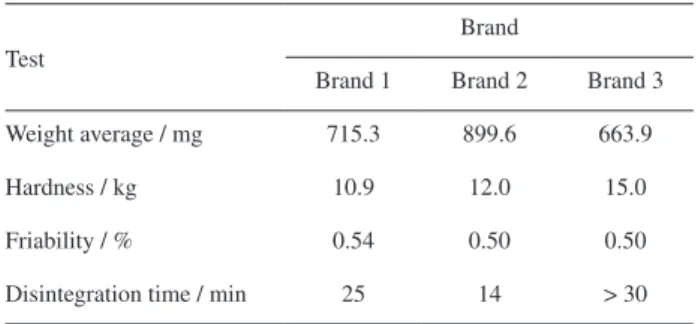
Hardness, friability and disintegration time
Other quality parameters of tablets, such as hardness, friability and disintegration time, were determined. Table 3 shows the results which are consistent with the results obtained by the dissolution profiles.
Conclusions
A novel dissolution test and HPLC methods were developed and validated to evaluate performance of ALB and PRA association for veterinary use. The HPLC method was optimized by a smart approach using experimental design methodology. Moreover, the HPLC method was used to quantify both analytes for the quality control of tablets of three brands of veterinary tablets.
Complete dissolution of capsules could be achieved at 45 min using USP Apparatus 2 at 75 rpm in 900 mL of dissolution medium containing a mixture of 600 mL of 0.1 mol L-1 HCl and 300 mL of ethanol. A
reversed-phase HPLC method was shown to be accurate, precise, linear, and specific for the determination of both analytes in dissolution samples.
The differences between the dissolution profiles of the three brands evaluated with respect to the reference, is related to the pharmacotechnical properties of the tablets and not to the low solubility of the active pharmaceutical ingredients. The new dissolution test can be proposed to assess the performance of commercially available products, or in the process of development of new tablet formulations containing ALB and PRA.
Other tablet quality parameters such as friability, hardness and disintegration time were assessed and the results obtained were consistent with the results obtained in dissolution profile.
Acknowledgments
The authors acknowledge Consejo Nacional de Investigaciones Científicas y Técnicas (CONICET) and Secretaría de Ciencia y técnica (SECyT-UNR) for financial support.
References
1. Dayan, A. D.; Acta Trop. 2003, 86, 141.
Table 3. Quality parameters of three commercial brands of ALB and
PRA tablets
Test
Brand
Brand 1 Brand 2 Brand 3
Weight average / mg 715.3 899.6 663.9
Hardness / kg 10.9 12.0 15.0
Friability / % 0.54 0.50 0.50
Disintegration time / min 25 14 > 30
Table 2. Assay of commercial veterinary tablets
Samples Analytes
ALB / % ± RSD PRA / % ± RSD
Brand 1 103 ± 2 92 ± 2
Brand 2 104 ± 2 94 ± 2
Brand 3 96.0 ± 0.9 108 ± 2
0 10 20 30 40 50 0
20 40 60 80 100
time / min
(a)
0 10 20 30 40 50 0
20 40 60 80 100
time / min
Amount of drug dissolved /
%
Amount of drug dissolved / %
(b)
Figure 6. Dissolution profiles of three comercial brands and standards.
Albendazole in (a) and Praziquantel in (b). Legend: ¢ Reference;
2. Cioli, D.; Picamattocia, L.; Parasitol. 2003, Res. 90 (Suppl. 1), S3.
3. Dollery, C. In: Therapeutic Drugs, Churchill Livingstone: Edinburgh, 1998, vol. 2.
4. Kinsella, B.; Lehotay, S. J.; Mastovska, K.; Lightfield, A. R.; Furey, A.; Danaher, M.; Anal. Chim. Acta. 2009, 637, 196. 5. De Ruyck, H.; Van Reterghem, R.; De Ridder, H.; De Brabander,
D.; Food Control2000,11, 165.
6. Jedziniak, P.; Szprengier-Juszkiewicz, T.; Olejnik, M.;
J.Chromatogr. A 2009,1216, 8165.
7. Xia, X.; Wang, Y.; Wang, X.; Lid, Y.; Zhong, F.; Li, X.; Huang, Y.; Ding, S.; Shen, J.; J. Chromatogr. A2013,1292, 96. 8. Lopes, R. P.; Reyes, R. C.; Romero-González, R.; Vidala,
J. L. M.; Frenich, A. G.; J. Chromatogr. B2012, 895, 39. 9. He, G.; Qi, H.; Wang, M.; Yang, J.; Wen, F.; Wang, W.; Qiao,C.;
Zhang, H.; J. Pharm. Biomed. Anal.2013, 83, 186.
10. Lima, R. M.; Ferreira, M. A. D.; Ponte, T. M.; Marques, M. P.; Takayanagui, O. M.; Garcia, H. H.; Coelho, E. B.; Bonato, P. S.; Lanchote, V. L.; J.Chromatogr. B2009, 877, 3083.
11. Hashem, H.; Ibrahim, A. E.; Elhenawee, M.; Arab. J. Chem.,
in press, DOI: 10.1016/j.arabjc.2012.07.005.
12. Wang, Y.; Zhou, Y.; Ma, C.; Yang, B.; Feng, R.; Zhang, Y.; Fu,J; Chen, W.; Sun, Y.; Ma, J.; Zhang, Q.; Deng, Y.; Zhang, Y.; He,W.; Acta Pharm. Sin. B2012,2, 527.
13. Ghoneim, M. M.; Mabrouk, M. M.; Tawfik, A.; J. Pharm. Biomed. Anal. 2002, 30, 1311.
14. Zhan, J.; Yu, X. J.; Zhong, Y. Y.; Zhang, Z. T.; Cui, X. M.; Peng, J. F.; Feng, R.; Liu, X. T.; Zhu, Y.; J. Chromatogr. B2012, 906, 48.
15. Soto, C.; Contreras, D.; Orellana, S.; Yañez, J.; Toral, M. I.;
Anal. Sci. 2010, 26, 891.
16. Bonato, P. S.; Oliveira, A. R. M.; Santana, F. J. M.; Fernandes, B. J. D.; Lanchote, V. L.; Gonzalez, A. E.; Garcia, H. H.; Takayanagui, O. M.; J. Pharm. Biomed. Anal.2007, 44, 558. 17. Shah, S. R.; Dey, S.; Pradhan, P.; Jain, H. K.; Upadhyay, U. M.;
J. Taibah Univ. Sci.2014, 8, 54.
18. The United States Pharmacopeia, USP 35, The United States Pharmacopeial Convention: Rockville, 2012.
19. International Conference on Harmonization of Technical Requirements for the Registration of Pharmaceuticals for Human Use (ICH); Guideline Q2 (R1)-Validation of Analytical Procedures: Text and Methodology; ICH: Geneva, 2005. 20. Jeong, I. J.; Kim, K. J.; Eur. J. Oper. Res. 2009, 195, 412. 21. The United States Food and Drug Administration (FDA);
Guidance for Industry: Immediate Release Solid Dosage Forms: Scale-up and Post Approval Changes (SUPAC-IR). Chemistry, manufacturing and controls. In vitro dissolution testing and in vivo bioequivalencia documentation; FDA: Rockville, 1995. 22. E1-Massik, M. A.; Darwish, I. A.; Hassan, E. E.; E1-Khordagui,
L. K.; Int. J. Pharm. 1996, 140, 69.
23. Kawakami, K.; Adv. Drug Delivery Rev. 2012, 64, 480. 24. Souza, M. C.; Marchetti, J. M.; Adv. Powder Technol. 2012, 23,
801.