Correlation analysis of hearing thresholds, validated questionnaires
and psychoacoustic measurements in tinnitus patients
Abstract
Ricardo Rodrigues Figueiredo 1, Marcelo A. Rates 2, Andréia Aparecida de Azevedo 3, Patrícia Mello de
Oliveira 4, Patrícia B. A. de Navarro 5
1 Msc in General Surgery-Otorhinolaryngology - Federal University of Rio de Janeiro, Full Professor of Otorhinolaryngology - Medical School of Valença, RJ. TeTechnical Diretor -
OTOSUL, ENT Sul-Fluminense, Volta Redonda, RJ.
2 ENT, Assistant Professor of Otorhinolaryngology - Federal University of Minas Gerais, Belo Horizonte, MG. ENT physician - Centro de Tratamento e Pesquisa em Zumbido, Belo
Horizonte, MG.
3 ENT Physician, Head of the OTOSUL Scieniic work - ENT Sul-Fluminense, Volta Redonda, RJ.
4 Speech and Hearing Therapist - Head of the Audiology Department - OTOSUL, ENT Sul-Fluminense, Volta Redonda, RJ. 5 Speech and Hearing Therapist - Tinnitus Research and Trainning Center - Belo Horizonte, MG.
OTOSUL, Otorrinolaringologia Sul-Fluminense, Volta Redonda, RJ Centro de Diagnósico e Pesquisa em Zumbido, Belo Horizonte, MG.
Send correspondence to: Rua 40 nº 20 salas 216 a 218 Vila Santa Cecília Volta Redonda RJ 27255-650.
Paper submited to the BJORL-SGP (Publishing Management System – Brazilian Journal of Otorhinolaryngology) on September 23, 2009; and accepted on December 12, 2009. cod. 6658
O
ne of the most criticized points in tinnitus clinical studies arise from the lack of consensus about measurement methods.Aim: To evaluate the correlation between audiometric thresholds, pitch matching (PM), minimum masking level (MML), Tinnitus Handicap Inventory (THI) and the Beck Depression Inventory (BDI) in tinnitus patients.
Study design: Prospective, cross-sectional.
Materials and methods: Subjects were submitted to tonal audiometry, PM and MML for tinnitus.
They also filled out the THI and BDI. Data was statistically compared for correlation purposes between audiometric thresholds, psycho-acoustic measures and questionnaires.
Results: There was no statistically significant correlation between THI and MML, both in patients with BDI scores under and over 14 points. There was no statistically significant correlation between the worst hearing frequency and PM, as well as between the cut-off frequency and the PM in patients with descending hearing curves in their audiograms.
Conclusions: There is no statistically significant correlation between psycho-acoustic measures (PM and MML), audiometric thresholds, THI and BDI. Tinnitus is a very complex symptom and isolated measures by psycho-acoustic methods; tinnitus and depression questionnaires are not satisfactory.
ORIGINAL ARTICLE Braz J Otorhinolaryngol.
2010;76(4):522-6.
BJORL
Keywords: audiometry, psychoacoustics, questionnaires, tinnitus.
INTRODUCTION
Tinnitus can be defined as an auditory sensation which is perceived by the patient, without any external physical source generating the sound. North American data estimates that between 15 and 20% of the population in general have tinnitus and in 20% of these individuals
it has a major impact on their quality of life1. Results
from the different tinnitus treatment strategies are rather inconsistent. Nonetheless, since some patients seem to benefit strongly from specific treatment modes, the current trend is that this symptom has a multifactorial
origin with different subtypes2. One fact which makes the
assessment of tinnitus patient particularly difficult is the lack of uniformity concerning its methods of investiga-tion. Numerous publications have been criticized because of its methodology, especially concerning the tinnitus
measuring and evaluation technique3. Meikle et al., in a
review article from 20084, classified these methods into
4 categories: psychoacoustic tests, scales, questionnaires to assess tinnitus functional effects and questionnaires to analyze the global perceptions of the therapeutic effects.
Psychoacoustic tests have been employed since the 40s4 and the four most used ones are: Pitch Match (PM), Loudness Match (LM), Minimum masking level (MML) and Residual Inhibition, (RI). The questionnaires used to assess the functional effects are made up of numerous items which assess tinnitus impact on numerous aspects of
daily life4. According to some authors, its use guarantees
greater reliability in the assessment of tinnitus when
com-pared to other methods5. Nonetheless, for other authors,
questionnaires for tinnitus assessment are not entirely reliable, since most of them were not developed with the aim of assessing treatment results4. Among the most used questionnaires, we list: Tinnitus Handicap Inventory
(THI)6, Tinnitus Handicap Questionnaire (THQ)7 and
the Tinnitus Questionnaire (Mini-TQ)8. The first two are
commonly used in English speaking countries, and the third is used in Europe. In Brazil, the Brazilian-validated
version of the THI9 is the one most used, as well as the
visual-analogue scale3.
Tinnitus can be a significant problem in the lives
of patients2,3 - bringing about great difficulty in their
ca-pacity to adapt to this new reality. Moreover, tinnitus is, in most of the cases, associated to hearing loss, which causes a significant additional impact. Therefore, it is greatly important to assess and, whenever possible, to measure the importance of the participation of the so-called “psychological aspects “ as worsening factors for the consequences brought about by tinnitus and its eventual impact on treatment results.
We know that depression is a mood disorder cha-racterized by clinical aspects such as fatigue, reduction
in concentration and attention, low esteem and
self-confidence10. Depression can be classified in different
levels: mild, moderate and severe, in function of quantity,
type and intensity of symptoms10. Dysphonia is also a
characteristic of many psychiatric disorders, including anxiety and mood disorders. It is usually characterized as an unpleasant sensation or annoyance such as sadness, anxiety, irritability or agitation. Etymologically it is the
opposite of euphoria10. The Beck Depression Inventory
(BDI)11 is probably the most used self-assessment method
to study depression, both in clinical practice as in
resear-ch12, having been translated and validated in numerous
countries, including Brazil12.
Parallel to that, experimental studies in animals have shown that cochlear lesions can induce neural plasticity mechanisms both at a cortical and subcortical levels, followed by tonotopic reorganization, similarly
to what happens in the amputation of limbs13,14. Cortical
neurons, without afferent stimuli coming from the cochlea can suffer neuroplastic changes, with subsequent reduc-tion in their firing thresholds for the frequencies around
the affected areas, a theory known as “lesion-edge”15.
Similar mechanisms can be associated to some forms of
tinnitus2. Moreover, clinical observations have led to the
assumption that the cochlear damage, similarly to what happens in the training of perceptions, is followed by a better performance of auditory discrimination in specific
frequencies16. Clinical studies in humans reinforce these
concepts, showing through the Frequency Difference Li-mens (FDL) in patients with sensorineural hearing loss and descending audiometric curves, that small differences are
found in those frequencies near the cut-off frequencies16.
With this study we aim at assessing the correlation between audiometric data, psychoacoustic measures associated to tinnitus (TM and MML) and questionnaires validated for Brazilian Portuguese (THI and BDI).
MATERIALS AND METHODS
All the patients were submitted to tonal audiometry, immittance test, Pitch Match (PM) - a test in which the patient correlates tinnitus with a narrow band or pure tone noise, Minimum masking level (MML) - a test in which the patient is exposed to a broad band noise, which is adjusted at each 1-2 dB, until the patient reports no longer percei-ving the tinnitus; and the Cut-off frequency - Fc, defined as the greatest frequency at which the auditory threshold is up to 5 dB above the best threshold, measured only on
the descending audiometric curves17. The methodology
followed was exactly the same in both centers.
All the patients also answered the THI (Tinnitus Handicap Inventory) and BDI (Beck Depression Inven-tory) questionnaires, both in their validated versions for
Brazilian Portuguese9,12.
The parameters evaluated for the sample set were: gender, age, laterality and tinnitus type and duration. The statistical data was obtained in order to establish possible correlations between MML and THI (with the goal of as-sessing the correlation between the intensity with which the patient perceives the tinnitus and the loss caused by it), between THI, MML and BDI (with the goal of checking whether the correlation between THI and MML can suffer any interference from depression), among the frequencies with the worst auditory thresholds and PM; and between Fc and PM (the latter aim at checking whether there is audiometric evidence which corroborates the lesion-edge theory - in tinnitus patients).
In order to compare MML-PM and the categorical variables of gender, laterality, THI and BDI we carried out the t-student test with habitual assumptions of the model (normality and homoscedasticity) and 2 groups were com-pared, otherwise the Mann-Whitney test was employed. The hypothesis of the t-student test was checked with the Kolmogorov-Smirnov test for the normality and with the Levene test for homoscedasticity. In the cases in which more than 2 categories were compared, the F test was done when the hypothesis was confirmed, otherwise the Kruskal-Wallis test was used. In order to compare MML-PM and the quantitative parameters of age, tinnitus time, THI, BDI, frequencies of the worst hearing threshold and the cut-off frequencies, the Pearson correlation coefficient was used.
The study was approved by the Ethics in Research Committee, resolution number 005/2009, and recorded at the ClinicalTrials.gov under # NCT 00976547.
RESULTS
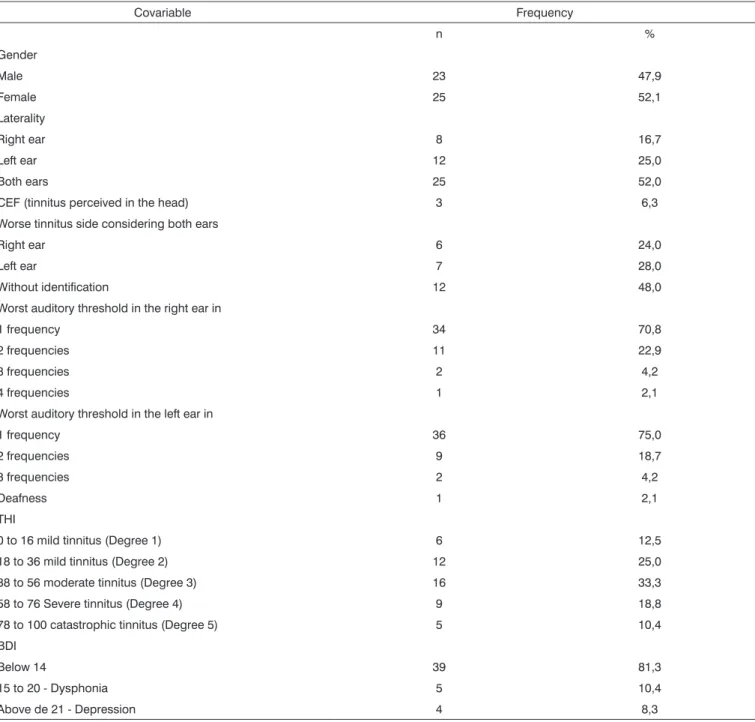
The demographic characteristics, qualitative and quantitative data for the entire sample (n=48) are detailed on Tables 1 and 2.
According to the Mann-Whitney, t Student, Kruskal-Wallis and F Tests, there was not statistical correlation between MML and the variables: gender and laterality, as well as THI and BDI scores. The Pearson’s Correla-tion Coefficient is depicted on Table 3, with statistical tendency towards higher MML values being perceived by elderly patients with unilateral hypoacusis (p- value of around 0.05).
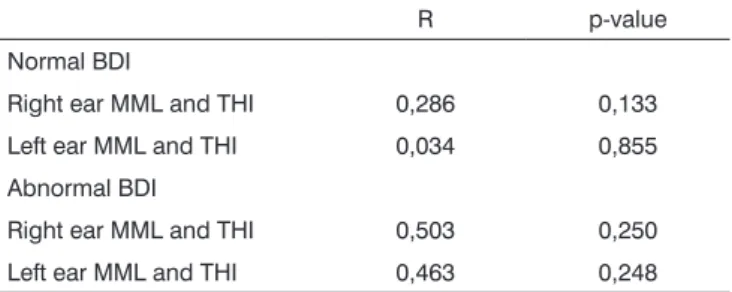
Moreover, we did not see statistically significant differences (Pearson’s Coefficient) on the MML-THI corre-lation between the subgroups with normal and abnormal BDI scores, as detailed on Table 4.
According to Mann-Whitney, Pearson, t Student, Kruskal-Wallis and F tests, we did not find statistical correlations between PM and the variables: gender, age and laterality, as well as the THI and BDI scores. We also did not notice statistical correlations between PM and the audiometric data, including the worst threshold and cut-off frequency (p > 0.05), the latter was analyzed in 30 patients with descending audiometric curves.
DISCUSSION
Our results are in accordance with those from Hiller & Goebel’s study, in which they analyzed the correlation between the Mini-TQ questionnaire and the Klochoff & Lindblom loudness grading system in 4,958 tinnitus
patients (retrospective study)18. The authors concluded
that the volume of the tinnitus perceived by the patient and the annoyance are not necessarily in agreement; and therefore must be assessed separately. On the other hand, Meikle found a positive correlation between the questionnaire used to assess tinnitus and the subjective
volume perceived by the patient19.
The incidence of depression in our sample was low (8.3%), in agreement with studies led by Newman et al., in which we noticed a weak correlation between
tinnitus and depression6. However, other studies have
established a clear correlation between tinnitus and
de-pression7,20. One explanation for such fact may reside in
the mean THI of our sample (45.5 - moderate score). We agree with Newman, since, in our opinion this population represents more reliably the tinnitus patients regularly seen by ENTs. Many clinical studies in tinnitus patients have in their samples high mean THI values, which are frequently associated with depression. Such fact can be associated with different results from different treatment modalities.
Our data shows a mild statistical trend towards higher MML in elderly patients with unilateral dysacousia, and such finding can be interpreted carefully because of its little statistical representativeness.
Table 1. Categorical variables for the total sample (n=48).
Covariable Frequency
n %
Gender
Male 23 47,9
Female 25 52,1
Laterality
Right ear 8 16,7
Left ear 12 25,0
Both ears 25 52,0
CEF (tinnitus perceived in the head) 3 6,3
Worse tinnitus side considering both ears
Right ear 6 24,0
Left ear 7 28,0
Without identification 12 48,0
Worst auditory threshold in the right ear in
1 frequency 34 70,8
2 frequencies 11 22,9
3 frequencies 2 4,2
4 frequencies 1 2,1
Worst auditory threshold in the left ear in
1 frequency 36 75,0
2 frequencies 9 18,7
3 frequencies 2 4,2
Deafness 1 2,1
THI
0 to 16 mild tinnitus (Degree 1) 6 12,5
18 to 36 mild tinnitus (Degree 2) 12 25,0
38 to 56 moderate tinnitus (Degree 3) 16 33,3
58 to 76 Severe tinnitus (Degree 4) 9 18,8
78 to 100 catastrophic tinnitus (Degree 5) 5 10,4
BDI
Below 14 39 81,3
15 to 20 - Dysphonia 5 10,4
Above de 21 - Depression 4 8,3
Table 2. Quantitative variables for the entire sample (n=48).
Covariable n n* Mean SD Minimum Maximum Median
Age (years) 48 0 56,3 12,5 22,0 80,0 56,5
Evolution time (years) 48 0 8,5 8,8 1,0 38,0 5,5
MML right ear (dB) 36 12 50,4 21,2 9,0 95,0 51,0
MML left ear (dB) 40 8 50,8 18,7 15,0 93,0 50,0
TM right ear (Hz) 36 12 5.499,0 3.018,0 250,0 11.200,0 6.000,0
TM left ear (Hz) 40 8 5.555,0 2.966,0 500,0 11.200,0 6.000,0
THI 48 0 45,5 24,0 4,0 98,0 46,0
of 15 dB)21. Since the methodology of audiologic tests was similar to that from other studies a possible explanation could be associated to the presence of different subtypes of tinnitus or to variations associated with the patient’s skill to perceive and compare sounds (sociocultural aspects).
Our data are in disagreement with some studies whi-ch established a correlation between the tinnitus frequency
and the hearing loss frequencies22,23. Moreover, there was
no correlation between Fc and PM. Considering the fact that about 90% of the patients with tinnitus have hearing loss1 and the most current theories associate tinnitus with central neuroplastic changes which follow an initial
dama-ge - usually cochlear2, it is reasonable to assume eventual
correlations between the hearing loss frequencies (or neighboring to them) and the tinnitus frequency. In our study we were unable to establish such relations given the relatively small number of patients. The data set reinfor-ces the extreme complexity of tinnitus as a symptom, not being restricted to the interactions between sensorineural hearing loss, neuroplasticity and, eventually, depression.
Our data reinforces the extreme complexity of tinnitus as a symptom. We believe that a standardized assessment strategy could be extremely useful in the stan-dardization and reproducibility of clinical studies about tinnitus, since there is no correlation between numerous methods currently in use.
CONCLUSION
We did not notice statistically significant correlations between psychoacoustic measures (Pitch matching and Minimum Masking Level), audiometric data (frequency with the worst threshold and cut-off frequencies) and
ques-tionnaires validated to assess tinnitus (Tinnitus Handicap Inventory) and depression (Beck Depression Inventory).
ACKNOWLEDGMENT
META Consultoria Estatística, for the statistical analysis.
REFERENCES
1. M c F a d d e n , D . T i n n i t u s : F a c t s , T h e o r i e s a n d T r e a t m e n t s . Washington,D.C.:National Academy Press;1982.p. 1-150.
2. Moller AR. Tinnitus: presence and future. Prog Brain Res. 2007; 166:3-16.
3. Azevedo AA, Oliveira AM, Siqueira AG,Figueiredo RR. A critical analysis of tinnitus measuring methods. Braz J Otorhinolaryngol. (Engl. Ed.). 2008; 73 (3):418-23.
4. Meikle MB, Stewart BJ, Griest SE, Henry JA. Tinnitus Outcomes Asses-sment. Trends Amplif. 2008;12(3):223-35.
5. Nunally JC, Bernstein IH. Psychometric theory. 3rd ed. New York: McGraw-Hill;1994.
6. Newman CW, Jacobson GP, Spitzer JB.Development of the Tinnitus Handicap Inventory. Arch Otolaryngol Head Neck Surg. 1996;122:143-8. 7. Kuk FK, Tyler RS, Russell D, Jordan H. The psychometric properties
of a Tinnitus Handicap Questionnaire. Ear Hear. 1990;11:434-45. 8. Hiller W, Goebel GRapid assessment of tinnitus-related psychological
distress using the Mini-TQ. Int J Audiol. 2004;43:600-4.
9. Schmidt LP, Teixeira VN, Dall’Igna C,Dallagnol D, Smith MM. Brazilian Portuguese Language version of the “Tinnitus Handicap Inventory”: validity and reproducibility. Braz J Otorhinolaryngol. (Engl. Ed.). 2006;72:808-10.
10. Dunn G, Sham P, Hand, D. Statistics and the Nature of Depression. Psychological Medicine. 1996;23:871-89.
11. Beck AT, Ward CH, Mendelson M,Mock J, Erbaugh J. An inventory for Measuring Depression. Archives of General Psychiatry. 1961;4:53-63. 12. Cunha JA Guide of the Portuguese version of the Beck scales. 1 st Ed:
Casa do Psicólogo; São Paulo; 2001.
13. Irvine DRF, Rajan R. Plasticity in the mature auditory system. In: Manley GA KG, Köppl C, Fastl C, Oeckinghaus O, editor. Advances in hearing research. Singapore: World Scientific 1990.p. 3-23.
14. Kaas JHPlasticity of sensory and motor maps in adult mammalians. Annu Rev Neurosci. 1991;14:137-67.
15. Rajan R, Irvine DR, Wise LZ,Heil P. Effects of unilateral partial cochlear lesions in adult cats on the representation of lesioned and unlesioned cochleas in primary auditory cortex. J Comp Neurol. 1993;338:17-49 16. McDermott HJ, Lech M, Kornblum MS,Irvine DRF.Loudness
percep-tion and frequency discriminapercep-tion in subjects with steeply sloping hearing loss: Possible correlates of neural plasticity. J Acoust Soc Am. 1998;104(4):2314-25.
17. Thai-Van H, Micheyl C, Norena A, Collet L. Local improvement in auditory frequency discrimination is associated with hearing loss slope in subjects with cochlear damage. Brain. 2002;125:524-37.
18. Hiller W, Goebel GWhen Tinnitus Loudness and Annoyance Are Dis-crepant: Audiological Characteristics and Psychological Profile. Audiol Neurootol. 2007;12:391-400.
19. Meikle MB Methods for evaluation of tinnitus relief procedures. In J.-M. Aran & R. Dauman (Eds.), Tinnitus 91: Proceedings of the Fourth International Tinnitus Seminar. New York: Kugler;1992.p 552-62. 20. Bartels H, Middel BL, Vand der Laan BF, Stals MJ, Albers FJW.The
additive effect of co-occurring anxiety and depression on health status, quality of life and coping strategies in help-seeking tinnitus sufferers. Ear Hear. 2008;29(6):947-56.
21. Meikle MB, Creedon TA, Griest SE. Tinnitus Measurement (Tinnitus Archive).Disponível em http://www.tinnitusarchive.org. Acessado em 11 de Maio de 2009.
22. Potier M, Hoquet C, Lloyd R ,Nicholas-Puel C, Uziel A, Puel JL. The Risks of Amplified Music for Disc-Jockeys Working in Nightclubs. Ear Hear. 2009;30(2): 291-3.
23. Norena A, Micheyl C, Chery-Croze S, Collet L. Psychoacoustic cha-racterization of the tinnitus spectrum: implications for the underlying mechanisms of tinnitus. Audiol Neurootol. 2002;7: 358-69.
Table 3. Pearson’s Correlation Coefficient in patients with unilateral disacousia.
Covariable r p-value
Age (years) 0,409 0,074
Evolution time (years) 0,062 0,795
THI 0,303 0,195
BDI 0,084 0,724
Table 4. Pearson’s Correlation Coefficient between MML and THI among patients with normal BDI (< or equal to 14) and abnormal (>14).
R p-value
Normal BDI
Right ear MML and THI 0,286 0,133
Left ear MML and THI 0,034 0,855
Abnormal BDI
Right ear MML and THI 0,503 0,250