Blood Pressure in Young Individuals as a Cardiovascular Risk Marker.
The Rio de Janeiro study
Erika Maria Gonçalves Campana, Andréa Araújo Brandão, Roberto Pozzan, Maria de Fátima França, Flavia Lopes
Fonseca, Oswaldo L Pizzi, Maria Eliane Campos Magalhães, Elizabete Viana de Freitas, Ayrton Pires Brandão
Universidade do Estado do Rio de Janeiro, Rio de Janeiro, RJ – Brazil
Abstract
Background: The study of the cardiovascular risk variables in young populations is fundamental to establish primary prevention strategies.
Objective: To evaluate the blood pressure (BP), anthropometric and metabolic profile in young individuals from The Rio de Janeiro Study, followed by 17 years.
Methods: A total of 115 individuals (64 males) were evaluated at three different moments (follow-up: 212.23±16.0 months): A1 (12.97±1.48 years), A2 (21.90±1.71 years) and A3 (30.65±2.00 years) and divided in two groups: NG (n=84) with at least two normal BP measurements at the three assessments; HG (n=31) with at least two abnormal BP measurements at the three assessments. BP and body mass index (BMI) were obtained at the three assessments. Levels of glucose, triglycerides, total cholesterol and fractions were obtained at A2 and A3. Abdominal circumference (AC) was obtained only at A3.
Results: 1) The means of BP, BMI and AC (p<0.0001) as well as the prevalence of systemic arterial hypertension (SAH) and overweight/obesity (O/O) (p<0.003) were higher in the HG at the three assessments; 2) The means of LDL-c and glycemia (p<0.05) at A2 and the prevalence of metabolic syndrome (MS) at A3 were higher in the HG; 3) the association SAH+O/O was more prevalent in the HG, whereas the association NBP+NBMI was more prevalent in the NG (p<0.0001) at the three assessments; 4) SAH at A1 (RR=5.20 = 5.20; p<0.0007), male gender (RR=5.26 = 5.26; p<0.0019) and OO at A1 (RR=3.40 = 3.40; p<0.0278) determined an increased risk for AH at the young adult life (A3).
Conclusion: After 17 years of follow-up, the BP of young individuals showed a significant association with the cardiovascular risk variables and the occurrence of MS at the young adult life. (Arq Bras Cardiol 2009; 93(6):608-615)
Key Words: Blood pressure; risk factors; child; adolescent; Brazil; Rio de Janeiro.
Introduction
The cardiovascular disease (CVD) is the main cause of death in the world and it is accountable for around 300,000 deaths/year in Brazil1-4. These figures justify the search for a more profound knowledge of the disease and its risk factors (RF), so that the primary prevention can be increased in our country5-7.
It is acknowledged that the RF are involved in the CVD in adult individuals; however, the information on their implications in young individuals is still limited5-7. However, it is known that atherosclerosis starts at an early age and slowly progresses until the onset of its complications8,9. The Bogalusa Study showed that atherosclerotic lesions were present in the aorta and coronaries of young individuals and that these lesions were related to the presence of RF5-7.
Mailing address: Erika Maria Gonçalves Campana •
Rua São Januário, 159 / 1103 B – Fonseca – 24130386 – Niterói, RJ – Brazil E-mail: [email protected], [email protected] Manuscript received November, 14, 2008; revised manuscript received July 05, 2009; accepted August 06, 2009.
It is of fundamental importance to understand the behavior of risk factors throughout the years, as they tend to repeat and worsen – “The Trail or Tracking Phenomenon”5-7,10-16 – and determine progressive alterations in the cardiovascular system5-7,8,9, 10-16.
In Brazil, the results of the Rio de Janeiro Study (ERJ) have demonstrated that high blood pressure (BP) levels in childhood and adolescence are associated with higher BP levels, anthropometric values and a higher prevalence of metabolic syndrome (MS) at the young adult phase12-16.
All these findings undeniably demonstrate an association between RF and atherosclerotic disease at the early phases of life17. However, the pathway that leads to the transition from increased cardiovascular risk in childhood to CVD in adulthood has yet to be fully established18.
School
Home
Hospital
Family
Ambulatory
Phase I – 1987/1988
Phase II – 1989/1991
Phase III – 1992/1995
Phase IV – 1996/1999
Phase V – 2004/2008 Evaluation1 (A1)
Clinical Evaluation
Longitudinal Evaluation– 17 years Evaluation 2 (A2)
Evaluation 3 (A3)
Anthropometric data PWV ECG OGTT
Molecular and Genetic analysis Inflammatory
Markers
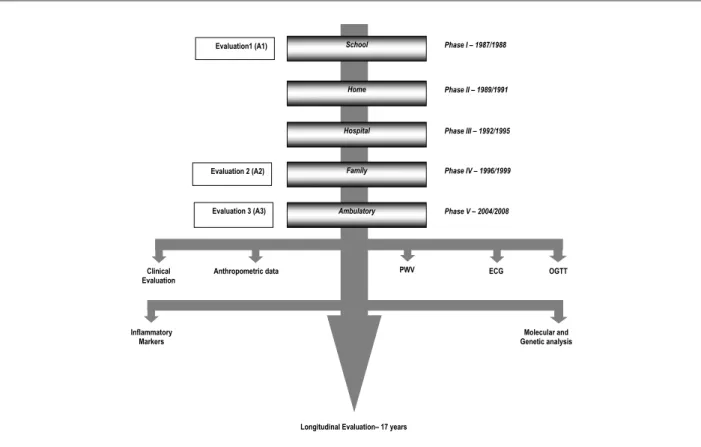
Figure 1 - Algorithm of the Rio de Janeiro Study. Second Phase. PWV - pulse wave velocity; ECG - electrocardiogram; OGTT – oral glucose tolerance test
Methods
The study population is originated from the Rio de Janeiro Study12-16, a line of research on blood pressure (BP) and other cardiovascular RF in young individuals and their families, which has been developed at the Universidade do Estado do Rio de Janeiro since 1983. The present study was carried out in two phases: in the first, around 3,000 children between 6 and 9 years were evaluated (1983-1986) at two phases: school and home, to determine the curves of normality for BP by sex and age range. From 1987 on, the second phase of the ERJ was started and children and adolescents aged 10 to 15 years, who have been followed throughout five phases of assessment: school (1987-1988), home (1989-1991), hospital (1992-1995), family (1996-1999) and ambulatory (2004-2008) were evaluated. The present study is part of this last phase (Figure 1). A total of 3,900 children were assessed in A1 to determine the normality curves of BP by sex and age range. In A2, two groups of individuals were studied, stratified by the BP obtained in A1: the group with increased BP, defined by a BP level ≥95p, and the group with normal BP, defined as BP level ≤50p. These two groups comprehended a sample of 385 target-students that were studied and followed at the subsequent phases of the ERJ. Therefore, the 115 students that participated in A3 are representative of the 385 participants in A2; however, they are not representative of the 3,900 young individuals evaluated at the school phase of the second phase of the ERJ, due to the design of the previously described study.
We evaluated 115 individuals (64 males), designated as target-students, of both sexes, during a follow-up of 212.23±16.0 months. For the present study, three evaluations of the second phase of the ERJ were considered, as follows: A1 (School phase): at 12.97±1.48 years (10-16 yrs), A2 (Family phase): at 21.90±1.71 years (18-26 yrs) and A3 (Ambulatory phase): at 30.65±2.00 years (27-36 yrs).
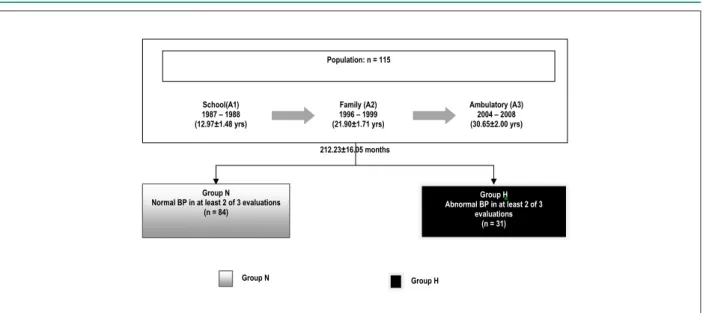
Two groups were formed according to the behavior of the BP, as follows: group N (at least two normal BP measurements at the three assessments), with 84 individuals (42 males) and group H (at least two abnormal BP measurements at the three assessments) with 31 individuals (22 males) (Figure 2).
The study was approved by the Ethics Committee in Research of HUPE. All individuals signed the Free and Informed Consent Form.
A questionnaire was applied at the three assessments to analyze the clinical, epidemiological and sociocultural variables and BP, weight (W) and height (H) were obtained and the body mass index (BMI) was calculated. At A2 and A3, blood glucose, total cholesterol, HDL-c and triglycerides were measured after a 12-hour fasting and LDL-c was calculated. Also at A2, insulin levels were measured and the HOMA-IR was calculated. At A3, the measurement of the abdominal circumference (AC) was added.
Population: n = 115
Group N Normal BP in at least 2 of 3 evaluations
(n = 84) School(A1) 1987 – 1988 (12.97±1.48 yrs)
Family (A2) 1996 – 1999 (21.90±1.71 yrs)
Ambulatory (A3) 2004 – 2008 (30.65±2.00 yrs)
Group H Abnormal BP in at least 2 of 3
evaluations (n = 31)
Group N Group H
212.23±16.05 months
Figure 2 - Sample stratiication by BP behavior at the three different moments of evaluation. RJS - Rio de Janeiro Study; Group N - Normal; Group H - Abnormal
5-minute interval between each measurement and the last one was used for the analysis. Systemic arterial hypertension (SAH) was considered when the BP at A1 was ≥ 95 percentile for sex and age and at A2 and A3, when BP ≥140/90 mmHg.
The BMI was obtained through the ratio: BMI=W/H2. A normal weight was considered when the BMI values were <25kg/m²; overweight was considered when BMI was between 25kg/m² and 29.99kg/m2;and obesity when BMI values were ≥30kg/m20.
The abdominal circumference was measured using an inextensible measurement tape with a 0.1-cm precision, at the midpoint between the iliac crest and the lower border of the last rib21. Increased AC values were defined as AC> 102 cm for males and > 88 cm for females22,23.
The presence of metabolic syndrome (MS) was defined according to the I Brazilian Guidelines on MS, using the cutoff for fasting glycemia ≥ 100 mg/dl proposed by Grundy and cols22,24.
For the metabolic variables, a normal value was considered when glycemia was <100mg/dl; glucose intolerance when the glycemia was between 100mg/dl and 126mg/dl and DM when the glycemia was ≥126mg/d25. The normal values for the lipid profile followed the recommendations of the IV Brazilian Guidelines on Dyslipidemia and Atherosclerosis Prevention26.
The data obtained were stored in a single database using the Microsoft Access program. The data were analyzed using the statistical program SPSS for Windows, version 8.0.0, Copyright SPSS Inc., 1989 - 1997.
The following statistical tests were used:
• Student’s t test (t): used for the comparison of two sets of data when the following conditions are considered: the mean and standard deviation are good estimates of the central tendency and of the dispersion of these sets; the samples have normal distribution; the populations from where the data were obtained have similar variances and the number of observations is the same for both sets.
• Chi-square Test (χ2): used for the comparison of the frequency distributions of the categorical variables of independent samples.
• The logistic non-linear regression model is used when
the response variable is qualitative with two possible results (dichotomous).
Results
The general characteristics of the 115 target-students and of the two groups created based on the BP behavior throughout the 17 years of follow-up (NG = Normal and HG=Hypertensive) are shown in Table 1.
Systolic and diastolic arterial pressure
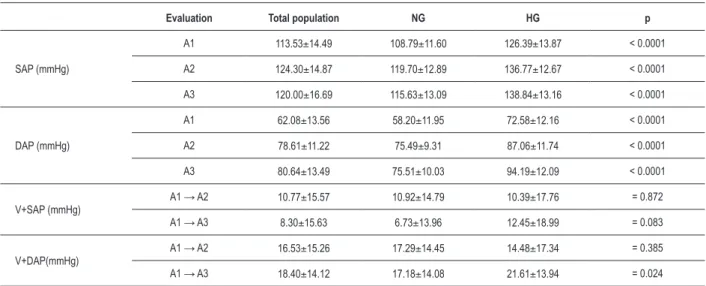
Table 2 shows the means of the systolic (SAP) and diastolic arterial pressure (DAP) in the total population and in the groups at the three moments of assessment, A1, A2 and A3. When comparing the BP behavior between the groups N (NG) and H (HG), it can be observed that the SAP and DAP means were higher in the HG than in the NG, with statistically significant differences at the three assessments.
When analyzing the positive variation of the BP at the end of 9 years (A1→ A2), no statistically significant differences were observed regarding the variation of the SAP, as well as of the DAP, between the NG and the HG. At the end of 17 years (A1→ A3), a higher positive variation of DAP was observed in the HG (p=0.024); the same was not observed for SAP.
The prevalence of SAH was 39.10%, 23.50% and 30.40%, at A1, A2 and A3 respectively. The HG presented a higher prevalence of SAH at the three assessments, when compared to the NG (p < 0.0001).
Anthropometric variables
Table 2 - Means of blood pressure and its variation in the total population and in the groups N and H at the three moments of evaluation
Evaluation Total population NG HG p
SAP (mmHg)
A1 113.53±14.49 108.79±11.60 126.39±13.87 < 0.0001
A2 124.30±14.87 119.70±12.89 136.77±12.67 < 0.0001
A3 120.00±16.69 115.63±13.09 138.84±13.16 < 0.0001
DAP (mmHg)
A1 62.08±13.56 58.20±11.95 72.58±12.16 < 0.0001
A2 78.61±11.22 75.49±9.31 87.06±11.74 < 0.0001
A3 80.64±13.49 75.51±10.03 94.19±12.09 < 0.0001
V+SAP (mmHg) A1 → A2
10.77±15.57 10.92±14.79 10.39±17.76 = 0.872
A1 → A3 8.30±15.63 6.73±13.96 12.45±18.99 = 0.083
V+DAP(mmHg) A1 → A2 16.53±15.26
17.29±14.45 14.48±17.34 = 0.385
A1 → A3 18.40±14.12 17.18±14.08 21.61±13.94 = 0.024
NG – normal group; HG – hypertensive group; SAP – systolic arterial pressure; DAP – diastolic arterial pressure; V+SAP - positive variation of the systolic arterial pressure; V+DAP - positive variation of the diastolic arterial pressure.
Total Population NG HG P
Total (n) 115 84 31
-Follow-up(months) 212.23±16.05 213.32±15.81 209.27±16.58 0.246
Sex (M/F %) 55.7 / 44.3 50.0 / 50.0 71.0 / 29.0 0.045
Mean age in A1 (yrs) 12.97±1.48 12.86±1.50 13.27±1.38 0.180
Ethnicity (C / B / NCNB %) 80.0 / 6.1 / 13.9 85.7 / 4.8 / 9.5 63.3 / 10.0 / 26.7 0.030
Sedentary life style in A3 (Yes %) 60.73 60.7 54.8 0.570
Smoking in A3 (Yes%) 16.7 16.7 3.2 0.058
Alcohol consumption in A3 (Yes %) 58.3 58.3 38.7 0.061
NG - normal group; HG – hypertensive group; t - Student’s t test; BP - blood pressure; M - male; F - female; C - Caucasian; B - Black; NCNB - non-Caucasian, non-Black
ethnicity.
Table 1 - General characteristics of the total population and of N and H groups
statistically significant differences at the three assessments. The same was observed regarding the AC obtained at A3.
The prevalence of overweight/obesity (O/O) in the studied population was 25.20%, 30.40% and 53.9% at A1, A2 and A3, respectively. The HG presented a higher prevalence of O/O when compared to the NG at the three assessments (p < 0.003). The prevalence of increased AC at A3 was 38.30% in the total population, with 71.00% in the HG and 26.20% in the NG (p < 0.0001).
Metabolic variables and metabolic
syndrome
The metabolic variables obtained at A2 and A3 are shown in Table 4.
When the behavior of the groups was compared at A2 and A3, it was observed that the HG showed a more unfavorable metabolic profile (higher means of TC, LDL-c, TGL, glycemia and insulinemia and lower means of HDL-c) when compared to the NG, although statistically significant differences were observed only for LDL-c and glycemia at A2.
The metabolic alterations that comprehend an unfavorable risk profile (low HDL-c, increased insulinemia, glucose intolerance – defined as HOMA-IR > 95th percentile for sex and age at A2, or as fasting glycemia > 100 and < 126 mg/dl at A3), as well as the presence of MS were more prevalent in the HG (Table 5).
Association of BP behavior and BMI
Table 3 - Means of the anthropometric variables in the total population and in the groups N and H at the three evaluations
Evaluation Total population NG HG p
Weight (Kg)
A1 49.76±11.93 47.11±10.54 56.92±12.68 < 0.0001
A2 68.45±14.19 64.63±12.18 78.82±14.26 < 0.0001
A3 75.49±18.70 70.09±15.37 90.13±19.30 < 0.0001
Height (m)
A1 1.56±0.10 1.55±0.10 1.60±0.11 = 0.016
A2 1.69±9.46 1.68±0.09 1.72±0.10 = 0.044
A3 1.69±9.72 1.69±9.37 1.72±10.38 = 0.103
BMI(Kg/m2)
A1 20.15±3.27 19.47±2.83 22.00±3.69 < 0.0001
A2 23.67±3.68 22.64±3.02 26.44±3.92 < 0.0001
A3 26.09±5.45 24.49±4.24 30.44±6.02 < 0.0001
AC (cm) A3 90.46±13.48 86.74±10.84 100.41±14.91 < 0.0001
NG - normal group; HG – hypertensive group; t – Student’s t Test; BMI – body mass index; AC - abdominal circumference. (A1, A2 and A3), a combination of these two conditions was
observed in four different models: [ normal BP+ normal BMI]; [normal BP+ elevated BMI]; [elevated BP + normal BMI] and [elevated BP + elevated BMI]. It was observed that the most unfavorable association model [ elevated BP+ elevated BMI] presented a higher prevalence at the HG at the three assessments. Inversely, for the normal association model [ normal BP+ normal BMI], a higher prevalence was observed in the NG at the three assessments. The prevalence of the four association models at A1, A2 and A3 are shown in Figure 3.
Logistic regression analysis
A model of logistic regression analysis was built for the analysis of the relative risk (RR), where the dependent variable used was the SAH at A3 and the independent variables analyzed were the presence or absence of SAH at A1, the gender and the presence or absence of O/O at A1. It was observed that the presence of SAH at A1 (RR: 5.20; p < 0.0007), the male gender (RR: 5.26; p < 0.0019) and the presence of de O/O at A1 (RR: 3.40; p < 0.0278) determined an increased risk for the occurrence of SAH at A3.
Table 4 - Means of the metabolic variables in the total population and in the groups N and H at A2 and A3
Evaluation Total Population NG HG p
TC (mg/dl) A2
177.37±33.41 174.80±34.34 183.68±30.61 = 0.214
A3 185.42±36.99 183.04±36.31 191.58±38.59 = 0.293
HDL-c (mg/dl) A2 47.06±12.86
48.50±13.44 43.55±10.71 = 0.071
A3 49.82±14.12 50.66±14.01 47.87±14.42 = 0.368
LDL-c (mg/dl) A2 112.68±
27.71 109.26±28.19 121.06±25.00 = 0.045
A3 115.01±31.54 112.05±31.42 121.73±31.29 = 0.162
TGL (mg/dl) A2
88.12±41.00 85.18±39.99 95.32±43.20 = 0.248
A3 106.85±59.15 102.01±60.39 118.39±55.33 = 0.197
G (mg/dl) A2
92.90±8.32 91.83±8.13 95.51±8.33 = 0.037
A3 82.66±12.58 81.20±13.18 86.32±10.22 = 0.055
Insulin (µUI/ml) A2 13.10±10.19 12.92±10.42 17.19±8.92 = 0.076
HOMA-IR A2 3.27±2.47 2.99±2.53 4.06±2.13 = 0.068
NG - normal group; HG – hypertensive group; χ2 - Chi-square; TC - total cholesterol; HDL-c - HDL-colesterol; LDL-c - LDL-colesterol; TGL - triglycerides; G – glycemia;
Table 5 - Prevalence of low HDL-c, increased insulinemia, glucose intolerance and metabolic syndrome in the total population and in the groups N and H at A2 and A3
Total Population NG HG P
Low HDL-c at A2 52.30% 57.14% 64.50% =0.107
Low HDL-c at A3 45.20% 39.30% 61.30% =0.035
Increased insulin at A2* 18.26% 13.10% 32.26% = 0.008
Glucose Intolerance at A2 (HOMA-IR)** 18.26% 13.10% 32.26% = 0.039
Glucose Intolerance at A3*** 7.00% 4.80% 12.90% 0.128
MS at A3 28.70% 17.90% 58.1% 0.0001
NG - normal group; HG – hypertensive group; χ2 - Chi-square; HDL-c - HDL-cholesterol (mg/dl); MS – metabolic syndrome; * insulin levels >95th percentile15; **HOMA-IR > 95th percentile15; *** fasting glycemia > 100 and < 126mg/dl at A3.
Discussion
It is of fundamental importance to study the behavior of the cardiovascular RF since childhood and adolescence until the adult age, in order to adopt primary prevention measures5-7,17,27-29.
The BP behavior has been analyzed in several populations of young individuals and there is increasing evidence that the BP in childhood is correlated with the BP in the adult life and that SAH in children is an important RF for the future development of CAD27-32.
In the present study, the repetition of normal and abnormal BP values from childhood and adolescence allowed us to
separate the participants in two groups of young individuals that presented the variables that comprehend the cardiovascular RF with different behaviors, reinforcing the importance of observing these variables from the earlier age ranges.
It is known that the BP tends to increase from birth, throughout childhood and adolescence30,31. In this analysis of the ERJ cohort, a similar behavior was observed, with a progressive BP increase with age, verified through the positive variation of the SAP and DAP during the 17 years of follow-up in both the NG and HG.
The BP values observed in childhood tend to remain in the same percentile range with time, which means that the
SAH+O/O NBP+O/O SAH+ N BMI NBP+ N BMI
3.2 57.1
42.6
16.1 73.8
58.3 51.3
69.0
3.2
12.9 32.1
27.0
25.8 15.5
18.3
9.6
11.9
3.2
77.4 8.3
27.0 35.5
3.6 12.2
15.7
6.0
41.9
0% 10% 20% 30% 40% 50% 60% 70% 80% 90% 100%
A1: Total NG HG A2: Total NG HG A3: Total NG HG
p < 0.0001 p < 0.0001 p < 0.0001
A3 A2
A1
Figure 3 - Prevalence of the four models of association between BP and BMI in the total population and in the NG and HG at A1, A2 and A3. NBP+N BMI – normal blood
children with higher BP percentiles tend to remain in the higher percentiles until the adult age17,27,30-32. The BP means and the SAH prevalence were always higher in the HG than in the NG at the three assessments, suggesting that children and adolescents present a pattern of BP behavior throughout time. It is worth mentioning that the original design of the Rio de Janeiro Study (ERJ) was characterized by the follow-up of young individuals with distinct BP behaviors at the school phase: with a BP percentile ≥95 or with a BP percentile ≤50. Therefore, in the subsequent phases of the study, higher SAH prevalence rates are expected than those observed in the general population within this age range.
The body composition is one of the main BP determinants in children. There is a direct association between weight and BP, especially in the second decade of life33-35. In our country, several ERJ cohort publications had already shown the importance of the body composition in BP determinism in children and adolescents12-16. In the present study, higher weight, height and BMI means were observed in HG at the three assessments, showing that this population also presented an association between body composition and BP.
Similarly to what has been reported in the literature12-16,33-35, a progressive increase in the prevalence of increased BMI was observed throughout the 17 years of follow-up (A1 = 25.2% → A2 = 30.4% → A3 = 53.9%). Reinforcing the knowledge of the association between O/O and SAH in this age range, it was observed that, from childhood to the present moment, the target-students that belonged to the HG presented higher prevalence of O/O.
A relevant aspect is to know the pattern of body fat distribution and its association with the RF in young populations34,35. In the study sample, the association between central obesity and BP was evident, with the individuals from the HG presenting a higher mean AC at A3. Additionally, it is important to study the association of SAH and O/O, due to its unfavorable potential11,36-38. The results of the present study are in agreement with those in the literature36-38 demonstrating a progressive increase in the prevalence of the association [SAH + O/O] throughout the 17 years of follow-up (A1 = 15.7% → A3 = 27%). If the condition of at least one of the present factors (SAH or O/O) is considered, it can be observed that this unfavorable risk profile also became more prevalent throughout the follow-up, being present in almost 60% (57.5%) of the target-students in the current phase (A3).
In the present study, the individuals from the HG presented a more unfavorable metabolic profile than those in the NG, with higher TC, LDL-c and TGL means and lower HDL-c means. Among the individuals from the HG, the prevalence of low HDL-c levels was almost two-fold higher than among those from the NG, which reinforces the unfavorable CV risk profile in this group of young individuals.
The aggregation of RF in adults is very common in clinical practice. In the last years, this same association has been documented in the young population12-16,22,24,37. The metabolic syndrome (MS), an important representation of the RF aggregation, is a condition associated with high cardiovascular
morbidity and mortality and with the elevated socioeconomic cost12,14-16,22,37.
In the studied population, a more unfavorable metabolic profile was observed among the target-students from the HG. As observed in the literature39,40, the low HDL-c was a highly prevalent alteration (61.3%) in this population. Other elements that are part of the context of the MS and reflect the alteration in glucose tolerance and insulin resistance (HOMA-IR, abnormal fasting glycemia and high serum insulin levels) were also more prevalent in individuals from the HG, in agreement with the literature12,16,39,40. The prevalence of MS presented a similar distribution, being more prevalent among the target-students from the HG.
It is also important to consider the impact of some modifiable and non-modifiable RF on the increased risk of CVD development. Among the non-modifiable RF, age and gender are acknowledged to be important in CVD determinism. The male gender is associated with a higher cardiovascular risk8,11,17,26,27. At the logistic regression analysis, the main factors related to the occurrence of SAH at the adult age were: male gender (5.26; 95%CI: 1.8438 – 15.0353; p = 0.0019), presence of SAH (5.20; 95%CI: 1.9986 – 13.5061; p = 0.007) and the presence of O/O (3.40; 95%CI 1.1430 – 10.1046; p = 0.0278) in childhood and adolescence (A1), emphasizing that, in addition to the male gender, the presence of SAH and O/O at A1 are important for the cardiovascular risk profile at the young adult phase.
The main limitation of the present study is the same experiences by several other cohorts in the literature and is related to the longitudinal character of the follow-up that determines progressive losses of part of the original sample. However, it is worth mentioning that the population sample of the Rio de Janeiro Study is a non-hospitalized sample and has been followed for the last 17 years, constituting the Brazilian cohort within this age range with the longest follow-up to date.
In conclusion, the maintenance of elevated BP levels from childhood to the young adult life correlated with a more unfavorable profile of cardiovascular risk represented by higher prevalence of arterial hypertension, overweight/obesity, lipid and glycidic alterations as well as the presence of metabolic syndrome in the young adult phase. The findings suggest that the primary prevention measures for cardiovascular risk factors must be initiated in childhood and adolescence.
Potential Conflict of Interest
No potential conflict of interest relevant to this article was reported.
Sources of Funding
This study was partially funded by Faperj.
Study Association
1. Ministério da Saúde. Datasus. Informações de saúde. Estatísticas vitais – Mortalidade e nascidos vivos. [Acesso em 2008 nov. 02]. Disponível em http://w3.datasus.gov.br/datasus/datasus.php
2. Rivera ARQ, Carvalho CCF, Arantes MK. Introdução. In: Souza GMR, Piegas LS, Souza JENR. Proteína C-reativa e doença arterial coronária. Rio de Janeiro: Revinter; 2004. p. 1-4. (Série Monografias Dante Pazzanese).
3. Balbinotto Neto G, Silva EM. Os custos da doença cardiovascular no Brasil: um breve comentário econômico [Editorial]. Arq Bras Cardiol. 2008; 91 (4): 217. 4. Azambuja MIR, Foppa M, Maranhão MC, Achutti AC. Impacto econômico
dos casos de doença cardiovascular grave no Brasil: uma estimativa baseada em dados secundários. Arq Bras Cardiol. 2008; 91 (3): 163-71.
5. Berenson GS, Srinivasan SR, Bao W, Newman WP III, Tracy RE, Wattigney WA. Association between multiple cardiovascular risk factors and atherosclerosis in children and young adults. The Bogalusa Heart Study. N Eng J Med. 1998; 338: 1650-6.
6. Burke GL, Cresanta JL, Shear CL, Miner MH, Berenson GS. Cardiovascular risk factors and their modification in children. Cardiol Clin. 1986; 4(1): 33-46. 7. Berenson GS, Srnivasan SR. Bogalusa Heart Study Group. Cardiovascular
risk factors in young with implications for aging: the Bogalusa Heart Study. Neurobiol Aging. 2005; 26: 303-7.
8. Santos MG, Pegoraro M, Sandrini F, Macuco EC. Fatores de risco no desenvolvimento da aterosclerose na infância e adolescência. Arq Bras Cardiol. 2008; 90 (4): 301-8.
9. Françoso LA, Coates V. Evidências anatomopatológicas do início da aterosclerose na infância e adolescência. Arq Bras Cardiol. 2002; 78 (1): 131-6.
10. Silva MAM, Rivera IR, Ferraz MRMT, Pinheiro AJT, Alves SWS, Moura AA, et al. Prevalência de fatores de risco cardiovascular em crianças e adolescentes da rede de ensino da cidade de Maceió. Arq Bras Cardiol. 2005; 84 (5): 387-92. 11. Monego ET, Jardim PCB. Determinantes de risco para doenças cardiovasculares
em escolares. Arq Bras Cardiol. 2006; 87 (1): 37-45.
12. Brandão AA, Pozzan R, Magalhães MEC, Brandão AP. Aggregation of metabolic abnormalities, overweight and high blood pressure, in young subjects followed-up for a 10-year-period [Abstract]. The Rio de Janeiro Study. J Am Coll Cardiol. 2000; 35 (Suppl A): 264A.
13. Brandão AP, Brandão AA, Araujo EMM. The significance of physical development on blood pressure curve of children between 6 and 9 years of age and its relationship with familial aggregation. J Hypertens. 1989; 7 (Suppl 1): S37-9. 14. Pozzan R, Brandão AA, Cerqueira RCO, Brandão AP. The importance of
overweight on the follow-up of adolescents with different percentiles of blood pressure – The Rio de Janeiro Study [Abstract]. Hypertension. 1995; 25: 28. 15. Pozzan R, Brandão AA, Silva SL, Brandão AP. Hyperglycemia, hyperinsulinemia,
overweight, and high blood pressure in young adults: the Rio de Janeiro Study. Hypertension. 1997; 30 (3pt2): 650-3.
16. Magalhães MEC, Pozzan R, Brandão AA, Cerqueira RCO, Roussoulières ALS, Czwarcwald C, et al. Early blood pressure level as a mark of familial aggregation of metabolic cardiovascular risk factors – the Rio de Janeiro Study. J Hypertens. 1998; 16: 1885-9.
17. Brandão AA, Magalhães ME, Pozzan R, França MF, Pozzan R, Freitas EV, et al. Hipertensão arterial no jovem como marcador para a prevenção cardiovascular primária. Rev SOCERJ. 2002; 15 (4): 247-55.
18. Steinberger J, Daniels S. Obesity, insulin resistance, diabetes, and cardiovascular risk in children – An American Heart Association scientific statement from the atherosclerosis, hypertension, and obesity in the young committee (Council on Cardiovascular Disease in the Young) and the diabetes committee (Council on Nutrition, Physical Activity, and Metabolism) Circulation. 2003; 107 (10): 1448-53.
19. Sociedade Brasileira de Cardiologia. V Diretrizes brasileiras de hipertensão. Arq Bras Cardiol. 2006; 87: 1-48.
20. World Health Organization (WHO). Obesity: preventing and managing the total epidemic. Report of a WHO Consultation Group. Geneva: WHO; 1997. [Acesso em 2006 jun. 10] Disponível em: http://www.who.int/bmi/ index.jsp..
References
21. Callaway CW, Chumlea WC, Bouchard C, Himes JH, Lohman TG, Martin AD, et al. Circumferences. In: Lohman TG, Roche AF, Martorell R (eds). Anthropometric standardization reference manual. Champaign: Human Kinetics Books; 1991. p. 44-5.
22. Sociedade Brasileira de Cardiologia. I Diretriz brasileira de diagnostico e tratamento da sindrome metabolica. Arq Bras Cardiol. 2005; 84 (supl 1): 1-28. 23. Executive Summary of the Third Report of the National Cholesterol Education
Program (NCEP) Expert Panel on Detection, Evaluation and Treatment of High Cholesterol in Adults (Adult Treatment Panel III). JAMA. 2001; 285: 2486-97. 24. Grundy SM, Cleeman JI, Daniels SR, Donato KA, Eckel RH, Franklin BA, et al.
Diagnosis and management of the metabolic syndrome: an American Heart Association/National Heart, Lung, and Blood Institute Scientific Statement. Circulation. 2005; 112: 2735-52.
25. Sociedade Brasileira de Diabetes. Atualização brasileira sobre diabetes. [Acesso em 2008 nov. 2] Disponível em: http://www.diabetes.org.br/ politicas/abdonline.php
26. Sociedade Brasileira de Cardiologia. IV Diretriz brasileira sobre dislipidemias e prevenção da aterosclerose. Arq Bras Cardiol. 2007; 88 (supl 1): S1-19. 27. Brandão AA, Magalhães MEC, Freitas EV, Pozzan R, Brandão AP. Prevenção
da doença cardiovascular: a aterosclerose se inicia na infância? Rev SOCERJ. 2004; 17 (1): 37-44.
28. Pellanda LC, Echenique L, Barcellos LMA, Maccari J, Borges FK, Zen BL. Doença cardíaca isquêmica: a prevenção inicia durante a infância J Pediatr. 2002; 78 (2): 91-6.
29. Hawkins MA. Markers of increased cardiovascular risk: are we measuring the most appropriate parameters? Obes Res. 2004; 12: 107S-114S.
30. Rezende DF, Scarpelli RAB, Souza GF, Costa JO, Scarpelli AMB, Scarpelli PA, et al. Prevalência da hipertensão arterial sistêmica em escolares de 7 a 14 anos do município de Barbacena, Minas Gerais, em 1999. Arq Bras Cardiol. 2003; 81 (4): 375-80.
31. Kelder SH, Osganian SK, Feldman HA, Webber LS, Parcel GS, Leupker RV, et al. Tracking of physical and physiological risk variables among ethnic subgroups from third to eighth grade: the Child and Adolescent Trial for Cardiovascular Health cohort study. Prev Med. 2002; 34 (3): 324-33. 32. Chen X, Wang Y. Tracking of blood pressure from childhood to adulthood: a
systematic review and meta-regression analysis. Circulation. 2008; 117 (24): 3171-80.
33. Silva MAM, Rivera IR, Souza MGB, Carvalho ACC. Medida da pressão arterial em crianças e adolescentes: recomendações das diretrizes de hipertensão arterial e prática médica atual. Arq Bras Cardiol. 2007; 88 (4): 491-5. 34. Guimarães ICB, Almeida AM, Santos AS, Barbosa DBV, Guimarães AC.
Pressão arterial: efeito do índice de massa corporal e da circunferência abdominal em adolescentes. Arq Bras Cardiol. 2008; 90 (6): 426-32. 35. Rosa MLG, Mesquita ET, Rocha ERR, Fonseca VM. Índice de massa corporal
e circunferência da cintura como marcadores de hipertensão arterial em adolescentes. Arq Bras Cardiol. 2007; 88 (5): 573-8.
36. Rabelo LM, Viana RM, Schimith MA, Patin RV, Valverde MA, Denadai RC, et al. Fatores de risco para doença aterosclerótica em estudantes de uma universidade privada em São Paulo – Brasil. Arq Bras Cardiol. 1999; 72 (5): 569-74.
37. Eisenmann JC, Welk GJ, Wickel EE, Blair SN. Aerobics Center Longitudinal Study. Stability of variables associated with the metabolic syndrome from adolescence to adulthood: the Aerobics Center Longitudinal Study. Am J Hum Biol. 2004; 16 (6): 690-6.
38. Ricardo DR, Araújo CGS. Body mass index: a scientific evidence-based inquiry. Arq Bras Cardiol. 2002; 79 (1): 70-8.
39. Miettinen TA, Gylling H, Raitakari OT, Hallikainen M, Viikari J. Adolescent cholesterol metabolism predicts coronary risk factors at middle age: the Cardiovascular Risk in Young Finns Study. Transl Res. 2008; 151 (5): 260-6. 40. Carvalho DF, Paiva AA, Melo ASO, Ramos AT, Medeiros JS, Medeiros CCM,