Copyright © 2008 by Sociedade Brasileira de Pediatria
O
RIGINALA
RTICLEAssessment of nutritional status in children and
adolescents with post-infectious bronchiolitis obliterans
Vera Lúcia Bosa,1 Elza Daniel de Mello,2 Helena Teresinha Mocelin,3
Franceliane Jobim Benedetti,1 Gilberto Bueno Fischer4
Abstract
Objective:To assess the nutritional status of children and adolescents with bronchiolitis obliterans and to analyze associations with clinical and nutritional factors.
Methods:The study included 57 patients. Nutritional status was assessed using z scores for weight/age, stature/ age, weight/stature in children, and stature/age and body mass index percentiles in adolescents. Body composition was assessed via tricipital skin folds, subscapular skin folds, and the sum of both plus the muscular circumference of the arm; pulmonary function was also investigated in subjects over 8 years old.
Results:The high percentages of malnutrition and risk for malnutrition are noteworthy: 21.7 and 17.5%, respectively. Among children, weight/age and stature/age detected higher percentages of malnutrition (21.6 and 16.2%), while weight/stature underestimated this diagnosis. Among adolescents, body mass index detected a high percentage of malnutrition (25%) and of risk for malnutrition (20%). Body composition analysis detected 51% of patients with low muscle reserves, and the majority of patients had normal fat reserves. Compromised pulmonary function was associated with poor performance at exercise (r = 0.434; p = 0.024). Malnutrition and/or nutritional risk and low muscle reserves were significantly associated with the 6-minute walk test (p = 0.032; p = 0.030). There was no association between spirometry and the nutritional variables (p > 0.05).
Conclusion:These results emphasize the need for nutritional intervention, and suggest that, in addition to using weight and height indices for nutritional assessment, it is necessary to combine these with an analysis of body composition, so that a larger number of patients with malnutrition and/or at an increased risk for developing malnutrition may be identified and correctly managed.
J Pediatr (Rio J). 2008;84(4):323-330:Bronchiolitis obliterans, nutritional status, body composition, anthropometry, malnutrition, spirometry.
Introduction
Post-infectious bronchiolitis obliterans (BO) is a conse-quence of aggression to the epithelium of the lower respira-tory tract. It is characterized by obstruction of the distal airways.1The prevalence of BO is unknown, but recent
stud-ies suggest it is on the rise.2In children, BO is more common
during the first year of life and is often associated with acute viral bronchiolitis (AVB).3
Published studies about BO highlight that, as well its diag-nosis, aggressive treatment for infections and oxygen therapy, an adequate nutritional plan should also be developed so that the illness can have favorable clinical evolution. Despite the
1. Nutricionista. Mestranda, Programa de Pós-Graduação em Ciências Médicas/Pediatria, Universidade Federal do Rio Grande do Sul (UFRGS), Porto Alegre, RS, Brazil.
2. Doutora, UFRGS, Porto Alegre, RS, Brazil. Médica, Serviço de Nutrologia, Hospital de Clínicas de Porto Alegre (HCPA), Porto Alegre, RS, Brazil.
3. Doutora, UFRGS, Porto Alegre, RS, Brazil. Médica, Serviço de Pneumologia Pediátrica, Hospital da Criança Santo Antônio - Irmandade Santa Casa de Misericórdia de Porto Alegre (HCSA-ISCMPA), Porto Alegre, RS, Brazil.
4. Doutor, UFRGS, Porto Alegre, RS, Brazil. Professor titular, Pediatria, Universidade Federal de Ciências da Saúde de Porto Alegre (UFCSPA), Porto Alegre, RS, Brazil. Médico, Serviço de Pneumologia Pediátrica, HCSA-ISCMPA, Porto Alegre, RS, Brazil.
No conflicts of interest declared concerning the publication of this article.
Suggested citation:Bosa VL, de Mello ED, Mocelin HT, Benedetti FJ, Fischer GB.Assessment of nutritional status in children and adolescents with post-infectious bronchiolitis obliterans. J Pediatr (Rio J). 2008;84(4):323-330.
Manuscript received Mar 26 2008, accepted for publication May 28 2008.
doi:10.2223/JPED.1812
sparsity of literature stressing the specific importance of nutri-tional care in BO, as well as in other chronic respiratory dis-eases with acute energy consumption, patients require adequate energy intake. Though these needs are specific for each individual, the ultimate goal is to allow them to grow properly for their age.2,4
The few studies available4-8which describe the
nutri-tional status of BO patients are inconsistent in their methods and do not explore the nutritional status of the individuals. However, all of them are in agreement on the attention given to the recovery and/or preservation of nutritional status in this clinical entity and on recognizing the consequences of nutri-tional deficit for the evolution of the disease.
The objective of this study is to assess the nutritional sta-tus of children and adolescents with BO and to analyze asso-ciations with clinical and nutritional factors.
Methods
The cross-sectional study was performed from October 2005 to May 2006 in a population consisting of children and adolescents diagnosed with BO which was followed in the out-patient ward of two hospitals (Hospital da Criança Santo Antônio and Hospital Materno Infantil Presidente Vargas, both in Porto Alegre, Brazil). The diagnosis of BO was based on the coexistence of: (1) persistent airway obstruction after an epi-sode of acute airway obstruction disorder in a child previ-ously healthy in its first year of life; (2) suggestive tomographic imaging, namely a mosaic pattern and/or bronchiectases; and (3) exclusion of other obstructive pulmo-nary diseases, such as cystic fibrosis (CF), tuberculosis, con-genital malformation and human immunodeficiency virus (HIV) infection.8,9The study included children and
adoles-cents ages 1 through 18 from both genders who had the nec-essary physical conditions for anthropometric measurement. Patients were classified as either child or adolescent, depend-ing on their age group.10
Weight and stature anthropometric measurements were taken through the use of standard techniques and calibrated equipment.11
In children, nutritional status was determined using the following z scores: weight by age (ZPI), stature by age (ZEI) and weight by stature (ZPE). Malnutrition and/or low stature were defined as ZPE and ZEI ≤ -2Z, while obesity was defined as ZPE ≥ +2Z;10risk for malnutrition as ZPE ≤ -1.28Z,12and
the tenth percentile for weight by stature;13and overweight
as ZPE ≥ +1.28Z. Children with ZPE ranging from -1.27 to +1.27Z were considered eutrophic12. When more than one
anthropometric index (ZPE, ZPI and ZEI) was used for classi-fication of nutritional status, the lowest value was used in cases where there were discrepancies in the ranges used.
Among adolescents, the study analyzed ZEI and the dis-tribution of body mass index (BMI) percentiles. ZEI was defined as < -2Z for classification as malnutrition and/or low
stature. The study followed theWorld Health Organization (WHO) classification guidelines for the distribution of BMI per-centiles.10Since the WHO classification does not include
nutri-tional risk for malnutrition, we chose to adopt the classification suggested by Frisancho.11We also used self-assessment of
sexual maturation stage,14in which teenagers were
classi-fied as prepubescent, pubescent or post-pubescent.10
In the ≤ 5 years-old group, the data were analyzed with the aid of the WHO Anthro application , beta version, from 02/17/0615; for patients over 5 years-old, the application used
was Epi-Info, version 3.3.2, from 02/09/05, based on Cen-ters for Disease Control (CDC) guidelines.16For BMI
percen-tiles, we also compared them with other reference values.17,18
In assessing body composition, we used tricipital skin-folds (TSF), subscapular skinskin-folds (SSF) and the sum of both (SDCTS) for fat reserves, as well as the muscular circumfer-ence of the arm (MCA) for muscle reserves.11The
measure-ment of arm circumference (AC) was performed using a Secca®inextensible tape measure, while skinfolds were
mea-sured with a Lange®caliper.
Pulmonary function was assessed for patients 8 years-old and older through the use of spirometry and 6-minute walk tests (6MWT). Spirometry was performed using a portable spirometer (SpiroDoc v.3.2, MIR, Italy®), according to ATS/
ERS-2005 recommendations.19The parameter assessed was
the percentage of the forced expiratory volume in 1 second (FEV1).20The 6MWT was performed according to ATS-200221
recommendations. The parameters assessed were total dis-tance run and final and initial oxygen saturation. Decreases in saturation were considered significant if the variation was ≥ 4%. Distance run was presented in terms of z score pre-dicted (Z6MWT).22
Parents and/or guardians provided information regarding cultural and socioeconomic status when the patients and/or their guardians were invited to join the study. Those who accepted signed release forms giving their free and informed consent. The study was approved by the research ethics com-mittees of the two hospitals involved, as per resolution 196.96 of the Brazilian Conselho Nacional de Saúde (National Health Council).
(asymmetrical distribution) correlation tests were used for assessing associations between quantitative variables. The kappa test was used for assessing concordance between methods.
Results
Fifty-seven patients took part in the study, 40 (70.2%) of which were male and 40 (70.2%) of which were white. At the time of the assessment, the mean average age was 8.7 years-old (±4.2 years), ranging from 1.5 to 18.9 years-old. Thirty-seven (64.9%) of the 57 were younger than 10 years-old. As for the sexual maturation stage of the adoles-cents, seven (35%) were classified as prepubescent; eight (40%) as pubescent and five (25%) as post-pubescent. The median average in which the child first presents clinical signs of the disease (first episode of wheezing) was 5 months-old
(P25 = 3.0; P75 = 9.0 months), while the median diagnosis age was 12 months-old (P25 = 9.0; P75 = 17 months). The mean average birth weight was 3,012.7 g (±834.5 g); 11 patients (22%) had birth weights > 2,500 g and 11 patients (22%) were preterm. Socioeconomic status, measured as years of schooling of the mother and/or legal guardian, had a mean average of 6.6 years (±2.9 years), while the median per capitaincome, measured in multiples of the Brazilian mini-mum wage per month, was 0.52 (P25 = 0.36; P75 = 0.74).
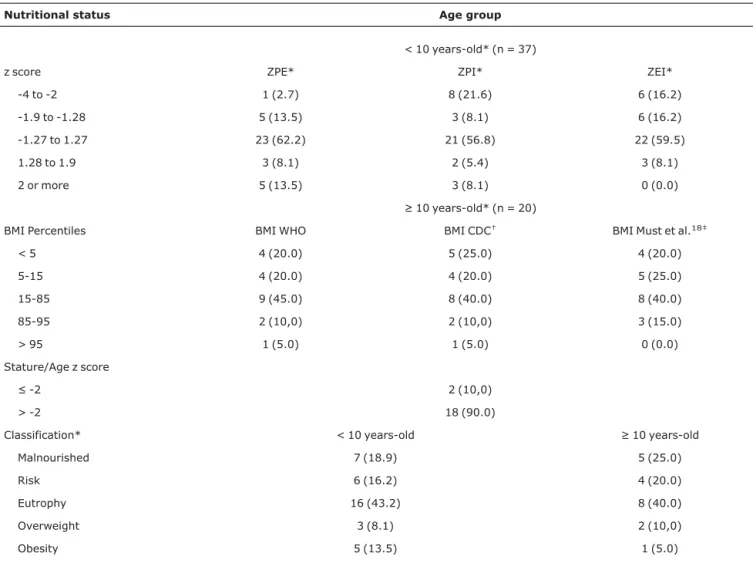
Regarding nutritional status, 24 patients (42.1%) were found to be eutrophic, 12 (21.1%) were malnourished, 10 (17.5%) were at nutritional risk for malnutrition, five (8.8%) were overweight and six (10.5%) were obese. The data for nutritional status of children and adolescents, divided by age group, are shown in Table 1.
The data for body composition for the whole sample can be found in Table 2.
Table 1- Distribution of children and adolescents with post-infectious bronchiolitis obliterans according to nutritional status categorization by z score and body mass index
Nutritional status Age group
< 10 years-old* (n = 37)
z score ZPE* ZPI* ZEI*
-4 to -2 1 (2.7) 8 (21.6) 6 (16.2)
-1.9 to -1.28 5 (13.5) 3 (8.1) 6 (16.2)
-1.27 to 1.27 23 (62.2) 21 (56.8) 22 (59.5)
1.28 to 1.9 3 (8.1) 2 (5.4) 3 (8.1)
2 or more 5 (13.5) 3 (8.1) 0 (0.0)
≥ 10 years-old* (n = 20)
BMI Percentiles BMI WHO BMI CDC† BMI Must et al.18‡
< 5 4 (20.0) 5 (25.0) 4 (20.0)
5-15 4 (20.0) 4 (20.0) 5 (25.0)
15-85 9 (45.0) 8 (40.0) 8 (40.0)
85-95 2 (10,0) 2 (10,0) 3 (15.0)
> 95 1 (5.0) 1 (5.0) 0 (0.0)
Stature/Age z score
≤ -2 2 (10,0)
> -2 18 (90.0)
Classification* < 10 years-old ≥ 10 years-old
Malnourished 7 (18.9) 5 (25.0)
Risk 6 (16.2) 4 (20.0)
Eutrophy 16 (43.2) 8 (40.0)
Overweight 3 (8.1) 2 (10,0)
Obesity 5 (13.5) 1 (5.0)
BMI CDC = body mass index by percentile CDC (2000); BMI Must et al.18= body mass index by percentile Must et al.18; BMI WHO = body mass index by percentile WHO17; ZEI = stature/age z score; ZPE = weight/stature z score; ZPI = weight/age z score.
* n (%).
In analyses of the association between nutritional status and body composition, patients were divided into three groups, according to nutritional status: eutrophy, malnutri-tion and/or risk for malnutrimalnutri-tion and overweight and/or obe-sity. For patients with low muscle reserves (according to MCA), there was significant association with malnourished/at risk patients (p = 0.002). For excess adiposity, the use of TSF and SSF shows that malnourished patients are significantly asso-ciated with low fat reserves. Overweight and obese patients have significant association with high fat reserves, as shown by the use of TSF, SSF and SDCTS. We should stress that, among eutrophic patients, eight (33.3%) had low muscle reserves and three (12.5%) had low fat reserves (p = 0.002; p = 0.001).
Thirty-two patients in total took part in pulmonary func-tion analysis. Three (9.3%) could not perform the necessary motions for the tests (spirometry and 6MWT), while one (3.1%) showed deteriorating health conditions and could not finish them during the time period of this study. One patient showed exacerbating symptoms and could not finish the 6MWT, though he did perform spirometry. The data for nutri-tional status, body composition, spirometry and the 6MWT are shown in Table 3.
Whe the distance run in the 6MWT was assessed for the three groups, malnourished/risk (mean = -2.99Z; SD = 1.43), eutrophic (mean = -1.93Z; SD = 1,05) and overweight/ obesity (mean = -1.99Z; SD = 0.81), there was no statisti-cally significant difference between the three groups (p = 0.105). However, when patients were split into two groups, with group 1 consisting of malnourished and/or risk for mal-nutrition, while group 2 consisted of eutrophic and overweight/obesity patients, the difference was statistically significant (p = 0.032), and patients suffering from malnutri-tion or at risk for malnutrimalnutri-tion had significantly lower Z6MWT scores than the other group. Analyzing the association
between 6MWT and muscle reserves, we found that low muscle reserves patients had significantly lower Z6MWT that those with medium reserves (p = 0.030). Figure 1 shows that the average difference between both groups was 1 SD, both for nutritional status and for body composition.
There was significant positive statistical association between FEV1% and the 6MWT (r = 0.434; p = 0.024), which
indicates that, the smaller the FEV1%, the shorter the
dis-tance run. There was no significant association between decrease in oxygen saturation and FEV1% and with
nutri-tional variables (nutrinutri-tional status and body composition) (p > 0.05). Pulmonary function, as assessed by FEV1%, did not
show any significant association with nutritional variables either (p >0.05).
Discussion
The data collected in this study for diagnosis age and early clinical signs are similar to those found in other studies, which featured diagnosis ages ranging from 1 month-old to 3 years-old,4,8,23while the first respiratory signs are always
seen before the age of 24and the disease was most frequent
among boys.7,8,23In this study, most of the population
con-sisted of white children, which apparently follows the charac-teristics of the general population from which it was sampled.
The role of socioeconomic factors on morbidity and mor-tality for childhood respiratory diseases has been widely described in the literature:24poor socioeconomic and
demo-graphic status interferes strongly with the establishment and course of childhood diseases.25We should also highlight that
the study features a high percentage of lowper capitaincome families and low schooling mothers, which may be explained by the fact that the patients came from two public hospitals which provide tertiary care in a developing nation. Caldwell26
presented evidences of the positive and independent effect of schooling of the mother on childhood mortality rates and Table 2- Distribution of sample of children and adolescents with post-infectious bronchiolitis obliterans according to classification of body
composition (n = 57)
Variables Percentiles/categorization
Body composition < 5 5-95 > 95
Arm circumference 27 (47.4) 28 (49.1) 2 (3.5)
Muscle reserves < 5/low 5-5/medium > 95/high
MCA* 29 (50.9) 27 (47.4) 1 (1.8)
Fat reserves < 5/low 5-5/medium > 85/excess
TSF* 7 (12.3) 39 (68.4) 11 (19.3)
SSF* 3 (5.3) 37 (64.9) 17 (29.8)
SDCTS 9 (15.8) 36 (63.2) 12 (21.0)
recognized the importance of the environment as an interven-ing factor for this association.
Literature on the assessment of nutritional status in BO patients is scarce, and there is no published scientific mate-rial similar to the methods used in this study. Therefore, this study can be considered pioneering in its assessment of the nutritional status and body composition of children and ado-lescents with BO.
The individuals in this study were followed by a multidis-ciplinary team whose members are always and at all times concerned with nutritional status. There was a notable inci-dence of malnutrition (21.1%) and risk for malnutrition (17.5%) among study participants. This scenario is probably due to the use of more sensitive criteria for the assessment of nutritional status, which used various indices for the descrip-tion or classificadescrip-tion of nutridescrip-tional status (since it is known that
none is universal), as well as the morbidity secondary to BO, such as recurring infections, exacerbation episodes and fre-quent hospitalizations. Even without detailed nutritional diag-nosis methods, or with the use of only one index, malnutrition was also a frequent finding in the few existing studies of BO.4,5,7,8
Mocelin et al.7report that, out of 19 patients ranging from
7 to 15 years-old, using ZPE, five (26.31%) presented mild malnutrition [-2 ≤ z < -1] and one (5.2%) presented moder-ate malnutrition (< -2 z), while all others were eutrophic, data points well below those found in this study, which found 21.1% malnourished patients and 17.5% at risk for malnutrition. The authors only used the weight/stature index for assessing nutritional status, which reflects a more recent compromise of growth with deeper consequences for weight and does not take into consideration the age of which individual. The latter Table 3- Distribution of general characteristics of patients with post-infectious bronchiolitis obliterans who performed pulmonary function tests
Characteristics (n = 28) 95%CI
Nutritional status*
Malnutrition and/or risk 12 (42.9) 24.6-61.2
Eutrophy 12 (42.9) 24.6-61.2
Overweight/Obesity 4 (14.3) 1.3-27.3
Body composition
Muscle reserves (MCA)*
Low 17 (60.7) 42.6-78.8
Medium 11 (39.3) 21.2-57.4
High 0 (0.0)
-Fat reserves (SDCTS)*
Low 2 (7.1) 0.0-16.6
Medium 20 (71.4) 54.7-88.1
High 6 (21.4) 6.2-36.6
FEV1Classification*
mild OVD 5 (17.8) 3.6-32.0
moderate OVD 15 (53.5) 35.0-72.0
severe OVD 8 (28.5) 11.8-45.2
6MWT‡(n = 27)
z score† -2.37±1.2 -2.87 to -1.87
Distance run* 507.7±70.8 479.7-535.8
Oxygen saturation
Initial saturation† 97.3±1.07 96.9-97.7
Final saturation† 95.3±3.3 94.0-96.7
Decrease in saturation 12 (44.4) 26.0-62.8
6MWT = 6-minute walk test; 95%CI = 95% confidence interval; FEV1 = forced expiratory volume in 1 second segundo; MCA = muscular circumference of the arm; OVD = obstructive ventilatory defect; SDCTS = sum of tricipital and subscapular skinfolds.
* n (%).
index is more sensitive for the diagnosis of overweight and obesity.10,27
The literature does not feature reports of patients with BO who are overweight. In this study, we found 8.8% of patients were overweight and 10.5% were obese, which is similar to the values found in a study of the general population.28
For the indices used, among children, we found that weight/age and stature/age had higher malnutrition percent-ages, 21.6% and 16.2%, respectively, while weight/stature underestimated the diagnosis of malnutrition. Among adoles-cents, the use of BMI showed a high percentage of patients to be malnourished (25%) or at risk for malnutrition (20%). We must consider the particularities of the indices used when ana-lyzing these results. The use of weight/age is very appropri-ate for tracking weight gain in children. It reflects the individual's global status, but it does not discriminate between acute and chronic nutritional compromise. Stature/age, on the other hand, expresses linear growth. The involvement of the stature/age index suggests a negative influence in child growth in the long run.10,27,29
For body composition, depleted muscle reserves were found in 50.9% of study patients, as estimated by the MCA, and depleted fat reserves, as estimated by TSF, SSF and SDCTS, were found in 12.3%, 5.3% and 15.8%, respec-tively. Fiates et al.,30in their analysis of the body composition
of CF patients, found that 46.1% of patients had depleted muscle reserves (as estimated by assessment of MCA) and 30.7% had depleted fat reserves (as estimated by TSF). The
lack of studies of body composition in BO patients led to mak-ing comparisons with other diseases. In CF, as well as pulmo-nary compromise, many patients also present digestive manifestations. Therefore, these features should be taken into consideration for comparisons with BO.
Among patients classified as eutrophic, 33.3% had low muscle reserves and 12% had low fat reserves, results which highlight the need for better assessment of nutritional sta-tus, especially for patients suffering from chronic disorders. In the present study, if not for the use of wider assessment which associated weight and stature indices to body compo-sition data, up to 45.3% of eutrophic patients, who already had some form of malnutrition (depleted muscle reserves and/or low fat reserves), would not have been properly iden-tified and managed.
For patients (n = 28) whose pulmonary function was tested, we highlight the high percentage of individuals who were either malnourished or at risk for malnutrition (42.9%) and had low muscle reserves (60.7%). The data indicate the deterioration of their nutritional status.
Impairment of pulmonary function was found to be asso-ciated with lower performance 6MWT, a fact which can be associated with the condition of the patients, most of which suffered from moderate-to-severe chronic obstructive pulmo-nary disorder. Malnutrition or risk for malnutrition, as well as low muscle reserves, were significantly associated with 6MWT, which indicates the level of functional limitation for the patients. This sample allows us to infer that the deterioration
* CMA = circumference of the arm.
of nutritional status is directly related to performance in the 6MWT.
There was no significant association between spirometry (FEV1%) findings and nutritional variables. We must consider
that, since this is a rare disorder, only a small sample of patients performed spirometry. The population presented an important nutritional deficit. It is also relatively homoge-neous in pulmonary compromise, since 82% of patients have moderate-to-severe chronic obstructive pulmonary disorder.
The data may reflect the morbidity associated with BO. It reinforces the need for multidisciplinary follow-up for these patients, similar to what happens with other pulmonary dis-orders, such as CF. We stress the importance of systematic nutritional assistance, as well the periodic and detailed assess-ment of nutritional status for these patients. Nutrition might become an important prognostic factor for BO evolution due to the importance of pulmonary growth tracking somatic growth.
In the present study, patients presented major nutri-tional compromise, which indicates that both impairment of pulmonary function and malnutrition are associated with lower performance levels in the 6MWT exercise. Future stud-ies are needed to discover whether malnutrition and low muscle reserves are inherent consequences to BO or if this condition can be reverted with the use of more specific nutri-tional therapy.
Acknowledgements
We would like to thank CNPq for its financial support, and Vânia Naomi Hirakata (Grupo de Pesquisa e Pós-Graduação do Hospital de Clínicas de Porto Alegre - HCPA) and Ceres Oliveira for their contributions to our statistical analyses.
References
1. Hardy KA. Childhood bronchiolitis obliterans. In: Epler G, editor. Diseases of the bronchioles. New York: Raven Press; 1994.
2. Teper A, Fischer GB, Jones MH.Seqüelas respiratórias de doenças virais: do diagnóstico ao tratamento.J Pediatr (Rio J). 2002;78 Suppl 2:S187-94.
3. Hardy KA, Schidlow DV, Zaeri N.Obliterative bronchiolitis in children.Chest. 1988;93:460-6.
4. Lobo AL, Guardiano M, Nunes T, Azevedo I, Vaz LG.Bronquiolite obliterante pós-infecciosa na criança.Rev Port Pneumol. 2007; 13:495-509.
5. Teper AM, Kofman CD, Maffey AF, Vidaurreta SM.Lung function in infants with chronic pulmonary disease after severe adenoviral illness.J Pediatr. 1999;134:730-3.
6. Chan PW, Muridan R, Debruyne JA.Bronchiolitis obliterans in children: clinical profile and diagnosis.Respirology. 2000;5: 369-75.
7. Mocelin H, Fischer G, Iriar K. Evaluación clínica y funcional de niños con bronquiolitis obliterante post-infecciosa con seguimento a largo prazo. Rev Chil Pediatr. 2004;75:12-7.
8. Colom AJ, Teper AM, Vollmer WM, Diette GB.Risk factors for the development of bronchiolitis obliterans in children with bronchiolitis.Thorax. 2006;61:503-6.
9. Milner AD, Murray M.Acute bronchiolitis in infancy: treatment and prognosis.Thorax. 1989;44:1-5.
10. World Health Organization (WHO). Pysical status: the use and interpretation of antropometry. Geneva: WHO; 1995.
11. Frisancho AR. Anthropometric standards for the assessment of growth and nutritional status. Ann Arbor: University of Michigan Press; 1990.
12. Teitelbaum D, Guenter P, Howell WH, Kochevar ME, Roth J, Seidner DL.Definition of terms, style, and conventions used in A. S. P. E. N. guidelines and standards.Nutr Clin Pract. 2005;20: 281-5.
13. Nogueira-De-Almeida CA, Ricco RG, Nogueira MP, Del Ciampo LA, Muccillo G.Avaliação do uso do percentil 10 de peso para idade como ponto de corte para detecção de crianças sob risco nutricional.J Pediatr (Rio J). 1999;75:345-9.
14. Tanner J. Growth at adolescence. 2nd ed. Oxford: Blackwell Scientific; 1962.
15. WHO Multicentre Growth Reference Study Group. WHO Child Growth Standards based on length/height, weight and age. Acta Paediatr Suppl. 2006;450:76-85.
16. National Center for Disease Control do National Center for Health Statistics. 2000 CDC Growth Charts: United States.http:// www.cdc.gov/growthcharts/. Access: 20/02/2008.
17. de Onis M, Onyango AW, Borghi E, Siyam A, Nishida C, Siekmann J.Development of a WHO growth reference for school-aged children and adolescents.Bull World Health Organ. 2007;85:660-7.
18. Must A, Dallal GE, Dietz WH.Reference data for obesity: 85th and 95th percentiles of body mass index (wt/ht2) and triceps skinfold thickness.Am J Clin Nutr. 1991;53:839-46.
19. Miller MR, Hankinson J, Brusasco V, Burgos F, Casaburi R, Coates A, et al; ATS/ERS Task Force.Standardisation of spirometry. Eur Respir J. 2005;26:319-38.
20. Knudson RJ, Lebowitz MD, Holberg CJ, Burrows B.Changes in the normal maximal expiratory flow-volume curve with growth and aging.Am Rev Respir Dis. 1983;127:725-34.
21. ATS Committee on Proficiency Standards for Clinical Pulmonary Function Laboratories.ATS statement: guidelines for the six-minute walk test. Am J Respir Crit Care Med. 2002;166: 111-7.
22. Geiger R, Strasak A, Treml B, Gasser K, Kleinsasser A, Fischer V, et al.Six-minute walk test in children and adolescents.J Pediatr. 2007;150:395-9.
23. dos Santos RV, Rosário NA, Ried CA.Bronquiolite obliterante pós-infecciosa: aspectos clínicos e exames complementares de 48 crianças. J Bras Pneumol. 2004;30:20-5.
24. Prietsch SO, Fischer GB, Cesar JA, Fabris AR, Mehanna H, Ferreira TH, et al.Doença aguda das vias aéreas inferiores em menores de cinco anos: influência do ambiente doméstico e do tabagismo materno.J Pediatr (Rio J). 2002;78:415-22.
25. Carvalhaes MA, Benício MH.Capacidade materna de cuidar e desnutrição infantil. Rev Saude Publica. 2002;36:188-97.
27. Brasil. Ministério da Saúde. Vigilância alimentar e nutricional -SISVAN: orientações básicas para a coleta, processamento, análise de dados e informações em serviços de saúde. Brasília: Ministério da Saúde; 2004.
28. Instituto Brasileiro de Geografia e Estatística. Pesquisa de Orçamentos Familiares (POF) 2002-2003: análise da disponibilidade domiciliar de alimentos e do estado nutricional no Brasil. Rio de Janeiro: IBGE; 2004.
29. Waterlow J. Evaluación del estado nutricional en la comunidad. In: Waterlow JC, editor. Malnutrición proteico-energética. Washington, DC: OPS; 1996.
30. Fiates GM, Barbosa E, Auler F, Feiten SF, Miranda F. Estado nutricional e ingestão alimentar de pessoas com fibrose cística. Rev Nutr. 2001;14:95-101.
Correspondence: Vera Lúcia Bosa