DOI: 10.5935/2359-4802.20180094
ORIGINAL ARTICLE
Mailing Address: Denise Tavares Giannini
Av. 28 de setembro, 77- Vila Isabel - Postal Code: 20551-030, Rio de Janeiro, RJ - Brazil. E-mail: [email protected]
Adductor Pollicis Muscle Thickness as a Marker of Nutritional Status in Heart Failure
Fabiane da Silva Rosário, Denise Tavares Giannini, Viviane de Oliveira Leal, Ricardo Mourilhe-Rocha Universidade do Estado do Rio de Janeiro (UERJ), RJ - Brazil
Manuscript received May 23, 2017, revised manuscript February 03, 2018, accepted June 07, 2018.
Abstract
Background: Malnutrition is associated with morbidity and mortality in patients with heart failure (HF). Thus, it is essential to apply reliable indicators to assess the nutritional status of these individuals.
Objective: To evaluate the thickness of the adductor pollicis muscle (APM) in patients with HF as an indicator of somatic protein status and correlate the obtained values with conventionally used parameters and electrical bioimpedance (EBI) markers.
Methods: Cross-sectional study with patients with HF undergoing regular outpatient treatment. APM thickness was measured in the dominant arm, and the values obtained were classified according to gender and age. The anthropometric parameters assessed included the body mass index (BMI) and specific parameters to assess the muscle (arm muscle circumference [AMC] and arm muscle area [AMA]). Values of phase angle (PA), standard PA (SPA), and lean mass were obtained by EBI. Statistical analyses were performed with the software Statistical Package for the Social Sciences, version 19, using unpaired Student’s t, Mann-Whitney, or one-way analysis of variance (ANOVA) tests for comparisons between groups, as appropriate. The correlation between variables of interest was performed using Pearson’s or Spearman’s correlation coefficient, as adequate. The level of significance was set at 5%.
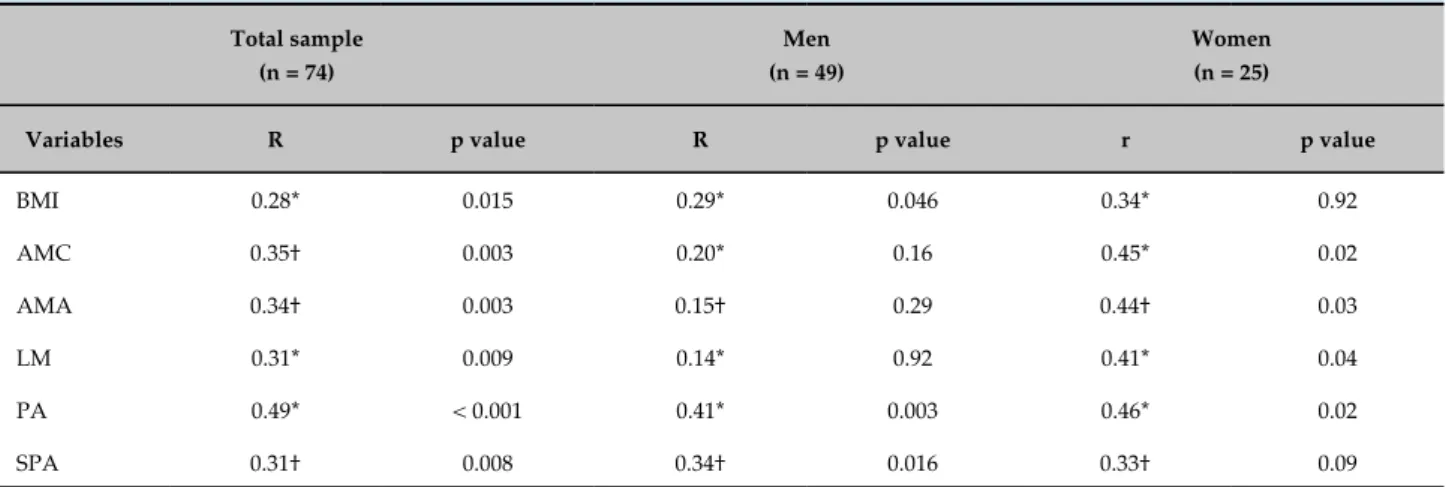
Results: About 70% of the 74 patients evaluated were classified as malnourished according to the APM thickness. Values of AMC, AMA, and lean mass correlated positively with APM thickness (p < 0.005). The APM thickness also correlated positively with PA and SPA (r = 0.49, p < 0.001 and r = 0.31, p = 0.008, respectively).
Conclusion: Patients with HF presented a high frequency of protein malnutrition when APM thickness was used as an indicator of nutritional status. APM thickness values correlated with conventional measures of somatic protein evaluation and may be related to the prognosis of these patients, since they correlated positively with PA and SPA. (Int J Cardiovasc Sci. 2019; [online].ahead print, PP.0-0)
Keywords: Heart Failure; Thumb; Malnutrition / mortality; Nutrition Assessment; Anthropometry.
Introduction
A series of neurohormonal modifications, such as chronic inflammation, anorexia, and resistance to anabolic hormones, are common in heart failure (HF) and are closely related to the emergence of malnutrition in this population.1,2 Malnutrition, in turn, is associated with a higher prevalence of comorbidities and constitutes an important predictive factor for decreased survival regardless of variables like age, functional class, and ejection fraction (EF).2
Although the classification of nutritional status according to body mass index (BMI) indicates a higher prevalence of eutrophy, overweight, and obesity, when evaluating anthropometric measures specifically used to estimate the muscle compartment, patients with HF commonly present different stages of protein malnutrition, independent of total body mass,1,3,4 which can be explained by the fact that BMI does not clearly reflect the body composition.5,6
of body composition; however, difficult logistics associated with its implementation hinders the routine use of this technique in clinical practice. In contrast, electrical bioimpedance (EBI) is considered an alternative and appropriate instrument capable of estimating the body components, distribution of fluids, and cellular quality and integrity.7
Anthropometric variables obtained in the upper part of the body, such as the arm muscle circumference (AMC), can also be considered good indicators of somatic protein mass since they are less affected by the presence of edema.5 In this sense, the measurement of the thickness of the adductor pollicis muscle (APM) emerges as a promising alternative to evaluate the muscle compartment, since it is a simple, noninvasive, and low-cost method.8,9
The APM is the only muscle in the human body whose thickness can be directly measured without requiring estimating equations, reflecting the loss of working capacity due to limitations from the underlying disease.8,9 Due to the lack of scientific evidence on the applicability of APM thickness and its reliability in classifying the nutritional status in individuals with HF, the objective of this study was to evaluate the APM thickness in patients with HF and correlate the results with conventional anthropometric parameters for assessment of the somatic nutritional protein status and with EBI parameters.
Methods
This cross-sectional study evaluated patients regularly attending the Heart Failure Outpatient Clinic at Hospital Universitário Pedro Ernesto (HUPE) and was approved by the institution’s Research Ethics Committee (HUPE/ UERJ, n. 47828915300005259). All patients were previously informed about the methods and objectives of the study and signed an informed consent form. Considering the absence of data on the average values of APM thickness in patients with HF, standard deviation values for APM thickness found in patients undergoing cardiac surgery9 were considered to determine the sample size required for this study. Thus, a minimum of 66 patients would be sufficient to ensure a maximum estimation error of 0.7 mm for APM thickness, with a significance level of 5%.
A total of 90 patients with a diagnosis of HF, of both genders, and aged between 18 and 74 years were considered eligible. The exclusion criteria were patients with clinical evidence of edema and ascites, amputees,
with a pacemaker, or with a BMI < 16 kg/m² or > 34 kg/m², since most equations used to estimate body composition using EBI are unable to predict reliably the body composition in extreme BMI values.10 Patients were also excluded when failing to follow the standardization protocol for EBI or not using diuretics, resulting in a sample of 74 patients.
The etiology and the HF functional class were defined according to the proposal by the New York Heart Association (NYHA).11 Values of EF were obtained by echocardiography at the moment of the clinical and nutritional evaluation of the patient. The presence of comorbidities was obtained from the patients’ clinical records. A patient was considered as having type 2 diabetes mellitus when presenting fasting glucose
≥ 126 mg/dL on at least two occasions or using
hypoglycemic agents,12 and as having chronic renal disease when presenting a glomerular filtration rate
< 60 mL/min for 3 months.13
The assessment of the nutritional status was performed by two previously trained nutritionists and consisted in the assessment of anthropometric measures and EBI.
Anthropometry
Body mass was measured with a mechanical scale (Balmack®, São Paulo, Brazil) with a maximum capacity of 200 kg and subdivisions of 100 grams. Height measurement was obtained with a stadiometer coupled to the scale mentioned above, with an accuracy of
0.1 cm, following the technique proposed by Lohman et
al.14 The nutritional status was assessed according to the BMI, which was classified according to the proposal by the World Health Organization.15
The technique described by Harrison et al.16 was used to measure the arm circumference (AC) and triceps skinfold (TSF). The AC was measured on the dominant arm using an inelastic measuring tape. The TSF thickness
was measured in triplicate with the adipometer Lange
by Frisancho.17 The AMA was directly classified based on the percentiles of reference defined by Frisancho.18
The APM thickness was measured thrice with the
scientific adipometer Lange Skinfold Caliper on the
dominant side of the body, in the center of an imaginary triangle formed by the index finger and thumb. During this assessment, the individual remained seated with the hand relaxed and resting on his or her thigh, and the arm positioned so as to form a 90° angle with the forearm.19 The mean values obtained for the dominant arm were classified according to gender and age, and patients with values below the 5th percentile were considered malnourished. The 5th percentile values are 20, 23, and 18 mm for men in the age range of 18 - 29 years, 30 - 59 years, and above 60 years, respectively. Considering the same age ranges, the 5th percentile values for women are 16, 17, and 14 mm, respectively.20
Electrical bioimpedance
EBI was assessed with the tetrapolar equipment BIA 450 (Biodynamics Corporation, Shoreline, WA, USA) with a 50 kHz sine wave and 800 mA current. The evaluation was performed at the same moment as that of the anthropometric measurements and followed the measurement protocol known as horizontal EBI,21 in addition to the criteria proposed by the Brazilian Medical Association.10
The following EBI parameters were evaluated: phase angle (PA), percentage of body fat (BF), and lean mass. Standard PA values (SPA) were estimated according to the following equation: PA value observed minus the PA reference value according to gender and age, divided by the respective standard deviation.22 Values of PA exceeding 4.2° were considered adequate.23
Statistical analysis
The distribution of the variables was assessed with the Kolmogorov-Smirnov test, and the data are presented as mean ± standard deviation or median (interquartile range) values, as appropriate. Categorical data are presented as percentage. Comparisons between groups were performed with unpaired Student’s t test for parametric variables or Mann-Whitney test for nonparametric variables. One-way analysis of variance (ANOVA) was used to compare parametric variables among three or more groups. The correlation between the variables of interest was
performed using Pearson’s or Spearman’s correlation coefficients, as appropriate. The significance level was set at 5% (p < 0.05), and the statistical analysis was performed using the software Statistical Package for the Social Sciences (SPSS), version 19.0.
Results
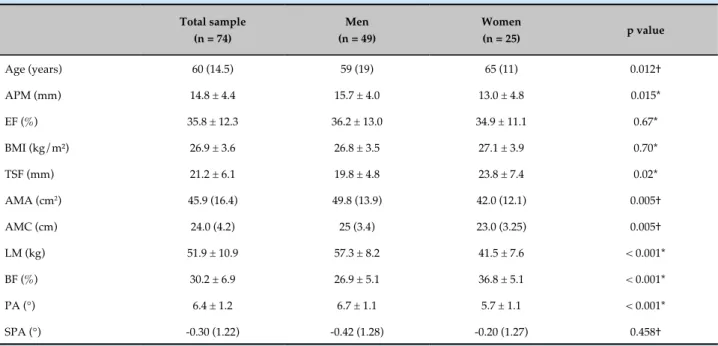
A total of 90 patients with HF were considered eligible, of whom 16 (17.7%) were excluded for meeting the exclusion criteria. Of the 74 patients evaluated, most (66.2%) were male and the most frequent etiology of HF was ischemia (28.4%), followed by idiopathic (24.3%), hypertensive (18.9%), alcoholic and infectious (both with 8.1%), and hereditary (5.4%) causes. Chagas’ disease and drug use had frequencies of 4.1% and 2.7%, respectively. Among the patients evaluated, 31 (41.9%) had type 2 diabetes mellitus, 7 (9.5%) had chronic renal disease receiving conservative treatment, and 3 (4.1%) had chronic obstructive pulmonary disease. Approximately 8% of the patients had undergone angioplasty with stent placement. The HF functional class of higher prevalence was NYHA II (40.5%), followed by I (33.8%), III (23.0%), and IV (2.7%). With respect to EF, 88% (n = 65) of the patients presented a value below 50%. Only 7% (n = 5) of the patients presented PA values below 4.2°. The characteristics of the study population are described in Table 1.
The classification of the nutritional status according to the different nutritional parameters evaluated is presented in Table 2. Most patients presented malnutrition according to the APM thickness, corresponding to approximately 80% (n = 39) of the men and 56% (n = 14) of the women.
The mean APM values in individuals classified as malnourished and well-nourished were 13.1 ± 3.9 and 18.9 ± 2.9 mm, respectively (p < 0.0001, unpaired Student’s t test). Patients considered malnourished had lower SPA values when compared with those classified as eutrophic (-0.5 ± 1.42 versus -0.05 ± 1.56, p = 0.012, Mann-Whitney test).
The mean APM thickness values were not different when patients were stratified according to the HF etiology, classification of BMI, AMC or AMA (performed by one-way ANOVA). Also no difference was observed in APM thickness when the patients were stratified by age
(< or ≥ 60 years, unpaired Student’s t test). However, the
Table 1 - Anthropometric and clinical characteristics of the study population
Total sample (n = 74)
Men (n = 49)
Women
(n = 25) p value
Age (years) 60 (14.5) 59 (19) 65 (11) 0.012†
APM (mm) 14.8 ± 4.4 15.7 ± 4.0 13.0 ± 4.8 0.015*
EF (%) 35.8 ± 12.3 36.2 ± 13.0 34.9 ± 11.1 0.67*
BMI (kg/m²) 26.9 ± 3.6 26.8 ± 3.5 27.1 ± 3.9 0.70*
TSF (mm) 21.2 ± 6.1 19.8 ± 4.8 23.8 ± 7.4 0.02*
AMA (cm2) 45.9 (16.4) 49.8 (13.9) 42.0 (12.1) 0.005†
AMC (cm) 24.0 (4.2) 25 (3.4) 23.0 (3.25) 0.005†
LM (kg) 51.9 ± 10.9 57.3 ± 8.2 41.5 ± 7.6 < 0.001*
BF (%) 30.2 ± 6.9 26.9 ± 5.1 36.8 ± 5.1 < 0.001*
PA (°) 6.4 ± 1.2 6.7 ± 1.1 5.7 ± 1.1 < 0.001*
SPA (°) -0.30 (1.22) -0.42 (1.28) -0.20 (1.27) 0.458†
P values refer to comparisons between men and women. †Mann-Whitney test; *Unpaired Student's t test. APM, adductor pollicis muscle; EF: ejection fraction; BMI: body mass index; TSF: triceps skinfold; AMA: arm muscle area; AMC: arm muscle circumference; LM: lean mass; BF: body fat; PA: phase angle; SPA: standard phase angle.
Table 2 - Nutritional status of patients with heart failure according to assessed nutritional indicators
Parameter Classification N (%)
APM Malnutrition 53 (71.6)
Eutrophy 21 (28.4)
BMI Malnutrition
-Eutrophy 21 (28.4)
Pre-obesity 37 (50.0)
Obesity 16 (21.6)
AMC Malnutrition 29 (39.2)
Eutrophy 37 (50.0)
Overweight/obesity 8 (10.8)
AMA Severe malnutrition 3 (4.1)
Mild/moderate malnutrition 7 (9.5)
Eutrophy 64 (86.5)
AP: adductor pollicis muscle; BMI: body mass index; AMC: arm muscle circumference; AMA: arm muscle area.
significant difference was observed in APM thickness values between groups with EF above and below 50% (unpaired Student’s t test).
The APM thickness correlated with the PA, SPA, and anthropometric variables, as shown in Table 3.
Discussion
Protein malnutrition is a frequent condition in patients with HF.3,24 Despite the assessment of the APM thickness being considered a useful tool to assess somatic protein status in general,20 its use in the assessment of the nutritional status in patients with HF is still emerging. In this sense, our study was a pioneer in assessing APM thickness in patients with HF and found that about 70% of the patients were considered malnourished when the values of the APM thickness were compared to reference values according to gender and age.
The reduction in muscle mass in patients with HF can be explained by physical inactivity, hypermetabolic status, and drug-nutrient interaction, which leads to symptoms such as anorexia, diarrhea, and intestinal edema which, once present, are responsible for the reduction in food ingestion and absorption of nutrients.1 In addition, chronic inflammation is closely related to the development of protein depletion in these patients.1,2 compared with those with NYHA II (16.6 ± 4.1 versus
Table 3 - Correlations between the thickness of the adductor pollicis muscle and variables of interest
Total sample (n = 74)
Men (n = 49)
Women (n = 25)
Variables R p value R p value r p value
BMI 0.28* 0.015 0.29* 0.046 0.34* 0.92
AMC 0.35† 0.003 0.20* 0.16 0.45* 0.02
AMA 0.34† 0.003 0.15† 0.29 0.44† 0.03
LM 0.31* 0.009 0.14* 0.92 0.41* 0.04
PA 0.49* < 0.001 0.41* 0.003 0.46* 0.02
SPA 0.31† 0.008 0.34† 0.016 0.33† 0.09
*Pearson's correlation coefficient; †Spearman's correlation coefficient. BMI: body mass index; AMC: arm muscle circumference; AMA: arm muscle area; LM: lean mass; PA: phase angle; SPA: standard phase angle.
The APM thickness has been related to mortality and risk of complications in different clinical conditions. Bragagnolo et al.25 observed that the APM thickness was associated with a higher risk of death and postoperative complications in patients undergoing gastrointestinal surgery. In patients undergoing dialysis, APM thickness was demonstrated to be associated with a higher risk of hospitalization during 6 months of follow-up.26 When assessed before cardiac surgery, APM was able to predict clinical outcomes, such as septic complications, length of hospital stay, and mortality.9 Although the association between APM and mortality/morbidity has not yet been established for the HF population, the present study demonstrated a direct relationship between APM thickness and PA.
PA is generated from the storage of part of the electric current by the cell membrane,27 and decreased PA values are suggestive of death or reduced cellular integrity, while increased values are suggestive of a greater amount of intact cell membranes. This result is useful even in patients with fluid alteration or in those in whom body weight cannot be measured. In addition, PA values have the advantage of not requiring regression equations, unlike other EBI parameters, such as lean body mass.28
For a healthy population, the mean PA values vary
between 4° and 10°, depending on gender and age. Low
PA values are related to decreased cellular integrity, reduced lean mass, and increased morbidity and mortality.29 As for an unhealthy population, the cutoff values differ among pathologies. In patients with liver
cirrhosis, PA values ≤ 5.4° are associated with greater
mortality when compared with patients with PA values greater than these.30 In the same context, studies have identified PA as being a strong prognostic indicator and an important tool to assess clinical signs and monitor disease progression in patients on peritoneal dialysis (PA = 6.0°),31 HIV-positive (PA = 5.4°),32 or with lung cancer (PA = 4.5°).33
Collin-Ramírez et al.23 also observed in patients with HF that a PA below 4.2° was an independent predictor of mortality. In parallel, patients with PA below this cutoff value (1st distribution quartile) presented lower values of hemoglobin, BMI, and manual dynamometry.
Malnutrition can be detected early by changes in cell membrane and fluid imbalance, which precede anthropometric or biochemical alterations. According to Barbosa-Silva et al.,34 the first level to be affected during the process of malnutrition would be related to metabolic changes, such as alterations in cell membranes detected by PA. Functional muscle changes would be the next affected level, and only after that would anthropometric parameters be modified.
of APM thickness with BMI, AMC, AMA, and lean mass obtained by EBI, especially in women.
Although the present study has observed a correlation between APM thickness and BMI, over half of the patients were classified as having excess weight according to the BMI, and approximately 70% were considered malnourished according to APM thickness. This can be explained by the fact that the BMI is unable to differentiate body compartments, in addition to the fact that increased BMI is associated with a chronic proinflammatory status able to lead to protein depletion.6
The APM thickness was also associated with the SPA. The SPA corresponds to the PA adjusted for gender and age from reference values for the Brazilian population.22 Thus, the SPA can be used to compare studies from different populations with different age and gender distributions. The cutoff value of -1.65 represents the 5th percentile and can be considered as the lowest acceptable limit for a healthy population.25 Still, no studies have defined cutoff values for SPA specific to the HF population.
The use of EBI in patients with HF is considered valid by several authors.37-39 However, there is still debate about its use in these patients. According to the Brazilian Medical Association,10 the use of EBI is not appropriate in situations of ionic or fluid imbalance, such as edema and ascites, conditions frequently observed in patients with HF and which promote water retention and increase in extracellular compartment and, therefore, overestimate the fat-free mass,36 a situation highlighted as one of the main sources of error in the application of the method. Martinez et al.40 claim that due to the variation in tissue hydration in patients with HF, it would be more appropriate to use “raw measures” generated by EBI, such as reactance, resistance, and PA, since these do not depend on regression equations or the patient’s weight.
In the present study, the standardization of assessment using widely known protocols,10,21 in addition to the exclusion of patients not using diuretics, maintaining a homogeneous group, and those with clinical evidence of edema and ascites, were essential for better reliability of the EBI results.
When the HF functional classification was assessed, the APM thickness values were observed to be significantly higher in NYHA I patients when compared with NYHA II ones. The NYHA functional classification11 is an instrument with established validity and reliability, used to evaluate the symptomatic effect of cardiac
disease, allowing to stratify the degree of limitation imposed by the disease on daily activities.41 HF is related to a low tolerance to exercises with pronounced metabolic and respiratory responses capable of leading to inactivity, causing muscle atrophy, which is ultimately associated with fatigue and decreased muscle strength.42,43 This way, it is reasonable to propose that the greater the physical limitation, the higher the NYHA functional class11 and, consequently, the lower the somatic protein mass. Therefore, it is possible that the reduction in APM thickness is related to a reduction in daily activities and is independent from the catabolism and the disease itself.43
Although the present study has been a pioneer in evaluating APM thickness as an indicator of nutritional status in patients with HF, it has some limitations. Due to financial and infrastructure limitations, methods that are more accurate in assessing body composition, such as dual-energy X-ray absorptiometry, could not be carried out. Therefore, the sensitivity and specificity of APM thickness compared with the methods considered the gold standard for the evaluation of the somatic nutritional protein status could not be measured. Additionally, the intraobserver and interobserver variability of APM measurements were not evaluated. However, in order to standardize the protocols of assessment and minimize the variability in APM measurements, the nutritionists responsible for the nutritional assessment were previously trained to perform anthropometric assessment and EBI.
Conclusions
The present study showed an increased frequency of malnutrition when APM thickness was used as a diagnostic indicator of nutritional status. Traditional indicators used to categorize the nutritional status were also directly associated with APM thickness. In addition, APM thickness values were directly associated with PA and SPA, recognized prognostic markers in different clinical situations. Additional prospective studies should be conducted in order to evaluate alterations in APM thickness in relation to disease duration and severity, as well as the presence of clinical complications and survival of patients with HF.
Author contributions
Conception and design of the research: Rosário FS,
1. Sahade V, Montera VS. Nutritional treatment for heart failure patients. Rev Nutr (Campinas). 2009;22(3):399-408.
2. Okoshi MP, Romeiro FG, Paiva SA, Okoshi K. Heart failure-induced cachexia. Arq Bras Cardiol. 2013;100 (5):476-82.
3. Fülster S, Tacke M, Sandek A, Ebner N, Tschöpe C, Doehner W, et al. Muscle wasting in patients with chronic heart failure: results from the studies investigating co-morbidities aggravating heart failure (SICA-HF). Eur Heart J. 2013;34(7):512-9.
4. Futter JE, Cleland JG, Clark AL. Body mass indices and outcome in patients with chronic heart failure. Eur J Heart Fail. 2011;13(2):207-13.
5. Campillo B, Paillaud E, Uzan I, Merlier I, Abdellaoui M, Perennec J, et al; Comité de Liaison Alimentation-Nutrition. Value of body mass index in the detection of severe malnutrition: influence of the pathology and changes in anthropometric parameters. Clin Nutr. 2004;23(4):551-9.
6. Leal VO, Moraes C, Stockler-Pinto MB, Lobo JC, Farage NE, Velarde LG, et al. Is a body mass index of 23 kg/m² a reliable marker of protein-energy wasting in hemodialysis patients? Nutrition. 2012 (10): 973-977.
7. Eickemberg M, Oliveira CC, Roriz AK, Sampaio LR. Bioelectric impedance analysis and its use for nutritional assessments. Rev Nutr. 2011;24(6):883-93.
8. Bragagnolo R, Caporossi FS, Nascimento DB, Nascimento JE. Adductor pollicis muscle thickness: a fast and reliable method for nutritional assessment in surgical patients. Rev Col Bras Cir. 2009;36(5):371-6.
9. Andrade FN, Lameu EB, Luiz RR. Musculatura adutora do polegar: um novo índice prognóstico em cirurgia cardíaca valvar. Rev SOCERJ. 2005;18(5):384-91.
10. Associação Médica Brasileira. Sociedade Brasileira de Nutrição Parenteral e Enteral. Projeto Diretrizes: Utilização da bioimpedância para avaliação da massa corpórea. São Paulo; 2009.
11. New York Association. Diseases of the heart and blood vessels: nomenclature and criteria for diagnosis, by Criteria Committee of the New York Heart Association / Charles E. Krossmann chairman /and others. 6th ed. Boston: Little Brown; c1964.
12. Diretrizes da Sociedade Brasileira de Diabetes (2015-2016) / Adolfo Milech...[et. al.]; organização José Egidio Paulo de Oliveira, Sérgio Vencio - São Paulo: A.C. Farmacêutica; 2016.
13. National Kidney Foundation. K/DOQI clinical practice guidelines for chronic kidney disease: evaluation, classification and stratification. Am J Kidney Dis. 2002;39(2 Suppl 1):S1-246.
14. Lohman TG, Roche AF, Matorell R. Anthropometric standardization reference manual. Champaign (IL): Human Kinetics; 1988. p. 28-80.
15. World Health Organization. (WHO). Obesity preventing and managing the global epidemic. Report of a WHO consultation on obesity. Geneve; 2000.
16. Harrison GC, Buskirk ER, Carter JE, Johnston F, Lohman TG, Pollock ML, et al. Skinfold thicknesses and measurement techinique. In: Lohman TG, Roche AF, Martorell R. (editors). Anthropometric standardization reference manual. Champaign (IL): Human Kinetics; 1988. p. 55-70.
17. Frisancho AR. Nutritional anthropometry. J Am Diet Assoc. 1988;88(5):553-5.
18. Frisancho AR. Anthropometric standards for the assessment of growth and nutritional status. Ann Arbor: University of Michigan Press; 1990.
19. Caporossi FS, Bragagnolo R, Nascimento DBD, Nascimento JE. Thickness of the adductor pollicis muscle as an anthropometric parameter in critically ill patients. Rev Bras Nutr Clin. 2010;25(3):182-8.
20. Gonzalez MC, Duarte RR, Budziareck MB. Adductor pollicis muscle: Reference values of its thickness in a healthy population. Clin Nutr. 2010;29(2):268-71.
21. Guedes DP. Procedimentos clínicos utilizados para análise da composição corporal. Rev bras Cineantropom Desempenho Hum. 2013;15(1):113-29.
22. Barbosa-Silva MC, Barros AJD, Assunção MCF, Paiva SI. Comparison of phase angle between normal individuals and chemotherapy patients using age and sex reference values. J Parent Ent Nutr. 2005;29(1):532.
23. Colin-Ramirez E, Castillo-Martinez LC, Orea-Tejeda A, Vazquez-Durán M , Rodriguez AE, Keirns-Davis C. Bioelectrical impedance phase angle as a prognostic marker in chronic heart failure. Nutrition. 2012; 28 (9): 901–905.
24. Nogueira ID, Servantes DM, Nogueira PA, Pelcerman A, Salvetti XM, Salles F, et al. Correlation between quality of life and functional capacity in cardiac failure. Arq Bras Cardiol. 2010;95(2):238-43.
25. Bragagnolo R, Caporossi FS, Dock-Nascimento DB, Aguilar-Nascimento JE. Handgrip strength and adductor pollicis muscle thickness as predictors of postoperative complications after major operations of the gastrointestinal tract. e-Eur J Clin Nutr Metab. 2011;6:e21-6.
26. de Oliveira CM, Kubrusly M, Mota RS, Choukroun G, Neto JB, da Silva CA. Adductor pollicis muscle thickness: a promising anthropometric parameter for patients with chronic renal failure. J Ren Nutr. 2012;22(3):307-16.
References
of data: Rosário FS, Giannini DT, Leal VO,
Mourilhe-Rocha R. Analysis and interpretation of the data: Rosário
FS, Giannini DT, Leal VO, Mourilhe-Rocha R. Statistical analysis: Rosário FS, Giannini DT, Leal VO,
Mourilhe-Rocha R. Writing of the manuscript: Rosário FS, Giannini
DT, Leal VO, Mourilhe-Rocha R. Critical revision of the
manuscript for intellectual content: Rosário FS, Giannini
DT, Leal VO, Mourilhe-Rocha R.
Potential Conflict of Interest
No potential conflict of interest relevant to this article was reported.
Sources of Funding
There were no external funding sources for this study.
Study Association
This study is not associated with any thesis or dissertation work.
Ethics approval and consent to participate
27. Barbosa-Silva MC, Barros AJ. Bioelectrical impedance analysis in clinical practice: a new perspective on its use beyond body composition equations. Curr Opin Clin Nutr Metab Care. 2005;8(3):311-7.
28. Paiva SI, Borges IR, Halpern-Silveira D, Assunção MC, Barros AJ, Gonzalez MC. Standardized phase angle from bioelectrical impedance analysis as prognostic factor for survival in patients with cancer. Support Care Cancer. 2009;19(2):187-92.
29. Barbosa-Silva MC, Barros AJ, Wang J, Heymsfield SB, Pierson RN Jr. Bioelectrical impedance analysis: population reference values for phase angle by age and sex. Am J Clin Nutr. 2005;82(1):49-52.
30. Selberg O, Selberg D. Norms and correlates of bioimpendance phase angle in healthy human subjects, hospitalized patients, and patients with liver cirrhosis. Eur J Appl Physiol. 2002;86(6):509-16.
31. Mushnick R, Fein PA, Mittman N, Goel N, Chattopadhyay J, Avram M. Relationship of bioelectrical impedanceparameters to nutrition and survival in peritoneal dialysispatients. Kidney Int Suppl. 2003 Nov;(87):S53-6.
32. Schwenk A, Beisenherz A, Romer K, Kremer G, Salzberger B, Elia M. Phase angle from bioelectrical impedance analysisremains an independent predictive marker in HIV-infectedpatients in the era of highly active antiretroviral treatment. Am J Clin Nutr. 2000;72(2):496-501.
33. Toso S, Piccoli A, Gusella M, Menon D, Bononi A, Crepaldi G, et al. Altered tissue electric properties in lung cancer patients as detected by bioelectric impedance vector analysis. Nutr. 2000;16(2):120-4.
34. Barbosa-Silva MC. Subjective and objective nutritional assessment methods: what do they really assess? Curr Opin Clin Nutr Metab Care. 2008;11(3):248-54.
35. Oliveira DR, Frangella VS. [Adductor pollicis muscle and handgrip strength: potential methods of nutritional assessment in outpatients with stroke]. Einstein. 2010;8(4):467-72.
36. Oliveira CM, Kubrusly M, Mota RS, Silva CA, Choukroun G, Oliveira VN. The phase angle and mass body cell as markers of nutritional status in hemodialysis patients. J Ren Nutr. 2010;20(5):314-20.
37. Steele IC, Young IS, Stevenson HP, Maquire S, Livingstone MB, Rollo M, et al. Body composition and energy expenditure of patients with chronic cardiac failure. Eur J Clin Invest. 1998;28(1): 33-40.
38. Alves FD, Souza GC, Aliti GB, Rabelo-Silva ER, Clausell N, Biolo A. Dynamic changes in bioelectrical impedance vector analysis and phase angle in acute decompensated heart failure. Nutrition. 2014;31(1):84-9.
39. Sandek A, Rauchhaus M. Use of bioimpedance analysis in patients with chronic heart failure? Eur J Heart Fail. 2007;9(1):10-5.
40. Martinez L, Ramirez E, Tejeda A, Asensio LE, Bernal RLP, Rebollar GV, et al. Bioelectrical impedance and strength measurements in patients with heart failure: comparison with functional class. Nutrition. 2007;23(5):412-8.
41. Bocchi EA, Braga FG, Ferreira SM, Rohde LE, Oliveira WA, Almeida DR, et al; Sociedade Brasileira de Cardiologia. [III Brazilian Guidelines on Chronic Heart Failure]. Arq Bras Cardiol. 2009;93(1 Suppl 1):3-70.
42. Nogueira PR, Rassi S, Corrêa Kde S. Epidemiological, clinical e therapeutic profile of heart failure in a tertiary hospital. Arq Bras Cardiol. 2010;95 (3):392-8.
43. Ribeiro JP, Chiappa GR, Neder JA, Frankenstein L. Respiratory muscle function and exercise intolerance in heart failure. Curr Heart Fail Rep. 2009; 6(2): 95-101.