www.atmos-chem-phys.net/16/525/2016/ doi:10.5194/acp-16-525-2016
© Author(s) 2016. CC Attribution 3.0 License.
Sources of nitrogen deposition in Federal Class I areas in the US
H.-M. Lee1, F. Paulot2, D. K. Henze3, K. Travis4, D. J. Jacob4, L. H. Pardo5, and B. A. Schichtel6
1Department of Civil, Environmental, and Architectural Engineering, University of Colorado, Boulder, CO, USA 2Geophysical Fluid Dynamics Laboratory and Princeton University, Princeton, NJ, USA
3Department of Mechanical Engineering, University of Colorado, Boulder, CO, USA 4School of Engineering and Applied Sciences, Harvard University, Cambridge, MA, USA
5USDA Forest Service, Northern Research Station, University of Vermont Aiken Center, Burlington, VT, USA 6Cooperative Institute for Research in the Atmosphere, Colorado State University, Fort Collins, CO, USA
Correspondence to:H.-M. Lee ([email protected])
Received: 15 July 2015 – Published in Atmos. Chem. Phys. Discuss.: 27 August 2015 Revised: 4 December 2015 – Accepted: 16 December 2015 – Published: 19 January 2016
Abstract.It is desired to control excessive reactive nitrogen (Nr) deposition due to its detrimental impact on ecosystems. Using a three-dimensional atmospheric chemical transport model, GEOS-Chem, Nr deposition in the contiguous US and eight selected Class I areas (Voyageurs (VY), Smoky Mountain (SM), Shenandoah (SD), Big Bend (BB), Rocky Mountain (RM), Grand Teton (GT), Joshua Tree (JT), and Sequoia (SQ)) is investigated. First, modeled Nr deposi-tion is compared with Nadeposi-tional Trends Network (NTN) and Clean Air Status and Trends Network (CASTNET) depo-sition values. The seasonality of measured species is gen-erally well represented by the model (R2>0.6), except in JT. While modeled Nr is generally within the range of sea-sonal observations, large overestimates are present in sites such as SM and SD in the spring and summer (up to 0.6 kg N ha month−1), likely owing to model high-biases in surface HNO3. The contribution of non-measured species
(mostly dry deposition of NH3) to total modeled Nr
depo-sition ranges from 1 to 55 %. The spatial distribution of the origin of Nr deposited in each Class I area and the contri-butions of individual emission sectors are estimated using the GEOS-Chem adjoint model. We find the largest role of long-range transport for VY, where 50 % (90 %) of annual Nr deposition originates within 670 (1670) km of the park. In contrast, the Nr emission footprint is most localized for SQ, where 50 % (90 %) of the deposition originates from within 130 (370) km. Emissions from California contribute to the Nr deposition in remote areas in the western US (RM, GT). Mobile NOx and livestock NH3 are found to be the major
sources of Nr deposition in all sites except BB, where
con-tributions of NOx from lightning and soils to natural levels of Nr deposition are significant (∼40 %). The efficiency in terms of Nr deposition per kg emissions of NH3-N, NOx-N, and SO2-S are also estimated. Unique seasonal features are
found in JT (opposing efficiency distributions for winter and summer), RM (large fluctuations in the range of effective re-gions), and SD (upwind NH3emissions hindering Nr
deposi-tion). We also evaluate the contributions of emissions to the total area of Class I regions in critical load exceedance, and to the total magnitude of exceedance. We find that while it is effective to control emissions in the western US to reduce the area of regions in CL exceedance, it can be more effective to control emissions in the eastern US to reduce the magnitude of Nr deposition above the CL. Finally, uncertainty in the nitrogen deposition caused by uncertainty in the NH3
emis-sion inventory is explored by comparing results based on two different NH3inventories; noticeable differences in the
emis-sion inventories and thus sensitivities of up to a factor of four found in individual locations.
1 Introduction
acidification (Galloway et al., 2003; Sullivan et al., 2005). Each of these primary impacts lead to subsequent conse-quences such as disturbances in ecosystems (Galloway et al., 2003) and changes in greenhouse gas emissions and uptakes (Gruber and Galloway, 2008; Reay et al., 2008).
The potential impact of Nr deposition on ecosystems can be evaluated using critical loads (CLs), a quantitative esti-mate of an exposure to one or more pollutants below which no significant harmful effects occur over the long term (Nils-son, 1988). The magnitude of the CL varies across differ-ent types of receptors, e.g., alpine lakes, lichens in forests, alpine vegetation, etc. It can be estimated using various meth-ods (Pardo et al., 2011), which include empirical studies (Bobbink et al., 2010), a steady-state mass balance approach (UBA, 2004), and dynamic modeling (Vries et al., 2010). Pardo et al. (2011) synthesized current research related to Nr deposition and comprehensively assessed empirical CLs for major ecoregions across the US.
National Parks (Organic Act of 1916, 16 USC 1–4) and wilderness areas (Wilderness Act of 1964, 16 USC 1131– 1136) in the US are required to be protected to conserve nat-ural and historic objects and the wildlife therein. Of these, Federal Class I areas are defined as those where visibility is important (Clean Air Act Amendments of 1977, 40 CFR 81). In the US, current Nr deposition exceeds CLs in many Class I areas. Fenn et al. (2010) estimated that one-third of the land area of California vegetation types is in excess of the CL for Nr deposition. Bowman et al. (2012) empirically determined CLs for vegetation and soils in Rocky Mountain National Park and found ongoing vegetation change due to excessive Nr deposition. Benedict et al. (2013a) found sub-stantial exceedance of CLs for Nr deposition in Grand Teton National Park. Ellis et al. (2013) estimated that exceedances will become more pervasive in the coming decades.
It is desired to reduce the number of regions in CL ex-ceedance and the amount of excessive Nr deposited above CLs. To reach this goal, it is necessary to understand the sources contributing to Nr deposition, which include both natural and anthropogenic emissions of NOx and NH3.
Chemical transport models (CTM) can be used to study sources of Nr deposition. Zhang et al. (2012) used a 3-D CTM, GEOS-Chem, to investigate the distribution, sources, and processes of Nr deposition in the US. By toggling emis-sions on and off in consecutive model simulations, they found that Nr deposition was dominated by contributions from domestic NOx and NH3 emissions, followed by
nat-ural and foreign sources. While this approach provided es-timates of the role of the total emissions from these sec-tors throughout the US, refined estimates of source contribu-tions from specific locacontribu-tions can be calculated using the ad-joint of a CTM, which is a computationally efficient tool for such sensitivity analysis (Henze et al., 2009). For example, Paulot et al. (2013) used the adjoint method to identify the sources and processes that control Nr deposition in biodiver-sity hotspots worldwide and in two US national parks
(Cuya-hoga and Rocky Mountain) and found that anthropogenic sources dominate deposition at all continental sites and are mainly located within 1000 km of the hotspots themselves.
The primary purpose of this study is to evaluate the ori-gin of Nr that specifically impacts Federal Class I areas throughout the US, identifying the source locations, species and sectors that contribute to both total deposition and de-position above CLs. The results can thus be used to iden-tify how regionally specific emissions mitigation efforts will impact ecosystems in these protected areas. To accomplish this goal, we evaluate source contributions to the deposition at the collection of all Class I areas as well as eight spe-cific regions: Voyageurs national park (VY), Smoky Moun-tain national park (SM), Shenandoah national park (SD), Big Bend national park (BB), Rocky Mountain national park (RM), Grand Teton national park (GT), Joshua Tree wilder-ness (JT), and Sequoia national park (SQ). Following Ellis et al. (2013), we use the lowest estimate of CL for these areas from Pardo et al. (2011) which are based on CLs for lichens in most regions because lichen is among the most sensitive bio-indicators of N in terrestrial ecosystems. These eight fo-cus areas are selected as they have low CLs (VY, SM, SD, BB, JT: 3 kg N ha−1yr−1, RM, GT, SQ: 2.5 kg N ha−1yr−1) and are thus most likely impacted by Nr deposition. We also choose this set of areas to highlight different spatial distribu-tions of sources and mechanisms governing Nr deposition in regions of the country that are spatially disparate, are subject to a range of nitrogen emission profiles, encompass several types of ecosystems (see Fig. 1), and are subject to Nr depo-sition at levels close to or above CLs.
The secondary purpose is to evaluate the impact of un-certainties in NH3emissions on source attribution of Nr
de-position. NH3emissions are known to have uncertainties of
more than a factor of two in total US emissions in some sea-sons (e.g., Henze et al., 2009; Paulot et al., 2014). Thus, NH3
emissions inventories are often updated through top-down approaches, using constraints provided through inverse mod-eling of wet deposition measurements (e.g., Gilliland et al., 2003, 2006; Zhang et al., 2012; Paulot et al., 2014) or, more recently, remote-sensing observations (Zhu et al., 2013). Here we consider constraints on NH3emissions throughout
the US from Zhu et al. (2013) that were derived from 4-D variational assimilation of NH3remote-sensing observations
from the Thermal Emissions Spectrometer (TES) aboard the Aura satellite (Shephard et al., 2011). We investigate the impacts of these adjustments to NH3 emissions, relative to
those from a national emissions inventory, on source attri-bution of Nr deposition in three Class I areas (VY, SD, and RM). Another consideration is that the air-surface exchange of NH3 emissions is actually bi-directional (Nemitz et al.,
2001; Sutton et al., 2007), an aspect that has recently be-gun to be implemented to air quality models (Cooter et al., 2010; Bash et al., 2013; Pleim et al., 2013; Zhu et al., 2015). Zhu et al. (2015) found increased net NH3emissions in July
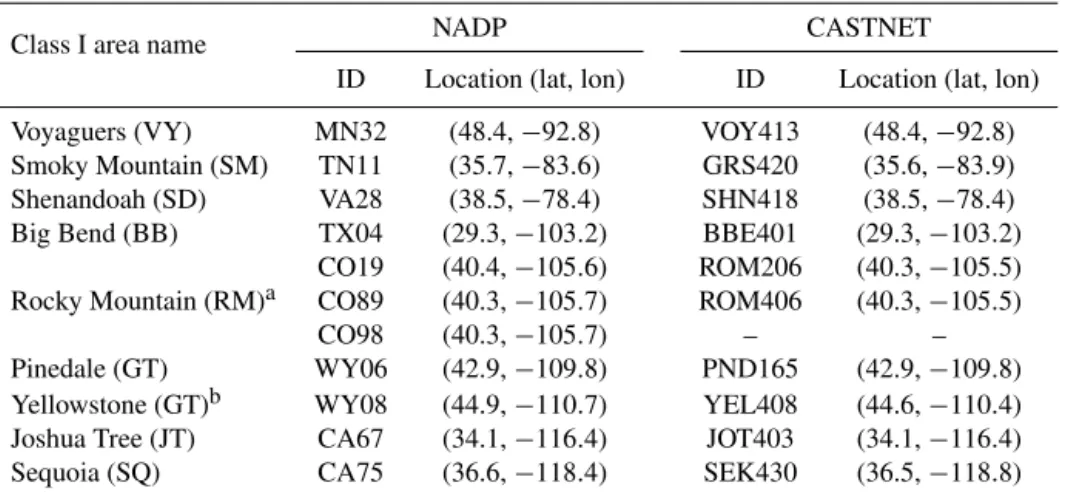
Table 1.NADP and CASTNET sites used for Nr deposition measurements.
Class I area name NADP CASTNET
ID Location (lat, lon) ID Location (lat, lon)
Voyaguers (VY) MN32 (48.4,−92.8) VOY413 (48.4,−92.8)
Smoky Mountain (SM) TN11 (35.7,−83.6) GRS420 (35.6,−83.9)
Shenandoah (SD) VA28 (38.5,−78.4) SHN418 (38.5,−78.4)
Big Bend (BB) TX04 (29.3,−103.2) BBE401 (29.3,−103.2)
Rocky Mountain (RM)a
CO19 (40.4,−105.6) ROM206 (40.3,−105.5)
CO89 (40.3,−105.7) ROM406 (40.3,−105.5)
CO98 (40.3,−105.7) – –
Pinedale (GT) WY06 (42.9,−109.8) PND165 (42.9,−109.8)
Yellowstone (GT)b WY08 (44.9,−110.7) YEL408 (44.6,−110.4)
Joshua Tree (JT) CA67 (34.1,−116.4) JOT403 (34.1,−116.4)
Sequoia (SQ) CA75 (36.6,−118.4) SEK430 (36.5,−118.8)
aAverage of three collocated sites of NADP and 2 collocated sites of CASTET is used. bAverage of Yellowstone and Pinedale is used.
and October (13.9 %) over the US when including the bi-directional flux of NH3 in the GEOS-Chem model. As
bi-directional flux of NH3is not considered in our present work,
this provides additional motivation for studying the response of Nr source attribution to uncertainties in NH3emissions.
The organization of this manuscript is as follows. Modeled seasonality of Nr deposition is compared with measurement data in Sect. 3.1. Sensitivity analysis using the adjoint model is presented in Sect. 3.2. In Sect. 3.3, we examine the impacts of uncertainties in our model’s NH3emissions in the source
attribution results. The paper concludes with summary and discussions in Sect. 4.
2 Methods
2.1 Measurement data
The National Trends Network (NTN) (http://nadp.sws.uiuc. edu) of the National Atmospheric Deposition Program (NADP, 2015) provides weekly records of precipitation amount and chemical properties (i.e., ion concentration, acid-ity, and conductance) at as many as 250 sites across the US. Rainfall is recorded to the nearest 0.01 inch with a weighing-bucket rain gauge at each site. Chemical properties are an-alyzed at the Central Analytical Laboratory (NADP, 2015). Table 1 lists sites used in this study. We use monthly aggre-gate wet deposition of NH+4 and NO−3 for select sites. How-ever, no data are available for SQ in JJA. For GT, we use the average of Yellowstone and Pinedale, WY, measurements because there are no wet deposition measurements made in 2010 in GT. For RM, there are three collocated monitoring sites, and we use the average of them.
The Clean Air Status and Trends Network (CASTNET, http://epa.gov/castnet) measures ambient concentration of ni-trogen and sulfur weekly at about 90 sites across the US and
Canada. More than 20 of these sites are within Class I ar-eas. A 3-stage filter pack is used to measure nitrogen con-centrations. Dry deposition flux is then calculated using the dry deposition velocity estimated by the Multi-Layer Model (MLM) (CASTNET, 2014). For simplicity when discussing these values along with other observations, we refer to these derived quantities as dry deposition measurements, although we recognize here that dry deposition is not directly mea-sured. We use monthly aggregate dry deposition of NH+4, NO−3, and HNO3for select sites. Yellowstone and Pinedale,
WY, measurements are used for GT since there is no CAST-NET site in GT.
2.2 GEOS-Chem model description
GEOS-Chem (www.geos-chem.org) is a three-dimensional atmospheric CTM driven by meteorological input from the Goddard Earth Observing System (GEOS) of the NASA Global Modeling and Assimilation Office (Bey et al., 2001). We use GEOS-Chem adjoint version 35 with a nested grid resolution of 1/2◦ latitude× 2/3◦ longitude with 47 verti-cal layers up to 0.01 hPa (Wang et al., 2004; Chen et al., 2009; Zhang et al., 2011) for the modeling domain over the contiguous US (126–66◦W, 13–57◦N). The model includes detailed tropospheric gas-phase chemistry of the O3-NOx -hydrocarbon system (Hudman et al., 2007). Aerosols are as-sumed to be externally mixed and the thermodynamic equi-librium between gases and aerosol of NH3-H2SO4-HNO3is
0 0.2 0.4 0.6 0.8 1 Voya geur
s (VY)
Sm oky Moun tain (SM) Shen ando
ah (SD )
Big Ben
d (B B)
Roc ky Mo
unta in (R
M)
Gra nd T
eton (GT)
Josh ua T
ree (JT) Sequ oia (SQ )
Mire, Bog, Fen Deciduous Broadleaf Forest Cool Mixed Forest Forest and Field Crops and Town Mixed Forest
Hot and Mild Grasses and Shrubs Succulent and Thorn Scrub Fields and Woody Savanna Cool Forest and Field Cool Fields and Woods Barren Tundra Cool Conifer Forest Hot Irrigated Cropland water
Narrow Conifers Semi Desert Shrubs Dry Woody Scrub Mediterranean Scrub
Figure 1.Composition of vegetation types of select Class I areas used in this study based on Olson (1992).
types (Wesely, 1989). We use vegetation types from Olson (1992), shown in Fig. 1.
Anthropogenic emissions of NOx, SO2, and NH3 in
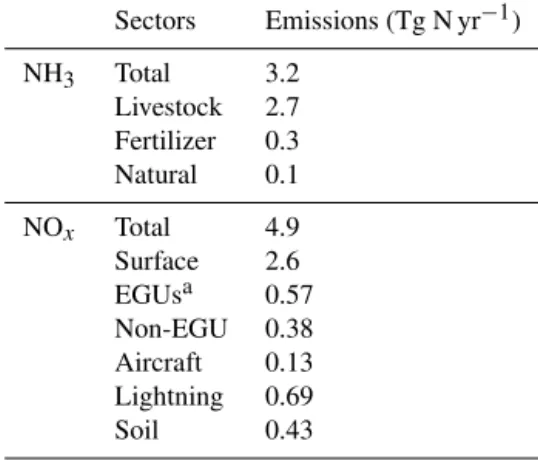
GEOS-Chem are taken from the National Emissions Inven-tory produced by the US EPA (EPA/NEI2008). Annual emis-sions of NOx and NH3 in the contiguous US in 2010 are
shown in Table 2. Mobile emissions of NH3are not shown
explicitly here, as they are <4 % of the US total in the NEI2008, although this may be an underestimate in urban areas (Kean et al., 2009). Anthropogenic sources of NOx includes surface sources, electric generating units (EGUs), and non-EGU industrial point sources. Surface sources of NOx comprises on-road (diesel and gasoline exhaust from cars and trucks, 68.4 %), non-road (off-road vehicles, con-struction equipment, industrial, commercial, and agricultural engines, 17.2 %), and non-point (not otherwise included, e.g., residential heating, oil and gas development, 14.4 %) sources. Biomass burning emissions are taken from the 3-h GFED3 inventory (Mu et al., 2011; van der Werf et al., 2010). NOx emissions from aircraft are described in Wang et al. (1998). Natural emissions of NOx are from lightning (Mur-ray et al., 2012) and soil (Yienger and Levy, 1995; Wang et al., 1998). Natural emissions of NH3 from soil,
vegeta-tion, and ocean sources are from the GEIA inventory (Bouw-man et al., 1997). In Sect. 3.3, we consider NH3emissions
constrained by remote-sensing observations from Zhu et al. (2013), which we refer to as optimized NEI2005. Bidirec-tional NH3exchange is not considered in this study.
2.3 Nr deposition metrics in Federal Class I areas Here we consider several metrics (cost functions) for quan-tifying Nr deposition and CL exceedances in Federal Class I areas. When considering strategies for reducing Nr deposi-tion in Class I areas, several possible quesdeposi-tions of interest arise, such as: (1) how do emissions from different source locations and sectors affect Nr deposition in specific individ-ual Class I areas? (2) Which emissions contribute the most to the spatial extent of all Class I regions in exceedance? And (3) what is the amount by which emissions contribute
Table 2.NOxand NH3emissions in the contiguous US in 2010.
Sectors Emissions (Tg N yr−1)
NH3 Total 3.2
Livestock 2.7
Fertilizer 0.3
Natural 0.1
NOx Total 4.9
Surface 2.6
EGUsa 0.57
Non-EGU 0.38
Aircraft 0.13
Lightning 0.69
Soil 0.43
aElectric generating units
to the severity of Nr deposition in Class I areas above CLs? Each of these three questions corresponds to a unique ap-proach to defining the cost function for our sensitivity calcu-lations. The cost functions in this study include the follow-ing constituents: the sum of wet and dry deposition of NH3,
NH+4, NO−3, and HNO3, and dry deposition of NO2, PANs
(peroxyacetyl nitrate and higher peroxyacyl nitrates: perox-ymethacroyl nitrate, peroxypropionyl nitrate), alkyl nitrate, and N2O5. Although dry deposition of NO2, PANs, alkyl
ni-trate, and N2O5 are not part of the CL estimates by Pardo
et al. (2011), the sum of these species does not significantly contribute to our modeled Nr deposition or comparison to these CLs.
We first consider a cost function formulated for source attribution of Nr deposition in an individual Class I area. It is defined as the annual Nr deposition in a region [kg N ha−1yr−1],
Jp=
N
X
i=1
annDepiβi, (1)
where annDepi is the annual Nr deposition in grid cell i,
βi is the fraction of grid celli that is contained within the Class I area, andN is the number of grid cells for whichβi is nonzero for an individual Class I area. Sensitivities of this cost function provide a first order estimate of the contribution of emissions to annual Nr deposition in a particular Class I area.
We next consider a cost function that is the sum of Nr deposition in all Class I areas in CL exceedance, Ja
[kg N ha−1yr−1], defined as
Ja=
L
X
i=1
annDepiβi, (2)
the CL values we use in this study and βi is the fraction of grid cell i that is contained within each Class I area. This metric is proportional to the total area of Class I regions in CL exceedance. Sensitivities ofJawith respect to emissions
thus identify which emissions contribute to the total spatial extent of Class I areas that have Nr deposition above their CL by any amount.
Lastly, we consider a third cost function that is the sum of square of the difference of annual Nr deposition and CL in all Class I areas in CL exceedance,Jc[(kg N ha−1yr−1)2],
which defined as Jc=0.5
L
X
i=1
(annDepi−CLi)2βi, (3) whereLandβi are same as Eq. (2) and CLi is the critical load in grid celli. While both Eqs. (2) and (3) include only regions where annual Nr deposition is higher than the CL, Eq. (3) is more strongly related to the magnitude of the Nr deposition in exceedance (the factor of 0.5 is habitually in-cluded for sensitivity calculations based on the first deriva-tive of J). Sensitivities of Jc quantify the contribution of
emissions to the magnitude of Nr deposition above CL loads, which can then guide analysis of mitigation efforts for reduc-ing the most severe levels of Nr deposition.
2.4 GEOS-Chem adjoint model
The GEOS-Chem adjoint model (Henze et al., 2007) is a tool for receptor-based inverse modeling and sensitivity analysis (e.g., Kopacz et al., 2009; Wecht et al., 2012; Zhu et al., 2013). When it is used for a sensitivity analysis, gradients of the user defined cost function with respect to all model parameters are calculated simultaneously, making the model a very efficient tool for source attribution (e.g., Walker et al., 2012; Paulot et al., 2013; Lapina et al., 2014; Lee et al., 2014). Here we use the model to evaluate the sensitivity of Nr deposition to emission sources, including for the first time all chemical species of Nr present in the GEOS-Chem “full-chemistry” simulation, which considers NOx-Ox -HC-aerosol chemistry.
Non-normalized sensitivities quantify the change in the cost function per change in kg emission. We thus refer to this type of sensitivity as an efficiency in that large non-normalized sensitivities indicate areas where reducing Nr emissions would have a very strong impact on Nr deposi-tion in terms of the response of Nr deposideposi-tion achieved per amount of emissions reduced (as opposed to locations where reducing emissions would have little effect on Nr deposition in the areas of interest, or locations where Nr emissions are just large in magnitude). These are defined as
λi,j≡ ∂J
∂Ei,j
, (4)
whereJis any of the cost functions defined in Sect. 2.3, and λi,j is found from solution of the adjoint model. Ei,j is the
emission at grid cell i of species j. Details of the adjoint model description and validation have been presented previ-ously (Henze et al., 2007, 2009). We also consider the semi-normalized sensitivity [kg N ha−1yr−1], defined as
χi,j,k≡λi,j·Ei,j,k, (5)
whereEi,j,kis the emission at grid celliof speciesj from sectork. This sensitivity linearly approximates the contri-bution to the cost function of the emission in locationi, of speciesj, from sectork. While the adjoint model computes sensitivities with respect to all emissions (e.g., SO2, VOCs,
etc.), here we focus our analysis on sensitivities with respect to emissions of NH3and NOxfrom anthropogenic and nat-ural sources, which are the largest. Sensitivity calculations are performed monthly, including a 1-week spin-up for each month to capture the influence of emissions from the end of the previous month.
3 Results
3.1 Evaluation of simulated Nr deposition
Figure 2 shows the spatial distribution of total, reduced, and oxidized annual Nr deposition in the contiguous US in 2010 calculated with GEOS-Chem. Total Nr deposition consists of all chemical species included in the cost function, re-duced Nr deposition is the sum of wet and dry deposition of NH3and NH+4, and oxidized Nr deposition is total minus
re-duced. Total Nr deposition ranges from 2 to 5 kg N ha−1yr−1 in the West, except in some parts of California where it is >12 kg N ha−1yr−1, and from 6 to 20 kg N ha−1yr−1in the East. Annual total Nr deposition over the contiguous US is 5.6 Tg N (3.2 oxidized, 2.4 reduced). Oxidized Nr is higher than reduced Nr overall, while reduced Nr is higher in mid-California, Iowa, and eastern North Carolina.
The spatial distribution of reduced and oxidized Nr depo-sition is comparable with other studies (Zhang et al., 2012; Du et al., 2014; Schwede and Lear, 2014) yet a few dif-ferences and uncertainties are worth considering. Du et al. (2014) found greater wet deposition of NH+4 compared to wet deposition of NO−3 over the contiguous US except in the Northeast region. The larger fraction of reduced wet Nr de-position in their work may be related to the year being ana-lyzed (increased NH3and decreased NOxemissions in their study period of 2011–2012 compared to ours in 2010) and to the overestimation of HNO3in our study that is discussed
below.
Zhang et al. (2012), using the same model we use but with the different emissions, found that wet and dry HNO3
depo-sition is overestimated compared to observations when the model’s isoprene nitrate is treated as HNO3, as in our
sim-ulation, rather than being treated separately as organic ni-trate. Further, comparison of modeled to measured HNO3
Figure 2.GEOS-Chem modeled Nr deposition in 2010. Select Class I areas for case studies are indicated by initials. Inset number is the annual contiguous US total Nr deposition.
VY SM SD BB
RM GT JT SQ
R2=0.97 R2=0.86 R2=0.61 R2=0.95
R2=0.65 R2=0.96 R2=0.29 R2=0.98 0
0.5 1.0 1.5 2.0
0 0.5 1.0 1.5
kg N/ha/mon
th
MAM JJA SON DJF MAM JJA SON DJF MAM JJA SON DJF MAM JJA SON DJF
Figure 3.Seasonal variation of Nr deposition in select Class I ar-eas. Model values (open red diamond) correspond to only those species that are measured (closed black circle). Cost function values
(Jp, open blue diamond) also include dry deposition of NH3, NO2,
PANs, alkyl nitrate, and N2O5. Bars indicate standard deviation of
monthly averages in the season.R2 is squared correlation
coeffi-cient for measured and modeled seasonal deposition. Dotted lines are for annual CLs divided by 12 in each site. MAM: March April May, JJA: June July August, SON: September October November, DJF: December January February.
sub-grid concentration gradients near the surface. Simulated ambient HNO3concentrations are also overestimated (Heald
et al., 2012), possibly owing to excessive N2O5hydrolysis.
This suggests that oxidized Nr may be overestimated in our study. Schwede and Lear (2014) generated maps of Nr depo-sition for multiple years, including 2010. These maps display localized hotspots in parts of Colorado and Idaho that are not evident in our results. The high Nr deposition in these regions is attributed to dry deposition of reduced nitrogen (Schwede and Lear, 2014), whereas in our result the contri-bution of reduced nitrogen deposition is generally less than that of oxidized nitrogen deposition (Fig. 2), possibly owing to the aforementioned overestimation of HNO3.
For the eight selected Class I areas, we compare sea-sonal average values from measurements provided by
NADP/NTN and CASTNET versus GEOS-Chem model estimates (Fig. 3). Total modeled Nr deposition in each Class I area (Jp, which includes non-measured species)
is also plotted in Fig. 3 as blue diamonds to show the role of non-measured species. Seasonal averages are cal-culated from monthly values. Measured Nr corresponds to the sum of modeled wet deposition of NH3, NH+4, HNO3,
and NO−3, and dry deposition of NH+4, NO−3, and HNO3.
The squared correlation coefficient (R2) of measured and modeled Nr is shown in each plot. For SQ, R2 is calcu-lated with spring, fall, and winter data. The model well re-produces the seasonality of measurements (R2>0.6) ex-cept at JT. For all sites, measurements and model esti-mates have maximum values in the summer. Seasonally av-eraged measured Nr range from 0 to 0.6 kg N ha−1month−1 (monthly value 0 to 1.3 kg N ha−1month−1), modeled Nr range from 0.0 to 1.2 kg N ha−1month−1(monthly value 0 to 1.3 kg N ha−1month−1) andJp(modeled Nr including
non-measured species) range from 0.1 to 1.3 kg N ha−1month−1 (monthly value 0 to 1.4 kg N ha−1month−1). Modeled Nr de-position is also higher than the measured Nr in the spring and summer in SM and SD, likely owing to overestimated HNO3as discussed above. Additionally, our model grid-cell
size (∼3350 km2) is larger than the largest Class I area (BB, 2866 km2). Representational error may thus also contribute to the discrepancy between the model and the measurement for regions with large emissions within grid cells containing the Class I area (e.g., SM and SD). Lastly, comparison to dry deposition measurements warrants some additional consid-erations. The MLM model used for deriving the CASTNET dry deposition values is subject to uncertainty in estimating dry deposition velocities (Schwede et al., 2011) because of a height-dependent non-physical component that can lead to an overestimation of HNO3deposition by 10–30 % (Saylor
et al., 2014). Additionally, Hicks (2006) found that measure-ments of HNO3 dry deposition in a clearing, such as the
VY SM SD
HNO3-wet
BB
NO3-wet NH3-wet
NH4-wet
HNO3-dry
NO3-dry
NH3-dry
NH4-dry Others
RM GT JT SQ
MAM JJA SON DJF MAM JJA SON DJF MAM JJA SON DJF MAM JJA SON DJF
0 0.5 1.0 1.5
0 0.5 1.0
kg N / ha / mon
th
Figure 4.Stacked bar of modeled seasonal Nr deposition showing
speciation. Others includes dry deposition of NO2, PANs, alkyl
ni-trate, and N2O5. Blueish: oxidized N, reddish: reduced N, dark: wet
deposition, light: dry deposition.
areas (such as SM, SD, RM, GT, and SQ, see Fig. 1) is likely underestimated.
Annual modeled Nr deposition in each Class I area (Jp)
ranges from 2.2 to 10.7 kg N ha−1yr−1, and is highest in SD and SM and lowest in BB. The dotted lines in Fig. 3 show the annual CLs from Ellis et al. (2013) divided by 12. Class I areas considered to be in CL exceedance on an annual basis based on simulated values are VY, SM, SD, RM, GT, and SQ and those in exceedance based on measurement are VY, SM, SD, RM, and SQ. Within California, annual Nr deposition in SQ is about 70 % larger than that in JT. This is influenced by the position of these parks relative to large upwind anthro-pogenic sources, as well as different vegetation types of the two parks (Fig. 1). JT is 80 % desert where very low Nr de-position is expected; in contrast, SQ has narrow conifers and mediterranean scrub. The lowest annual Nr deposition in BB is explained, in part, by the large fraction of desert (60 %) and succulent and thorn scrub (18 %); it is also far from large anthropogenic sources.
Figure 4 shows the model speciation ofJp. Non-measured
species are dry deposition of NO2, PANs, alkyl nitrate, N2O5
(lumped as others in Fig. 4) and dry NH3. Non-measured
species account for 0.5 % (winter, SM) to 55.6 % (summer, SQ) of seasonally averagedJpvalues in the model. Dry
de-position of NH3 accounts for 14 % of contiguous US total
annual Nr deposition. The summer maximum ofJpis mainly
driven by wet deposition of HNO3(VY, SM, SD, BB, RM)
and dry deposition of HNO3(VY, GT, JT, SQ). Dry
deposi-tion of NH3 is a major contributor in SQ. Organics (PANs
and alkyl nitrate) make only a small contribution (<5 %) to Nr deposition in the model. While it is known that organics account for∼30 % of total Nr deposition (Neff et al., 2002; Cornell, 2011), we expect organics to be underestimated in
our model because only dry deposition is included for these species and isoprene nitrate is not explicitly treated (Zhang et al., 2012).
3.2 Source attribution using GEOS-Chem adjoint 3.2.1 Spatial and sectoral footprints of Nr deposition
The sensitivity of total annual Nr deposition (Jp) to
emis-sion sources is calculated by the GEOS-Chem adjoint model. The results can be understood as the contribution of emis-sions in each grid cell to the Nr deposition in each Class I area. Figure 5 shows spatial distributions of the sensitivities of Nr deposition to NOxand NH3emissions – the so called
source footprint (Eq. 5) – for each region. Inset numbers are the annual Nr deposition in each area from all sources (Jp).
Pie charts show the relative contributions to this value from specific emission sectors (sectors contributing<1 % are not shown).
The source attribution results show significant variability in terms of the sectors contributing to Nr deposition in dif-ferent Class I areas. Livestock NH3and surface source NOx, i.e., mobile sources, are the major sources of Nr deposition, contributing more than 65 % to SM, SD, RM, GT, JT, and SQ. Livestock NH3 contributions are largest for SQ (54 %)
and smallest for BB (15 %). Mobile NOxis the major emis-sion source for JT (63 %), SM (40 %) and SD (38 %). Fertil-izer NH3is the third most important source of Nr deposition
for VY (14 %), GT (11 %), and SQ (8 %). In contrast to the other sites, for BB the contribution of natural sources of Nr (the sum of natural NH3, lightning and soil NOx equal to 47 %) is comparable to that of anthropogenic contributions. NOx from EGUs is the third most important source for RM (12 %) and SD (9 %). Lightning is a considerable source not only for BB but for SM (9 %). Aircraft emissions have a no-ticeable impact only for JT (2 %).
The results of the adjoint sensitivity calculations show that the spatial footprint of emissions affecting different Class I regions can vary by several hundred kilometers. Even though NOx and NH3, by themselves, have very short lifetimes
BB (x4) 2.2 kg N/ha/yr
RM (x2) 4.0 kg N/ha/yr GT (x3) 3.3 kg N/ha/yr
JT (x3) 3.2 kg N/ha/yr SQ (x2) 5.7 kg N/ha/yr
NH3(ls) NH3(fe) NH3(na) NOx(sf ) NOx(eg) NOx(ne) NOx(ac) NOx(li) NOx(so)
[kg N/ha/yr]
SM 10.4 kg N/ha/yr
VY (x2) 4.8 kg N/ha/yr SD 10.7 kg/N/ha/yr
Figure 5.Annual-averaged monthly footprint (χ) of Nr deposition in each Class I area and pie chart of fractional contribution from emission sectors. ls: livestock, fe: fertilizer, na: natural, sf: surface inventory, eg: electric generating units, ne: non-eg industrial stacks, ac: aircraft, li:
lightning, so: soil. Inset numbers are cost function (Jp), annual Nr deposition in each Class I area. Site locations are shown with open circles.
Footprint values are scaled for visibility with numbers in parenthesis.
for SD, while the rest are from more distant regions spread across∼1100 km. For RM and GT, there is a jump in the cu-mulative distribution around 1200 km which is due to sources in California. Steep initial rises for JT and SQ correspond to the influence of local urban centers (Los Angeles and San Francisco, respectively).
Additional analysis was performed for RM, given the prevalence of studies on Nr deposition in this area (Benedict et al., 2013b; Malm et al., 2013; Thompson et al., 2015). Fig-ure 7 shows the source distributions of oxidized and reduced Nr deposition. Our results suggest that reduced Nr deposition originates primarily from east of the park, while in contrast a large fraction of oxidized Nr deposition originates from west
of that park. This is consistent with the spatial distributions of the emissions of NH3compared to those of NOx surround-ing the park. The high sensitivity of reduced Nr to sources west of RM in California and Idaho agrees with other recent studies (Benedict et al., 2013b; Malm et al., 2013; Thompson et al., 2015).
3.2.2 Efficiency of emission impacts on Nr deposition For each Class I area, we also calculate non-normalized ad-joint sensitivities as defined in Eq. (4) using the cost function defined in Eq. (1). These provide estimates of the response of Nr deposition (Jp) in each park per kg emissions of NH3
0 2 4
0 4 8
0 4 8
0 2 4
0 2 4
0 2 4
2 4
2 4
VY SM
SD BB
RM GT
JT SQ
Distance [km]
C
umula
tiv
e N
r deposition [kg N/ha/yr]
50% 90%
0 500 1000 1500 2000 2500
0 500 1000 1500 2000 25000
0
Figure 6.Annual averaged monthly cumulative contribution as a function of distance from the site. Vertical lines are for 50 % (blue) and 90 % (red) of total Nr deposition. Note the change in scale of
theyaxis for SM and SD.
NH3(ls) NH3(fe) NH3(na) NOx(sf ) NOx(eg) NOx(ne) NOx(ac) NOx(li) NOx(so)
Reduced 1.4 Oxidizied 2.0
Figure 7.Same as Fig. 5 but for oxidized and reduce Nr deposition
in RM. Units for the pie charts and colorbar are kg N ha−1yr−1. The
sum of the oxidized and reduced Nr deposition is smaller than the inset number in Fig. 5 because the number here excludes Nr from “other species”.
of transport efficiency of each species, largely determined by meteorology and aerosol partitioning. Figure 8 shows a few select results with unique seasonal features in JJA and DJF.
In JT, there is a clear seasonal trend (Fig. 8a). Nr depo-sition in the park is impacted most efficiently by sources in the NW-SE direction during the summer and by sources in the NE-SW direction in the winter, due to changes in wind patterns. In RM, Nr deposition is owing to the sources from California during the summer, whereas the source footprints are much more localized during the winter (Fig. 8b). While stronger winds (≥6 m s−1) are actually more frequent in the winter, larger NH3emissions in the summer facilitate
forma-tion of NH4NO3 and thus long-range Nr transport. In SD,
NH3emissions make a positive contribution to Nr deposition
during the summer, while emissions north of the park con-tribute negatively during the winter (Fig. 8c). These negative sensitivities occur because NH4NO3formation is limited by
JT NH3
JT NH3
SD NH3
SD NH3 RM
NOx
RM NOx
SD SO2 SD
SO2
-5.0 -2.5 0 2.5 5.0 [10-8 J/kg N][10-9 J/kg S]
(a)
(b)
(c)
JJA DJF
Wind speeds [m/s] 10%
20% 30%
10% 20%
30% 10%
20% 30% 4%
8% 12%
16%
Figure 8.Efficiencies of impacts on Nr deposition showing cost
function (Jp) change per kg N or kg S emission for the tracer and
season indicated in the plot.(a)Joshua Tree,(b)Rocky Mountain,
(c)Shenandoah national parks. Wind-roses for each site show
frac-tion of wind frequencies based on daily surface winds during the season.
NH3 in the winter in SD. In these conditions, emissions of
NH3 promote formation of NH4NO3. Since NH4NO3 has
a longer lifetime in the atmosphere than gas-phase NH3 or
HNO3, formation of NH4NO3causes Nr to be transported
further away, and thus less Nr deposits in the park. Thus, the deposition of Nr in the park has a negative sensitivity with respect to NH3 emissions. This tradeoff is also manifested
by SO2 emissions having positive sensitivities during
win-ter and negative sensitivities during summer. In NH3limited
conditions (winter), increased SO2 emissions would tie up
NH3as aerosol(NH4)2SO4or NH4HSO4, leaving less NH3
available to form NH4NO3.
3.2.3 Analysis of all Class I areas in critical load exceedance
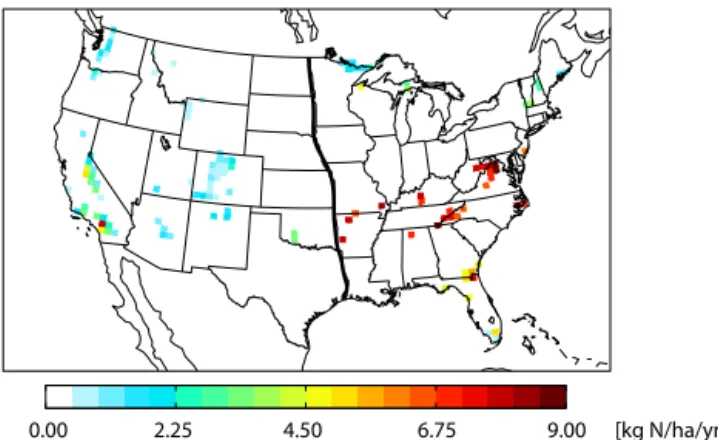
0.00 2.25 4.50 6.75 9.00 [kg N/ha/yr]
Figure 9. CL exceedance in Class I areas; color indicates magni-tude of exceedance. The size of Class I areas is not reflected. Grid cells containing Class I areas are shown as colored regardless of the fraction of Class I areas. Bold line divides Western and Eastern US.
area of the regions is not reflected in this map; it are shown as filled cells if the fraction that the region occupies in the cell is greater than zero (although fractional grid cell areas, βi, are considered in the model simulations themselves). The West/East contrast is clear. The number of cells in CL ex-ceedance is larger in the West while the magnitude of the CL exceedance is larger in the East. This is not surprising con-sidering the spatial distribution of Nr deposition (Fig. 2) and Class I areas. Among the 149 Class I areas in the contigu-ous US only 38 are located in the East. Figure 10a shows the sensitivity ofJa to NOx and NH3emissions. This
sensitiv-ity indicates the regions where reducing emission will result in the largest decrease in the extent of Class I areas in CL exceedance. Figure 10b is the sensitivity ofJcto emissions.
This sensitivity shows the sources that are causing the largest values of Nr deposition, relative to the CLs (i.e., excessive or severe values).
Comparison of the two types of sensitivity analysis sug-gests how different emission control strategies might be con-sidered to meet different objectives. Decreasing Nr emissions in California and regions surrounding RM and SM would be useful for reducing both the extent of Class I areas in CL ex-ceedance (Fig. 10a) and the amount of excessive Nr in Class I areas (Fig. 10b).
Nr originating from Idaho, Utah, Washington, and Arizona contribute more to reduce the extent of Class I areas in CL exceedance but less to the amount of excessive Nr in Class I areas, as the Nr deposition in these regions is not as exces-sive as it is in other regions, as shown in Fig. 9. Reducing Nr emissions from the tip of Florida would reduce the area of re-gions in CL exceedance, while reductions to emissions in this area are not as beneficial for avoiding excessively high depo-sition, as this region has the highest CL (5 kg N ha−1yr−1) of those considered here. For reduction of excessive Nr above the CL, sources with the largest impact are located in the East (i.e., Tennessee, Alabama, and Georgia) and the San Joaquin
[kg N/ha/yr] [kg N/ha/yr]2
Ja = 3.6 [kg N/ha/yr] (x2 shown)
NH3(ls) NH3(fe) NH3(na) NOx(sf ) NOx(eg) NOx(ne) NOx(ac) NOx(li) NOx(so)
Jc = 8.5 [kg N/ha/yr] 2
(a) (b)
Figure 10.Same figure as Fig. 5 but with different cost functions.
(a)Ja, the sum of Nr deposition in all Class I areas in CL
ex-ceedance,(b)Jc, the sum of square of the difference of annual Nr
deposition and CL in all Class I areas in CL exceedance.
Sensitivi-ties of(a)are scaled by×2 to share the colorbar with(b).
Valley in California. Interestingly, the distribution of contri-butions across sectors is similar for bothJaandJc; surface
NOxand livestock NH3are the major emission sectors
con-tributing to both the extent and severity of CL exceedances. 3.3 Uncertainty caused by NH3emissions
To evaluate the robustness of our source attribution analy-sis with respect to NH3emissions uncertainties we compare
our base case results using NEI2008 emissions to sensitiv-ity results using NEI2005 NH3 emissions optimized using
remote-sensing observations (Shephard et al., 2011) from Zhu et al. (2013). This is of interest not only because the magnitude of NH3 emissions may change the contribution
of NH3to Nr deposition, but also because Nr deposition is
sensitive to long-range transport of ammonium and nitrate aerosol and NH3abundance exerts a strong, nonlinear,
influ-ence on nitrate partitioning. As shown in Zhu et al. (2013), in the optimized NEI2005 the overall NH3emissions have
in-creased compared to the original NEI2005 inventory; emis-sions in California, the central US, and the Midwest are especially enhanced. Figure 11 shows the NH3 emissions
from the optimized NEI2005 and those used in this study, NEI2008. The NEI2008 inventory has even larger NH3
emis-sions over the Midwest compared to the optimized NEI2005 in all 3 months shown here. In July, NH3 emissions in the
central US (Kansas, Nebraska, eastern Colorado, and Texas) and Washington are higher with the optimized NEI2005.
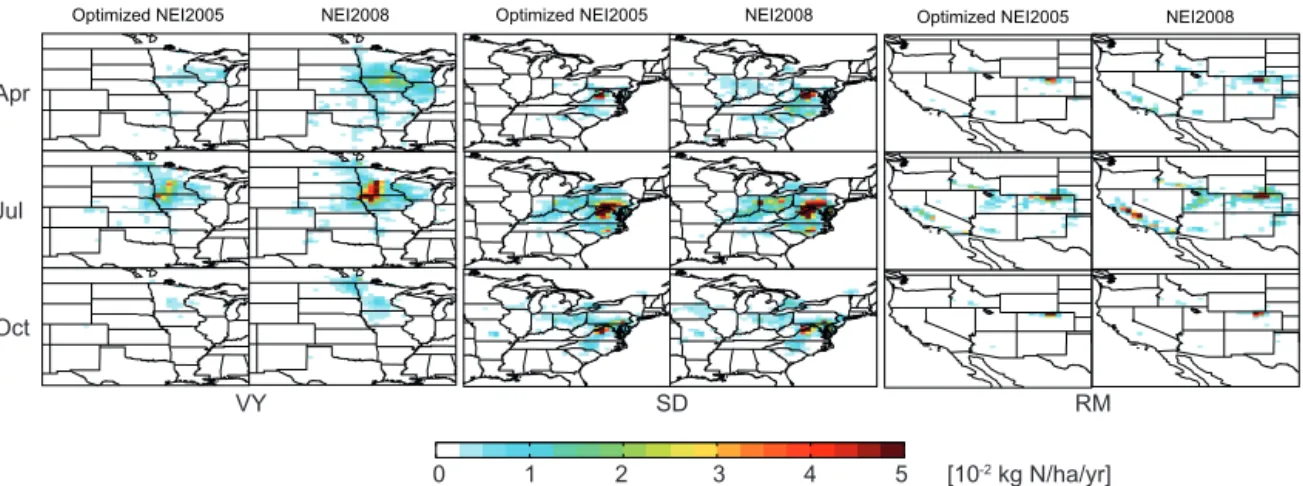
Case studies are performed for VY, SD, and RM, whose Nr deposition footprint (Fig. 5) includes regions showing noticeable differences between the two NH3 emission
in-ventories (Fig. 11). The non-normalized sensitivity,λi,j, re-mains constant with the changes in emissions but the semi-normalized sensitivity,χi,j,k, is perturbed by the differences inEi,j,k. Figure 12 shows the sensitivities ofJp(total
mod-eled Nr deposition in individual Class I areas) to NH3
emis-sions for these sites. Overall, when using NEI2008 the con-tribution of NH3emissions toJpis larger than when using
0 1.8 3.5 5.5 7.0 [105 kg]
Optimized NEI2005 NEI2008
April 284 Gg
July 598 Gg
October 245 Gg
432 Gg
542 Gg
275 Gg
Figure 11.Sum of NH3emissions from anthropogenic, natural, biomass burning, and biofuel sources. Inset numbers are contiguous US total
NH3emissions in each month.
Optimized NEI2005 NEI2008 Optimized NEI2005 NEI2008 Optimized NEI2005 NEI2008
Apr
Jul
Oct
VY SD RM
0 1 2 3 4 5 [10-2 kg N/ha/yr]
Figure 12.Map of sensitivities ofJpto NH3emissions for three selected Class I areas (VY, SD, and RM) for two different NH3emission inventories (optimized NEI2005 and default NEI2008) in each month.
in emissions between the two inventories in Minnesota and Iowa mainly contribute to changes in the sensitivities for Nr deposition in VY. The source footprint for VY site gradually
are ∼840 km away. SD is not affected much by different NH3inventories in July and October as up to 50 % of total Nr
deposition is owing to sources within 250 km (Fig. 6). How-ever, NEI2008 leads to broader estimates of the source foot-prints in April. Local influences become more pronounced for SD in the footprints estimated using the NEI2005 emis-sions. For the base case, Nr deposition was found to have significant long range influences for RM. However, when us-ing the optimized NEI2005 emissions, where NH3sources in
eastern Colorado are estimated to be much larger, the relative role of long-range influence from east of the park is reduced.
4 Discussion and conclusions
We used the GEOS-Chem CTM and its adjoint model for Nr deposition source attribution in Federal Class I ar-eas in the US. Among the eight selected Class I arar-eas, Voyageurs, Smoky Mountain, Shenandoah, Rocky Moun-tain, Grand Teton, and Sequoia are estimated to be in ex-ceedance of the most conservative estimates of CLs from Pardo et al. (2011). Modeled Nr deposition is compared with NADP/NTN (NADP, 2015) and CASTNET (CASTNET, 2014) measurements and other modeling studies (Zhang et al., 2012; Schwede and Lear, 2014). The seasonality of measured species is generally well represented by the model (R2>0.6), except in Joshua Tree. Modeled Nr de-position contains large contributions from wet HNO3
deposi-tion which is likely overestimated in the version of the model used here (Zhang et al., 2012), leading to overestimates of Nr deposition in Smoky Mountain and Shenandoah of up to 0.6 kg N ha−1month−1. Still, adequate model performance in other seasons and locations suggests a considerable contri-bution of dry deposition of NH3in some locations and
sea-sons, consistent with Schwede and Lear (2014). A significant fraction of Nr deposition in the central mountain region (in-cluding Rocky Mountain National Park) is estimated to be in the form of reduced nitrogen, similar to several other recent studies (Benedict et al., 2013b; Malm et al., 2013; Thompson et al., 2015), although such estimates are sensitive to model uncertainties in NH3emissions and modeled NO−3.
The spatial and sectoral distribution of annual Nr depo-sition sources are investigated using the adjoint of GEOS-Chem. Quantifying the contribution of local versus long-range transport and the contribution of different sectors to Nr deposition may serve as a guide for devising locally tai-lored strategies to reduce Nr deposition in different Class I ar-eas. NH3emissions from livestock and NOxemissions from mobile sources are the major sectors that contribute to Nr deposition in all selected Class I areas, except Big Bend where natural sources contribute comparably with anthro-pogenic sources. Nr deposition in Joshua Tree and Sequoia, both located in California, tends to originate from local (< 700 km) sources, whereas Nr deposition in the mountain re-gions (Grand Teton and Rocky Mountain) are∼50 % from
nearby sources (<400 km) and the rest from sources as far away as California (∼1300 km). For other parks (Voyageurs, Smoky Mountain, Shenandoah, and Big Bend), sources are broadly distributed radially. Overall, these results suggest that mitigating Nr deposition in many specific areas may re-quire substantial consideration of interstate transport.
The efficiency of emissions to impact Nr deposition is evaluated at the per-kg emission level for NH3-N, NOx-N, and SO2-S. This result represents the response of Nr
deposi-tion to addideposi-tional emissions, which is useful for consideradeposi-tion of the impact of future emission. As it is expected (e.g., El-lis et al., 2013) that NH3 emissions will increase and NOx emissions will decrease in the US in the coming decades, the formation of ammonium nitrate will increasingly be lim-ited by NOx. This will cause the sensitivities of deposition that contains considerable contributions from ammonium ni-trate, such as Voyageurs and Grand Teton national parks, to be increasingly sensitive to perturbations in NOxemissions, even though NH3 emissions will make larger contributions
to total Nr deposition. In Joshua Tree, NH3 emission
effi-ciencies show distinct seasonality in terms of their locations. The NW-SE impact is strongest in summer and the NE-SW impact is dominant in winter. In Rocky Mountain, effective regions, where emissions from the region would contribute to more than∼ ±1.0×10⁻⁸kg N ha−1yr−1per kg N emis-sion or∼ ±1.0×10⁻⁹kg N ha−1yr−1per kg S emission, are broader in the summer even though stronger winds are more frequent in the winter (Fig. 8), owing to larger NH3sources
in the summer. In Shenandoah, NH3emissions to the north of
the park inhibit Nr deposition in the park during the winter. This response is interesting, and explainable from considera-tion of aerosol particonsidera-tioning and transport, although the abso-lute significance is not that large owing to the small levels of deposition here in the winter.
Sources of Nr deposition in all Class I areas in CL exceedance throughout the US are studied using two ap-proaches: emissions contributing to the extent of the total area of Class I areas that are in CL exceedance (Ja) and
emissions contributing to the magnitude of the excessive Nr deposition above CLs (Jc). Our result suggests that one of
the largest source regions contributing to the spatial extent of Class I regions in CL exceedance is California. On the other hand, Nr sources in the Eastern US, i.e., Tennessee, Alabama, and Georgia, in addition to California, contribute the most to excessive Nr above the CL in Class I areas. Thus, strategies for reducing the spatial extent of ecological damage from ex-cessive Nr deposition may differ from those aimed at reduc-ing its severity.
Lastly, case studies are performed for Voyageurs, Shenan-doah, and Rocky Mountain national parks using different NH3 emission inventories, which have large uncertainties,
in order to evaluate how sensitive our source footprint es-timates are to underlying model emissions. We adopted NH3
inventory, which has greater NH3emissions in the Midwest
and California. Difference in semi-normalized sensitivity is most apparent in April and July. Differences of NH3
emis-sions in Minnesota and Iowa are mainly reflected in the source footprint for Voyageurs. Estimated local influences become more important for Shenandoah when using the op-timized NEI2005 inventory. For Rocky Mountain, when us-ing the optimized NEI2005 emissions, NH3sources in
east-ern Colorado are estimated to be much larger, but the role of long-range influences is reduced.
Overall, the results presented here provide useful informa-tion for considering how emissions control strategies both re-gionally and nationally may impact Nr deposition in Federal Class I areas. Future work may strive to apply such meth-ods to higher resolution models, as model resolution may impact the ability to resolve fine-scale features delineating specific sources or areas of influence and complex topogra-phy in Class I areas. In addition, considering the role of bi-directional NH3exchange (e.g., Zhu et al., 2015), which can
effectively extend the source footprint owing to reemission of NH3 from NH3 rich soils, would be of interest. Lastly,
as source attribution estimates for Nr deposition are intrinsi-cally sensitive to uncertainties in the balance of emissions be-tween NH3and NOx, even if the total nitrogen emissions are correct, further effort should be made to improve knowledge of the distributions and trends in NH3and NOxemissions.
Acknowledgements. We acknowledge support from the NASA Air
Quality Applied Sciences Team, grant NNX11AI54G and NSF grant ANT 1244958.
Edited by: R. Cohen
References
Bash, J. O., Cooter, E. J., Dennis, R. L., Walker, J. T., and Pleim, J. E.: Evaluation of a regional air-quality model with bidirectional
NH3 exchange coupled to an agroecosystem model,
Biogeo-sciences, 10, 1635–1645, doi:10.5194/bg-10-1635-2013, 2013. Benedict, K. B., Chen, X., Sullivan, A. P., Li, Y., Day, D.,
Prenni, A. J., Levin, E. J. T., Kreidenweis, S. M., Malm, W. C., Schichtel, B. A., and Collett, J. L.: Atmospheric con-centrations and deposition of reactive nitrogen in Grand Teton National Park, J. Geophys. Res.-Atmos., 118, 11875–11887, doi:10.1002/2013JD020394, 2013a.
Benedict, K. B., Day, D., Schwandner, F. M., Kreidenweis, S. M., Schichtel, B., Malm, W. C., and Collett Jr., J. L.: Observations of atmospheric reactive nitrogen species in Rocky Mountain Na-tional Park and across northern Colorado, Atmos. Environ., 64, 66–76, doi:10.1016/j.atmosenv.2012.08.066, 2013b.
Bey, I., Jacob, D. J., Yantosca, R. M., Logan, J. A., Field, B. D., Fiore, A. M., Li, Q., Liu, H. Y., Mickley, L. J., and Schultz, M. G.: Global modeling of tropospheric chemistry with as-similated meteorology: Model description and evaluation, J.
Geophys. Res., 106, 23073–23095, doi:10.1029/2001JD000807, 2001.
Bobbink, R., Hicks, K., Galloway, J., Spranger, T., Alkemade, R., Ashmore, M., Bustamante, M., Cinderby, S., Davidson, E., Den-tener, F., Emmett, B., Erisman, J.-W., Fenn, M., Gilliam, F., Nordin, A., Pardo, L., and De Vries, W.: Global assessment of nitrogen deposition effects on terrestrial plant diversity: a syn-thesis, Ecol. Appl., 20, 30–59, doi:10.1890/08-1140.1, 2010. Bouwman, A. F., Lee, D. S., Asman, W. a. H., Dentener, F. J., Van
Der Hoek, K. W., and Olivier, J. G. J.: A global high-resolution emission inventory for ammonia, Global Biogeochem. Cy., 11, 561–587, doi:10.1029/97GB02266, 1997.
Bowman, W. D., Murgel, J., Blett, T., and Porter, E.: Nitro-gen critical loads for alpine vegetation and soils in Rocky Mountain National Park, J. Environ. Manage., 103, 165–171, doi:10.1016/j.jenvman.2012.03.002, 2012.
CASTNET: U.S. Environmental Protection Agency Clean Air Mar-kets Division Clean Air Status and Trends Network (CASTNET) Data table accessed (NH4, NO3, HNO3 Weekly Dry Deposi-tion), available at: www.epa.gov/castnet, last access: 9 November 2014.
Chen, D., Wang, Y., McElroy, M. B., He, K., Yantosca, R. M., and Le Sager, P.: Regional CO pollution and export in China simu-lated by the high-resolution nested-grid GEOS-Chem model, At-mos. Chem. Phys., 9, 3825–3839, doi:10.5194/acp-9-3825-2009, 2009.
Clark, C. M., Morefield, P. E., Gilliam, F. S., and Pardo, L. H.: Es-timated losses of plant biodiversity in the United States from historical N deposition (1985–2010), Ecology, 94, 1441–1448, doi:10.1890/12-2016.1, 2013.
Cooter, E. J., Bash, J. O., Walker, J. T., Jones, M. R., and Robarge, W.: Estimation of NH3 bi-directional flux from managed agricultural soils, Atmos. Environ., 44, 2107–2115, doi:10.1016/j.atmosenv.2010.02.044, 2010.
Cornell, S. E.: Atmospheric nitrogen deposition: Revisiting the question of the importance of the organic component, Envi-ron. Pollut., 159, 2214–2222, doi:10.1016/j.envpol.2010.11.014, 2011.
Du, E., Vries, W. D., Galloway, J. N., Hu, X., and Fang, J.: Changes in wet nitrogen deposition in the United States between 1985 and 2012, Environ. Res. Lett., 9, 095004, doi:10.1088/1748-9326/9/9/095004, 2014.
Duce, R. A., LaRoche, J., Altieri, K., Arrigo, K. R., Baker, A. R., Capone, D. G., Cornell, S., Dentener, F., Galloway, J., Ganeshram, R. S., Geider, R. J., Jickells, T., Kuypers, M. M., Langlois, R., Liss, P. S., Liu, S. M., Middelburg, J. J., Moore, C. M., Nickovic, S., Oschlies, A., Pedersen, T., Prospero, J., Schlitzer, R., Seitzinger, S., Sorensen, L. L., Uematsu, M., Ulloa, O., Voss, M., Ward, B., and Zamora, L.: Impacts of Atmospheric Anthropogenic Nitrogen on the Open Ocean, Science, 320, 893– 897, doi:10.1126/science.1150369, 2008.
Ellis, R. A., Jacob, D. J., Sulprizio, M. P., Zhang, L., Holmes, C. D., Schichtel, B. A., Blett, T., Porter, E., Pardo, L. H., and Lynch, J. A.: Present and future nitrogen deposition to national parks in the United States: critical load exceedances, Atmos. Chem. Phys., 13, 9083–9095, doi:10.5194/acp-13-9083-2013, 2013.
Ecological Effects of Nitrogen Deposition in the Western United States, BioScience, 53, 404–420, doi:10.1641/0006-3568(2003)053[0404:EEONDI]2.0.CO;2, 2003.
Fenn, M. E., Allen, E. B., Weiss, S. B., Jovan, S., Geiser, L. H., Tonnesen, G. S., Johnson, R. F., Rao, L. E., Gimeno, B. S., Yuan, F., Meixner, T., and Bytnerowicz, A.: Nitro-gen critical loads and management alternatives for N-impacted ecosystems in California, J. Environ. Manage., 91, 2404–2423, doi:10.1016/j.jenvman.2010.07.034, 2010.
Galloway, J. N., Aber, J. D., Erisman, J. W., Seitzinger, S. P., Howarth, R. W., Cowling, E. B., and Cosby, B. J.: The ni-trogen cascade, BioScience, 53, 341–356, doi:10.1641/0006-3568(2003)053[0341:TNC]2.0.CO;2, 2003.
Gilliland, A. B., Dennis, R. L., Roselle, S. J., and Pierce, T. E.: Seasonal NH3 emission estimates for the eastern United States based on ammonium wet concentrations and an inverse modeling method, J. Geophys. Res., 108, 4477, doi:10.1029/2002JD003063, 2003.
Gilliland, A. B., Wyat Appel, K., Pinder, R. W., and Dennis, R. L.: Seasonal NH3 emissions for the continental united states: Inverse model estimation and evaluation, Atmos. Environ., 40, 4986– 4998, doi:10.1016/j.atmosenv.2005.12.066, 2006.
Gruber, N. and Galloway, J. N.: An Earth-system perspec-tive of the global nitrogen cycle, Nature, 451, 293–296, doi:10.1038/nature06592, 2008.
Heald, C. L., Collett Jr., J. L., Lee, T., Benedict, K. B., Schwandner, F. M., Li, Y., Clarisse, L., Hurtmans, D. R., Van Damme, M., Clerbaux, C., Coheur, P.-F., Philip, S., Martin, R. V., and Pye, H. O. T.: Atmospheric ammonia and particulate inorganic nitrogen over the United States, Atmos. Chem. Phys., 12, 10295–10312, doi:10.5194/acp-12-10295-2012, 2012.
Henze, D. K., Hakami, A., and Seinfeld, J. H.: Development of the adjoint of GEOS-Chem, Atmos. Chem. Phys., 7, 2413–2433, doi:10.5194/acp-7-2413-2007, 2007.
Henze, D. K., Seinfeld, J. H., and Shindell, D. T.: Inverse
model-ing and mappmodel-ing US air quality influences of inorganic PM2.5
precursor emissions using the adjoint of GEOS-Chem, At-mos. Chem. Phys., 9, 5877–5903, doi:10.5194/acp-9-5877-2009, 2009.
Hicks, B. B.: Dry deposition to forests – On the use of data from clearings, Agric. Forest Meteorol., 136, 214–221, doi:10.1016/j.agrformet.2004.06.013, 2006.
Hudman, R. C., Jacob, D. J., Turquety, S., Leibensperger, E. M., Murray, L. T., Wu, S., Gilliland, A. B., Avery, M., Bertram, T. H., Brune, W., Cohen, R. C., Dibb, J. E., Flocke, F. M., Fried, A., Holloway, J., Neuman, J. A., Orville, R., Perring, A., Ren, X., Sachse, G. W., Singh, H. B., Swanson, A., and Wooldridge, P. J.: Surface and lightning sources of nitrogen oxides over the United States: Magnitudes, chemical evolution, and outflow, J. Geophys. Res., 112, D12S05, doi:10.1029/2006JD007912, 2007. Kean, A. J., Littlejohn, D., Ban-Weiss, G. A., Harley, R. A.,
Kirch-stetter, T. W., and Lunden, M. M.: Trends in on-road vehi-cle emissions of ammonia, Atmos. Environ., 43, 1565–1570, doi:10.1016/j.atmosenv.2008.09.085, 2009.
Kopacz, M., Jacob, D. J., Henze, D. K., Heald, C. L., Streets, D. G., and Zhang, Q.: Comparison of adjoint and ana-lytical Bayesian inversion methods for constraining Asian sources of carbon monoxide using satellite (MOPITT)
mea-surements of CO columns, J. Geophys. Res., 114, D04305, doi:10.1029/2007JD009264, 2009.
Lapina, K., Henze, D. K., Milford, J. B., Huang, M., Lin, M., Fiore, A. M., Carmichael, G., Pfister, G. G., and Bowman, K.: As-sessment of source contributions to seasonal vegetative exposure to ozone in the U.S., J. Geophys. Res.-Atmos., 119, 324–340, doi:10.1002/2013JD020905, 2014.
Lee, H.-M., Henze, D. K., Alexander, B., and Murray, L. T.: In-vestigating the sensitivity of surface-level nitrate seasonality in Antarctica to primary sources using a global model, Atmos. En-viron., 89, 757–767, doi:10.1016/j.atmosenv.2014.03.003, 2014. Liu, H., Jacob, D. J., Bey, I., and Yantosca, R. M.: Constraints from 210Pb and 7Be on wet deposition and transport in a global three-dimensional chemical tracer model driven by assimilated mete-orological fields, J. Geophys. Res.-Atmos., 106, 12109–12128, doi:10.1029/2000JD900839, 2001.
Malm, W. C., Schichtel, B. A., Barna, M. G., Gebhart, K. A., Ro-driguez, M. A., Jr, J. L. C., Carrico, C. M., Benedict, K. B., Prenni, A. J., and Kreidenweis, S. M.: Aerosol species con-centrations and source apportionment of ammonia at Rocky Mountain National Park, J. Air Waste Manage., 63, 1245–1263, doi:10.1080/10962247.2013.804466, 2013.
Mu, M., Randerson, J. T., van der Werf, G. R., Giglio, L., Kasib-hatla, P., Morton, D., Collatz, G. J., DeFries, R. S., Hyer, E. J., Prins, E. M., Griffith, D. W. T., Wunch, D., Toon, G. C., Sher-lock, V., and Wennberg, P. O.: Daily and 3-hourly variability in global fire emissions and consequences for atmospheric model predictions of carbon monoxide, J. Geophys. Res., 116, D24303, doi:10.1029/2011JD016245, 2011.
Murray, L. T., Jacob, D. J., Logan, J. A., Hudman, R. C., and Koshak, W. J.: Optimized regional and interannual variability of lightning in a global chemical transport model constrained by LIS/OTD satellite data, J. Geophys. Res., 117, D20307, doi:10.1029/2012JD017934, 2012.
NADP: National Atmospheric Deposition Program (NRSP-3), NADP Program Office, Illinois State Water Survey, 2204 Grif-fith Dr., Champaign, IL 61820, 2015.
Neff, J. C., Holland, E. A., Dentener, F. J., McDowell, W. H., and Russell, K. M.: The origin, composition and rates of organic ni-trogen deposition: A missing piece of the nini-trogen cycle?, Bio-geochemistry, 57–58, 99–136, doi:10.1023/A:1015791622742, 2002.
Nemitz, E., Milford, C., and Sutton, M. A.: A two-layer canopy compensation point model for describing bi-directional biosphere-atmosphere exchange of ammonia, Q. J. Roy. Meteo-rol. Soc., 127, 815–833, doi:10.1002/qj.49712757306, 2001. Nilsson, J.: Critical Loads for Sulphur and Nitrogen, in: Air
Pollu-tion and Ecosystems, edited by: Mathy, P., p. 85–91, Springer Netherlands, available at: http://link.springer.com/chapter/10. 1007/978-94-009-4003-1_11% (last access: 1 September 2014), 1988.
Olson, J. S.: Digital raster data on a 10 minute geographic 1080
×2160 grid in Global Ecosystems Database, version 1.0, Disc
A, edited by: NOAA Natl. Geophys. Data Center, Boulder, Col-orado, 1992.
Perakis, S. S., Robin-Abbott, M. J., Stoddard, J. L., Weathers, K. C., and Dennis, R. L.: Effects of nitrogen deposition and em-pirical nitrogen critical loads for ecoregions of the United States, Ecol. Appl., 21, 3049–3082, doi:10.1890/10-2341.1, 2011. Park, R. J., Jacob, D. J., Field, B. D., Yantosca, R. M.,
and Chin, M.: Natural and transboundary pollution influ-ences on sulfate-nitrate-ammonium aerosols in the United States: Implications for policy, J. Geophys. Res., 109, D15204, doi:10.1029/2003JD004473, 2004.
Paulot, F., Jacob, D. J., and Henze, D. K.: Sources and processes contributing to nitrogen deposition: an adjoint model analysis ap-plied to biodiversity hotspots worldwide, Environ. Sci. Technol., 47, 3226–3233, doi:10.1021/es3027727, 2013.
Paulot, F., Jacob, D. J., Pinder, R. W., Bash, J. O., Travis, K., and Henze, D. K.: Ammonia emissions in the United States, Eu-ropean Union, and China derived by high-resolution inversion of ammonium wet deposition data: Interpretation with a new agricultural emissions inventory (MASAGE_NH3), J. Geophys. Res.-Atmos., 119, 4343–4364, doi:10.1002/2013JD021130, 2014.
Pleim, J. E., Bash, J. O., Walker, J. T., and Cooter, E. J.: Develop-ment and evaluation of an ammonia bidirectional flux parame-terization for air quality models, J. Geophys. Res.-Atmos., 118, 3794–3806, doi:10.1002/jgrd.50262, 2013.
Reay, D. S., Dentener, F., Smith, P., Grace, J., and Feely, R. A.: Global nitrogen deposition and carbon sinks, Nature Geosci., 1, 430–437, doi:10.1038/ngeo230, 2008.
Sala, O. E., Chapin, F. S., Iii, Armesto, J. J., Berlow, E., Bloomfield, J., Dirzo, R., Huber-Sanwald, E., Huenneke, L. F., Jackson, R. B., Kinzig, A., Leemans, R., Lodge, D. M., Mooney, H. A., Oester-held, M., Poff, N. L., Sykes, M. T., Walker, B. H., Walker, M., and Wall, D. H.: Global biodiversity scenarios for the year 2100, Science, 287, 1770–1774, doi:10.1126/science.287.5459.1770, 2000.
Saylor, R. D., Wolfe, G. M., Meyers, T. P., and Hicks, B. B.: A cor-rected formulation of the Multilayer Model (MLM) for inferring gaseous dry deposition to vegetated surfaces, Atmos. Environ., 92, 141–145, doi:10.1016/j.atmosenv.2014.03.056, 2014. Schwede, D. B. and Lear, G. G.: A novel hybrid approach for
es-timating total deposition in the United States, Atmos. Environ., 92, 207–220, doi:10.1016/j.atmosenv.2014.04.008, 2014. Schwede, D., Zhang, L., Vet, R., and Lear, G.: An
intercom-parison of the deposition models used in the CASTNET and CAPMoN networks, Atmos. Environ., 45, 1337–1346, doi:10.1016/j.atmosenv.2010.11.050, 2011.
Shephard, M. W., Cady-Pereira, K. E., Luo, M., Henze, D. K., Pin-der, R. W., Walker, J. T., Rinsland, C. P., Bash, J. O., Zhu, L., Payne, V. H., and Clarisse, L.: TES ammonia retrieval strat-egy and global observations of the spatial and seasonal vari-ability of ammonia, Atmos. Chem. Phys., 11, 10743–10763, doi:10.5194/acp-11-10743-2011, 2011.
Stevens, C. J., Dise, N. B., Mountford, J. O., and Gowing, D. J.: Im-pact of nitrogen deposition on the species richness of grasslands, Science, 303, 1876–1879, doi:10.1126/science.1094678, 2004. Sullivan, T. J., Cosby, B. J., Tonnessen, K. A., and Clow, D. W.:
Surface water acidification responses and critical loads of sulfur and nitrogen deposition in Loch Vale watershed, Colorado, Water Resour. Res., 41, W01021, doi:10.1029/2004WR003414, 2005.
Sutton, M. A., Nemitz, E., Erisman, J. W., Beier, C., Bahl, K. B., Cellier, P., de Vries, W., Cotrufo, F., Skiba, U., Di Marco, C., Jones, S., Laville, P., Soussana, J. F., Loubet, B., Twigg, M., Famulari, D., Whitehead, J., Gallagher, M. W., Neftel, A., Flechard, C. R., Herrmann, B., Calanca, P. L., Schjoerring, J. K., Daemmgen, U., Horvath, L., Tang, Y. S., Emmett, B. A., Ti-etema, A., Peñuelas, J., Kesik, M., Brueggemann, N., Pilegaard, K., Vesala, T., Campbell, C. L., Olesen, J. E., Dragosits, U., Theobald, M. R., Levy, P., Mobbs, D. C., Milne, R., Viovy, N., Vuichard, N., Smith, J. U., Smith, P., Bergamaschi, P., Fowler, D., and Reis, S.: Challenges in quantifying biosphere–atmosphere exchange of nitrogen species, Environ. Pollut., 150, 125–139, doi:10.1016/j.envpol.2007.04.014, 2007.
Thompson, T. M., Rodriguez, M. A., Barna, M. G., Gebhart, K. A., Hand, J. L., Day, D. E., Malm, W. C., Benedict, K. B., Col-lett, J. L., and Schichtel, B. A.: Rocky Mountain National Park reduced nitrogen source apportionment: RMNP NITROGEN SOURCE APPORTIONMENT, J. Geophys. Res.-Atmos., 120, 4370–4384, doi:10.1002/2014JD022675, 2015.
UBA: Manual on methodologies and criteria for mapping crit-ical levels/loads and geographcrit-ical areas where they are exceeded, Federal Environmental Agency (UmweltBunde-sAmt), available at: http://www.rivm.nl/en/themasites/icpmm/ manual-and-downloads/m%anual-english/index.html (last ac-cess: 19 May 2015), 2004.
van der Werf, G. R., Randerson, J. T., Giglio, L., Collatz, G. J., Mu, M., Kasibhatla, P. S., Morton, D. C., DeFries, R. S., Jin, Y., and van Leeuwen, T. T.: Global fire emissions and the contribution of deforestation, savanna, forest, agricultural, and peat fires (1997– 2009), Atmos. Chem. Phys., 10, 11707–11735, doi:10.5194/acp-10-11707-2010, 2010.
Vitousek, P. M., Aber, J. D., Howarth, R. W., Likens, G. E., Mat-son, P. A., Schindler, D. W., Schlesinger, W. H., and Tilman, D. G.: Human alteration of the global nitrogen cycle: sources and consequences, Ecol. Appl., 7, 737–750, doi:10.1890/1051-0761(1997)007[0737:HAOTGN]2.0.CO;2, 1997.
Vries, W. D., Wamelink, G. W. W., Dobben, H. v., Kros, J., Reinds, G. J., Mol-Dijkstra, J. P., Smart, S. M., Evans, C. D., Rowe, E. C., Belyazid, S., Sverdrup, H. U., Hinsberg, A. v., Posch, M., Hettel-ingh, J.-P., Spranger, T., and Bobbink, R.: Use of dynamic soil– vegetation models to assess impacts of nitrogen deposition on plant species composition: an overview, Ecol. Appl., 20, 60–79, doi:10.1890/08-1019.1, 2010.
Walker, T. W., Jones, D. B. A., Parrington, M., Henze, D. K., Mur-ray, L. T., Bottenheim, J. W., Anlauf, K., Worden, J. R., Bowman, K. W., Shim, C., Singh, K., Kopacz, M., Tarasick, D. W., Davies, J., Gathen, P. v. d., Thompson, A. M., and Carouge, C. C.: Im-pacts of midlatitude precursor emissions and local photochem-istry on ozone abundances in the Arctic, J. Geophys. Res., 117, D01305, doi:10.1029/2011JD016370, 2012.
Wang, Y., Jacob, D. J., and Logan, J. A.: Global simulation of
tro-pospheric O3-NOx-hydrocarbon chemistry 3. Origin of
tropo-spheric ozone and effects of nonmethane hydrocarbons, J. Geo-phys. Res., 103, 10757–10767, doi:10.1029/98JD00156, 1998. Wang, Y. X., McElroy, M. B., Jacob, D. J., and Yantosca,
Wecht, K. J., Jacob, D. J., Wofsy, S. C., Kort, E. A., Worden, J. R., Kulawik, S. S., Henze, D. K., Kopacz, M., and Payne, V. H.: Val-idation of TES methane with HIPPO aircraft observations: impli-cations for inverse modeling of methane sources, Atmos. Chem. Phys., 12, 1823–1832, doi:10.5194/acp-12-1823-2012, 2012. Wesely, M.: Parameterization of surface resistances to gaseous dry
deposition in regional-scale numerical models, Atmos. Envi-ron. (1967), 23, 1293–1304, doi:10.1016/0004-6981(89)90153-4, 1989.
Yienger, J. J. and Levy, H.: Empirical model of global soil-biogenic NOx emissions, J. Geophys. Res., 100, 11447–11464, doi:10.1029/95JD00370, 1995.
Zhang, L., Jacob, D. J., Downey, N. V., Wood, D. A., Blewitt, D., Carouge, C. C., van Donkelaar, A., Jones, D. B. A., Mur-ray, L. T., and Wang, Y.: Improved estimate of the policy-relevant background ozone in the United States using the
GEOS-Chem global model with 1/2◦–2/3◦ horizontal
resolu-tion over North America, Atmos. Environ., 45, 6769–6776, doi:10.1016/j.atmosenv.2011.07.054, 2011.
Zhang, L., Jacob, D. J., Knipping, E. M., Kumar, N., Munger, J. W., Carouge, C. C., van Donkelaar, A., Wang, Y. X., and Chen, D.: Nitrogen deposition to the United States: distribution, sources, and processes, Atmos. Chem. Phys., 12, 4539–4554, doi:10.5194/acp-12-4539-2012, 2012.
Zhu, L., Henze, D. K., Cady-Pereira, K. E., Shephard, M. W., Luo, M., Pinder, R. W., Bash, J. O., and Jeong, G.-R.: Constraining U.S. ammonia emissions using TES remote sensing observations and the GEOS-Chem adjoint model, J. Geophys. Res.-Atmos., 118, 3355–3368, doi:10.1002/jgrd.50166, 2013.