Effect of Protein Kinase C delta (PKC-
) Inhibition on the
Transcriptome of Normal and Systemic Sclerosis Human
Dermal Fibroblasts
In Vitro
Peter J. Wermuth1, Sankar Addya2, Sergio A. Jimenez1*
1Jefferson Institute of Molecular Medicine, Thomas Jefferson University, Philadelphia, Pennsylvania, United States of America,2Kimmel Cancer Center, Department of Cancer Biology, Jefferson Medical College, Thomas Jefferson University, Philadelphia, Pennsylvania, United States of America
Abstract
Previous studies demonstrated that protein kinase C-d(PKC-d) inhibition with the selective inhibitor, rottlerin, resulted in potent downregulation of type I collagen expression and production in normal human dermal fibroblasts and abrogated the exaggerated type I collagen production and expression in fibroblasts cultured from affected skin from patients with the fibrosing disorder systemic sclerosis (SSc). To elucidate the mechanisms involved in the ability of PKC-dto regulate collagen production in fibroblasts, we examined the effects of PKC-dinhibition on the transcriptome of normal and SSc human dermal fibroblasts. Normal and SSc human dermal fibroblasts were incubated with rottlerin (5mM), and their gene expression was analyzed by microarrays. Pathway analysis and gene ontology analysis of differentially expressed genes in each comparison were performed. Identification of significantly overrepresented transcriptional regulatory elements (TREs) was performed using the Promoter Analysis and Interaction Network Toolset (PAINT) program. PKC-dactivity was also inhibited using RNA interference (siRNA) and by treating fibroblasts with a specific PKC-dinhibitory cell permeable peptide. Differential gene expression of 20 genes was confirmed using real time PCR. PKC-dinhibition caused a profound change in the transcriptome of normal and SSc human dermal fibroblastsin vitro. Pathway and gene ontology analysis identified multiple cellular and organismal pathways affected by PKC-dinhibition. Furthermore, both pathway and PAINT analyses indicated that the transcription factor NFkB played an important role in the transcriptome changes induced by PKC-d
inhibition. Multiple genes involved in the degradation of the extracellular matrix components were significantly reduced in SSc fibroblasts and their expression was increased by PKC-dinhibition. These results indicate that isoform-specific inhibition of PKC-dprofibrotic effects may represent a novel therapeutic approach for SSc and other fibrotic diseases.
Citation:Wermuth PJ, Addya S, Jimenez SA (2011) Effect of Protein Kinase C delta (PKC-d) Inhibition on the Transcriptome of Normal and Systemic Sclerosis Human Dermal FibroblastsIn Vitro. PLoS ONE 6(11): e27110. doi:10.1371/journal.pone.0027110
Editor:Carol Feghali-Bostwick, University of Pittsburgh, United States of America
ReceivedAugust 25, 2011;AcceptedOctober 10, 2011;PublishedNovember 11, 2011
Copyright:ß2011 Wermuth et al. This is an open-access article distributed under the terms of the Creative Commons Attribution License, which permits unrestricted use, distribution, and reproduction in any medium, provided the original author and source are credited.
Funding:This work was supported by National Institutes of Health (NIH) grant RO1 AR-019616 to SAJ. PJW was supported by National Institute of Arthritis and Musculoskeletal and Skin Diseases (NIAMS) Training Grant T-32 AR007583-15. The funders had no role in study design, data collection and analysis, decision to publish, or preparation of the manuscript.
Competing Interests:The authors have declared that no competing interests exist. * E-mail: [email protected]
Introduction
The family of protein kinase C (PKC) serine/threonine kinases can be divided into three subclasses based on their distinctive structural and functional characteristics. The three subclasses of PKC are the conventional PKCs (cPKC;a,bI,bII, andc), the novel PKC isoforms (nPKC;d,e,g, andh), and the atypical PKC isoforms (aPKCs;fandi/lin human/mouse) [1–7] The cPKCs are diacylglycerol (DAG) sensitive and Ca2+
responsive, whereas the nPKCs are DAG sensitive but Ca2+
unresponsive, and the aPKCs are insensitive to both DAG and Ca2+
.
PKC-d influences a wide variety of cellular functions, most prominently, cellular growth and proliferation [8–9]. PKC-d also participates in the initiation, progression and maintenance of inflamma-tory processes inducing NFkB activation, increased levels of intracellular adhesion molecule 1 (ICAM1), increased neutrophil adhesion, as well as, stimulation of the expression of cellular inhibitor of apoptosis (cIAP) protein family members and of proinflammatory mediators [10–12].
Numerous studies have shown that PKC-d modulates the expression of collagen genes and increased PKC-d has been
associated with the development of pathologic tissue fibrosis [13– 16]. For example, increased levels of PKC-dhave been reported in dermal fibroblasts from affected skin cultured from individuals afflicted with the fibrosing disorder systemic sclerosis or sclero-derma (SSc) [13]. Furthermore, PKC-dactivation is necessary to mediate the stimulatory effect of Connective Tissue Growth Factor (CTGF) in cooperation with insulin/insulin growth factor 1 (IGF1) on collagen synthesis in SSc fibroblasts [14]. PKC-dhas also been shown to interact with components of the TGF-b signaling pathway. Other studies have shown that TGF-bactivates PKC-d
which in turn positively regulates Smad3 transcriptional activity resulting in increased transcription of COL1A2 and fibronectin [17,18].
type III collagens in these fibroblasts [13]. In order to further analyze the mechanisms responsible, we examined the effects of PKC-dinhibition with rottlerin on the transcriptome of normal and SSc-derived human dermal fibroblasts. These studies identified the transcription factor NFkB as a crucial participant in one of the most affected gene networks modulated by PKC-d, an observation confirmed by an analysis of transcription factor binding sites demonstrating that the binding site for NFkB occurs at a significantly greater frequency in the differentially regulated genes than would be predicted by chance. We also found numerous genes that are involved in the regulation of synthesis or in the degradation of collagen and other extracellular matrix components to be differentially expressed in normal and SSc fibroblasts and modulated in response to PKC-d inhibition, confirming the previous suggestions that PKC-d plays an important role in the pathogenesis of tissue fibrosis in SSc and other fibrosing disorders [13].
Materials and Methods
Fibroblast cultures
Normal and SSc human dermal fibroblast cell lines were obtained from the Scleroderma Center Tissue Bank, Thomas Jefferson University. The SSc cell lines studied had been established from full-thickness skin biopsies obtained from 3 patients with SSc of recent onset (,18 months from the first appearance of clinically detectable skin induration). Cell lines obtained from 3 normal subjects were used as normal controls. The skin biopsy specimens from the SSc patients were obtained from the leading edge of the lesion on the forearms. The Institutional Review Board of Thomas Jefferson University approved the use of the tissues remaining after the diagnostic histopathologic studies forin vitroanalyses. Since only discarded tissue was used, the IRB declared this study to be exempt and therefore neither written nor oral consent was required.
All SSc patients satisfied the criteria for classification of SSc and had the diffuse cutaneous clinical subset of the disease as defined by LeRoyet al[20]. Fibroblasts were expanded as described previously [13] from the frozen stocks and were used at passages 4–10.
Treatment of cultured dermal fibroblasts with rottlerin
Normal and SSc human dermal fibroblasts were cultured in DMEM containing 10% FBS (Life Technologies Inc., Grand Island, New York, USA), 1% vitamins, 2 mM glutamine, antibiotics, and fungizone in 100 mm plates until confluent, then preincubated for 24 h with 40mg/ml ascorbic acid phosphate magnesium salt n-hydrate (Sigma-Aldrich, St. Louis, MO) to optimize collagen production. Fibroblasts were then incubated for 24 h in fresh media supplemented with 40mg/ml ascorbic acid and a final concentration of 5mM rottlerin (Biomol Research Laboratories Inc., Plymouth Meeting, PA), a concentration previously demonstrated to induce maximal effects in human dermal fibroblasts without causing cellular toxicity [13].
RNA Interference
Normal and SSc human dermal fibroblasts were cultured in 6 well plates until confluent. Transfection of 10 nM short interfering RNA (siRNA) directed against PKC-dwas performed using the HiPerFect reagent (Qiagen, Valencia CA) according to the manufacturer’s protocol. At 24 h after siRNA transfection, fibroblasts were incubated for 24 h with 40mg/ml ascorbic acid phosphate magnesium salt n-hydrate (Sigma-Aldrich, St. Louis, MO) to optimize collagen production. The siRNA target sequences were: PKC-d - AACTCTACCGTGCCACGTTT; Control – CCGGGACACTATATTCCAGAA.
Treatment of cultured dermal fibroblasts with a PKC-d cell permeable peptide inhibitor
Normal and SSc human dermal fibroblasts were cultured as previously described in 6 well plates until confluent. Cultures were then incubated for 24 h with 10mM of a control peptide or with 10mM of a cell permeable inhibitory peptide specific for PKC-d (Mimotopes Pty Ltd, Clayton Victoria, AU). Fresh media were added and fibroblasts were then incubated for 24 h with a second 10mM aliquot of peptide and with 40mg/ml ascorbic acid phosphate magnesium salt n-hydrate (Sigma-Aldrich, St. Louis, MO) to optimize collagen production. The control peptide consists of a dimer of the TAT protein transduction domain (PTD) [21] and its sequence was: TAT Control – RRRQRRKKRGYC-CYGRKKRRQRRR. The PKC-dpeptide sequence is the same described in Chen et al., and consists of the N-terminal portion of the C2 domain (aa2-10) of PKC-dfused to the TAT peptide [22] and its sequence was: PKD-TAT – RRRQRRKKRGYCCSFN-SYELGSL.
Microarray analysis
Following exposure to rottlerin, DNA-free total RNA was isolated utilizing the RNeasy micro kit (Qiagen, Valencia, CA), according to the manufacturer’s protocol. DNase-treated total RNA was ethanol precipitated and quantified on a NanoDrop ND-1000 spectrophotometer and RNA quality was analyzed on an Agilent 2100 bioanalyser (Agilent Technologies, Palo Alto, CA). Double-stranded cDNA was synthesized using T7 Oligo dT (Integrated DNA Technologies, Coralville, IA) and Superscript II double-stranded cDNA Kit (Invitrogen, Carlsbad, CA). Biotiny-lated cRNA was prepared using the BioArray High Yield RNA Transcript Labeling Kit (Enzo Diagnostics, Farmingdale, NY). The labeled cRNA was fragmented by heat and ion-mediated hydrolysis and was hybridized to the Human Genome HU133A oligonucleotide array GeneChip (Affymetrix) which contains ,500,000 spots comprised of 22,283 different probe sets representing 14,397 unique genes. The arrays were washed and stained using a GeneChip Fluidic Station 450 (Affymetrix), and hybridization signals were amplified utilizing antibody amplifica-tion with goat IgG (Sigma-Aldrich, Saint Louis, MO) and anti-streptavidin biotinylated antibody (Vector Laboratories, Burlin-game, CA) and then were scanned using an Affymetrix GeneChip Scanner 3000, using GeneChip Operating Software (GCOS) version 3.0. Background correction and normalization were done using a Robust Multichip Average (RMA) with Genespring V 10.0 software (Agilent Technologies, Santa Clara, CA). Volcano plots were used to identify differentially expressed genes using the parametric testing assuming equal variances (based on the results of a Student’s two-sample t-test for two groups).
Four different comparisons were performed: normal untreated fibroblasts versus normal fibroblasts treated with rottlerin, SSc untreated fibroblasts versus rottlerin treated SSc fibroblasts, normal untreated fibroblasts versus SSc untreated fibroblasts, and normal fibroblasts treated with rottlerin versus rottlerin treated SSc fibroblasts. The list of differentially expressed genes for each comparison was loaded into Ingenuity Pathway Analysis (IPA) 5.0 software (www.ingenuity.com) to perform biological network and functional analyses.
Transcriptional regulatory network analysis
database for Homo sapiens, version 49, cross referenced with Unigene build#213 [23,24]. This encompasses 32,559 promoter sequences in the Ensembl database cross-referenced to 19,423 promoter sequences in the Unigene database. Promoter analysis for putative transcriptional regulatory elements (TREs) which serve as binding sites for known transcription factors was performed employing the MATCH algorithm which scores potential matches based on the degree of similarity of a putative binding site to known binding sites using known binding site sequences contained in the TRANSFAC public database version 6.0. This analysis allows for the identification of common upstream transcription factor binding sequences in a list of genes and compares the prevalence of sequences within the set to that expected to be found by chance in a given list of TREs. PAINT analysis is a function of upstream sequence information and is independent of gene expression levels.
Each group of genes from the microarray analysis categories was tested for significantly overrepresented TREs against the entire set of genes in the Human Genome U133 Plus 2.0 array, which represent the global set of TREs affected by the experimental conditions. The default settings of the parameters of the program were utilized in the analysis. Statistical significance for TRE overrepresentation was set at p,0.05 with additional filtering performed by setting the false discovery rate (FDR) at 0.3. Identification of statistically significant enrichment of a specific TRE within a particular expression cluster indicates a role for the cognate transcription factor in the coordinate regulation of genes in that cluster.
Validation of microarray results utilizing RT-PCR
A selected subset of differentially expressed genes was chosen for independent verification by SYBR Green-based, real-time RT-PCR (Applied Biosystems, Foster City, CA) following a standard amplification protocol on an ABI Prism 7900 Sequence Detection System (Applied Biosystems) usingb-actin as an internal reference standard. Primer pairs (Integrated DNA Technologies, Coralville, IA) for representative genes from the analyzed data are listed in
Table S1. Relative quantification was assessed by arbitrarily setting the expression level of the saline negative control at 100 and by expressing changes in transcript levels of other samples relative to this control sample. Relative differences in each PCR sample were corrected using human b-actin mRNA as an endogenous control. Real-time PCR values reflect the mean and standard deviation of triplicate samples. The statistical significance of the real-time PCR data was assessed by Student’s two-tailed t test.Pvalues less than 0.05 were considered significant.
Accession Numbers
The entire dataset discussed in this paper is compliant to the Minimum Information About a Microarray Experiment (MIAME) criteria and has been deposited at Gene Expression Omnibus (http://www.ncbi.nlm.nih.gov/geo/query/acc.cgi?acc=GSE23741) under accession number GSE23741 (platform ID: GPL570; dataset IDs: GSM585874-GSM585885).
Results
Global gene expression of cultured normal and SSc dermal fibroblasts induced by PKC-d inhibition
Transcriptome profiling was performed employing microarray analysis on total RNA isolated from untreated and rottlerin-exposed human dermal fibroblasts derived from normal skin biopsies or from biopsies of affected skin from patients with diffuse SSc. Following normalization of hybridization intensities using the
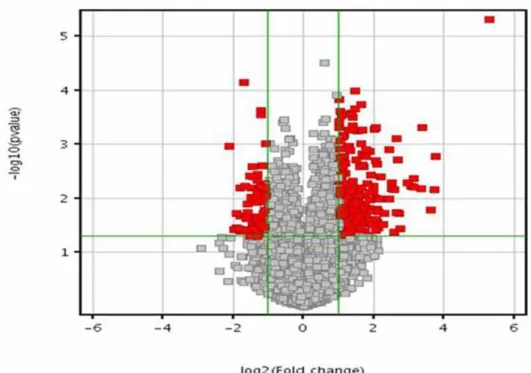
RMA (Robust Multichip Array) algorithm in the Genespring 7.3.1 software, the average expression level for each gene was calculated from biological duplicates. The values were plotted in a Volcano plot analyzing expression patterns in untreated normal fibroblasts versus rottlerin treated normal fibroblasts in Figure 1a and in untreated SSc fibroblasts versus rottlerin treated SSc fibroblasts in
Figure 1b using the –log10[p-value] and –log2[fold change].
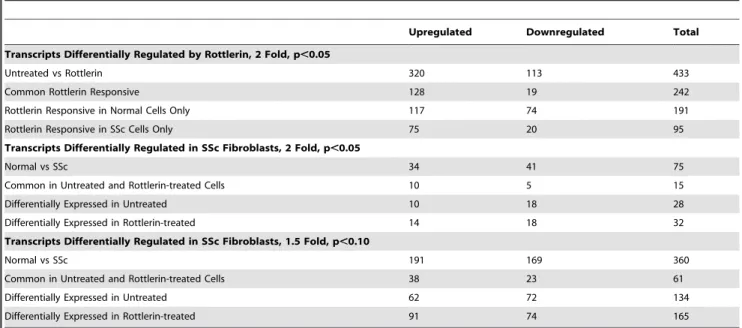
These assessments allowed filtering of the differentially expressed genes at a particular p-value. In order to discover specific patterns hierarchical clustering (Pearson correlation) was applied to the expression profiles of the total group of differentially expressed transcripts (Figure 2). A summary of the number of differentially expressed transcripts is depicted inTable 1.
Exposure of normal and SSc fibroblasts to rottlerin induced changes of 2 fold or greater in the expression level of a total of 433 gene transcripts at a significance level of p,0.05, of which 320 were upregulated and 113 were downregulated. The upregulation of nearly 3 times more genes than those that are downregulated indicate that PKC-d functions primarily as a transcriptional repressor in human dermal fibroblasts. Interestingly, the response of the transcriptome to rottlerin exposure differed dramatically depending upon the origin of the dermal fibroblasts. Of the differentially regulated transcripts, the expression levels of a total of 147 (128 upregulated and 19 downregulated) were changed in both normal and SSc cultured dermal fibroblasts. However, a total of 192 transcripts (117 upregulated and 75 downregulated) were expressed differentially only in fibroblasts derived from normal donors whereas expression levels changed for a total of 95 transcripts (75 upregulated and 20 downregulated) only in fibroblasts derived from SSc donors. A partial list of the most upregulated transcripts is displayed inTable 2and a partial list of the most downregulated transcripts is displayed inTable 3.
Biological network and functional analysis of transcripts differentially regulated by rottlerin
Figure 1. Volcano plot of differentially expressed transcripts.(A) Normal untreated vs normal rottlerin-treated fibroblasts. (B) SSc untreated vs SSc rottlerin-treated fibroblasts. A volcano plot of genes differentially expressed in human dermal fibroblasts exposed to rottlerin. The X-axis represents the log2values of the fold change observed for each transcript whereas the Y axis depicts the log10values of the p value of the
generated for the untreated normal vs. rottlerin treated normal comparison is displayed in Table 4 and the list of networks generated for the comparison between untreated SSc and rottlerin treated SSc is displayed inTable 5.
The functional pathway analysis demonstrated that PKC-d
inhibition affected the transcriptional levels of genes from diverse pathways that are involved in a variety of pathological conditions,
such as: cancer, inflammatory, gastrointestinal, reproductive, cardiovascular and hematological diseases. As reported in numerous studies, PKC-dinhibition differentially regulated genes involved in diverse cellular functions including cell death, cell cycle control, growth and differentiation, amino acid metabolism, small molecule biosynthesis, cell to cell signaling and interaction, as well as, cellular movement [8–12]. Numerous genes involved in Figure 2. Heat map and dendrogram of differentially expressed transcripts. GeneSpring analysis of normal and SSc human dermal fibroblasts exposed to rottlerin. RNA was isolated from replicate samples of normal human dermal fibroblasts incubated under control conditions (NC) or cultured with 5mM rottlerin (NR), or from SSc derived human dermal fibroblasts under control conditions (SC) or cultured with 5mM rottlerin (SR), labeled and applied to Affymetrix human U133 2.0 Plus microarrays. Dendrograms are reflective of the genes with a differential expression of.2 fold in the two experimental conditions. In the dendrogram shown, a shorter arm indicates higher similarity, whereas a longer arm indicates lower similarity. Genes with significant expression (p,0.05) between untreated and rottlerin treated fibroblasts were hierarchically clustered by similarity in expression profile. The resulting heat map of the dendrogram tree reveals groups of genes with high (red) expression levels, low expression levels (blue) or background expression levels (yellow).
organismal development and tumor morphology were also regulated.
Targeting of PKC-dactivity using RNA interference and a PKC-d inhibitory cell-permeable peptide
Although nanomolar concentrations of rottlerin potently inhibit PKC-d activity, at higher concentratiions rottlerin can also suppress the activity of other kinases [25] and can also uncouple mitochondrial respiration from oxidative phosphorylation. To ensure that the observed effect of rottlerin on the transcriptome is due to its inhibition of PKC-d and is not the result of possible effects on other protein kinases or caused by rottlerin-induced mitochondrial uncoupling, PKCd activity was also targeted in fibroblasts via RNA interference and the use of a specific cell permeable PKC-dinhibitory peptide. Normal and SSc fibroblasts were transfected with control and PKC-dspecific siRNA or were cultured in media containing either a control peptide consisting of a dimer of the TAT protein transduction domain (PTD) [21] or with a PKC-d specific inhibitory peptide that targets the N-terminal C2 domain fused to a single TAT PTD [22]. The C2 domain of PKC isoenzymes is a region within the regulatory domain that mediates protein-protein interactions between individual PKC isozymes and their achoring proteins, receptors for activated C kinase (RACKs). The PKC-d -specific peptide binds to the specific RACKs, preventing PKC-dbinding, thereby disrupting the anchoring and functioning of PKC-d [26]. RNA from these experiments was utilized in validation of gene expression regulated by PKC-dinhibition. The effects of rottlerin, of RNA interference and of peptide-mediated PKC-dinhibition on the expression of PKC-din normal and SSc fibroblasts were evaluated by real time RT-PCR. The PKC-d specific siRNA induced an 84% decrease in PKC-d mRNA levels in normal fibroblasts and an 88% decrease in SSc cells (data not shown). The control siRNA had no appreciable effect on PKC-dexpression compared to the saline control. As expected, the PKC-dinhibitory peptide did not induce a change in PKC-dmRNA levels in either normal or SSc fibroblasts.
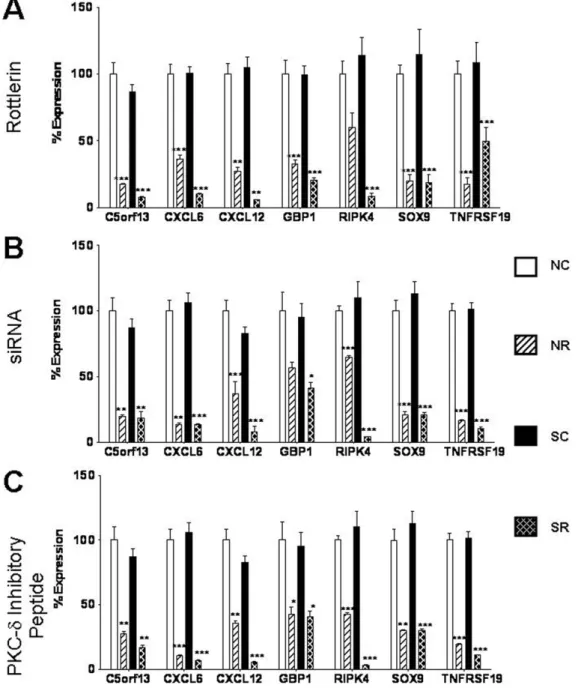
Validation of genes differentially expressed in response to PKC-d inhibition by real time RT-PCR
The relative expression levels of selected highly expressed genes and of genes from the two most significant networks obtained in the IPA analysis were confirmed by real time RT-PCR performed on RNA isolated from each of three sources: rottlerin-treated fibroblasts, siRNA-treated fibroblasts or peptide-treated fibro-blasts. The successful validation of a total of 12 genes is displayed inFigures 4 and 5. Seven genes that were downregulated in response to rottlerin were selected for validation. These were: chromosome 5 open reading frame 13 (c5orf13), chemokine CXC motif ligand 6 (CXCL6), chemokine CXCL12, interferon-inducible guanylate binding protein 1 (GBP1), receptor interacting serine/threonine kinase 4 (RIPK4), also known as PKC-d
interacting protein kinase (DIK) or ankyrin repeat domain-containing protein kinase 3 (ANKRD3); SRY-box 9 (SOX9) and tumor necrosis factor receptor superfamily, member 19 (TNFRSF19). Figure 4a displays the real time RT-PCR expression levels for these 7 downregulated genes in rottlerin treated fibroblasts, whereasFigure 4bdisplays expression levels for the same set of genes in siRNA-treated fibroblasts and
Figure 4c shows the expression of these genes in fibroblasts treated with the PKC-dinhibitory peptide. The control siRNA and the control peptide did not affect the expression levels of these genes compared to the saline control. All genes examined demonstrated the same consistent pattern of decreased expression in response to PKC-d inhibition that was observed in the microarray analysis.
Six genes that were upregulated in response to PKC-d
inhibition were also chosen for validation. These were, DNA damage inducible transcript 3/C/EBP homologous protein (DDIT3/CHOP), DNA damage inducible transcript 4/Regulated in development and DNA damage responses 1 (DDIT4/REDD1), growth/differentiation factor 15 (GDF15), pentraxin 3 (PTX3) thrombomodulin (THBD), and tribbles homolog 3 (TRIB3).
Figure 5adisplays the real time RT-PCR expression levels for these 6 upregulated genes in rottlerin treated fibroblasts, whereas
Table 1.Number of differentially expressed transcripts in control fibroblasts vs rottlerin exposed human dermal fibroblasts derived from normal or SSc patients at different statistical criteria using Volcano plot as a filter.
Upregulated Downregulated Total
Transcripts Differentially Regulated by Rottlerin, 2 Fold, p,0.05
Untreated vs Rottlerin 320 113 433
Common Rottlerin Responsive 128 19 242
Rottlerin Responsive in Normal Cells Only 117 74 191
Rottlerin Responsive in SSc Cells Only 75 20 95
Transcripts Differentially Regulated in SSc Fibroblasts, 2 Fold, p,0.05
Normal vs SSc 34 41 75
Common in Untreated and Rottlerin-treated Cells 10 5 15
Differentially Expressed in Untreated 10 18 28
Differentially Expressed in Rottlerin-treated 14 18 32
Transcripts Differentially Regulated in SSc Fibroblasts, 1.5 Fold, p,0.10
Normal vs SSc 191 169 360
Common in Untreated and Rottlerin-treated Cells 38 23 61
Differentially Expressed in Untreated 62 72 134
Differentially Expressed in Rottlerin-treated 91 74 165
Figure 5bdisplays expression levels for the same set of genes in siRNA-treated fibroblasts andFigure 5cshows the expression of these genes in fibroblasts treated with the PKC-d inhibitory peptide. The control siRNA and the control peptide did not affect the expression levels of these genes compared to the saline control. All genes examined displayed changes in expression in cells in which PKC-dwas inhibited by each of three methods consistent with those observed in the microarray analysis.
Genes differentially regulated in SSc-derived dermal fibroblasts
A similar analysis of differentially expressed transcripts between untreated normal fibroblasts versus untreated SSc-derived fibro-blasts (normal control vs. SSc control) and between rottlerin treated normal fibroblasts versus rottlerin treated SSc-derived fibroblasts (normal rottlerin vs. SSc rottlerin) yielded a total of 75 genes that displayed a 2 fold or greater difference in expression at a p-value of p,0.05 (Table 1). Since SSc is a complex disorder
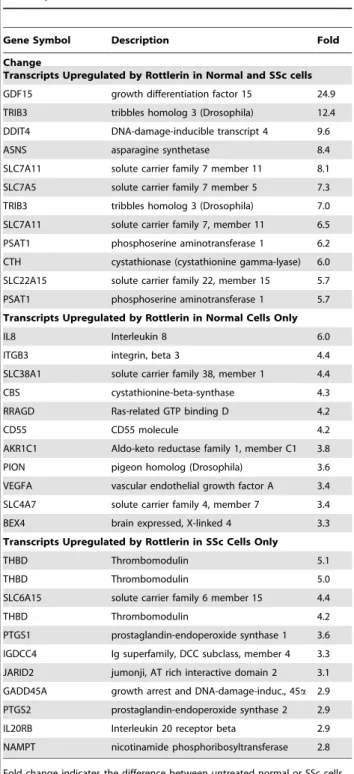
Table 2.Selected upregulated rottlerin responsive transcripts.
Gene Symbol Description Fold
Change
Transcripts Upregulated by Rottlerin in Normal and SSc cells
GDF15 growth differentiation factor 15 24.9
TRIB3 tribbles homolog 3 (Drosophila) 12.4 DDIT4 DNA-damage-inducible transcript 4 9.6
ASNS asparagine synthetase 8.4
SLC7A11 solute carrier family 7 member 11 8.1 SLC7A5 solute carrier family 7 member 5 7.3
TRIB3 tribbles homolog 3 (Drosophila) 7.0
SLC7A11 solute carrier family 7, member 11 6.5
PSAT1 phosphoserine aminotransferase 1 6.2 CTH cystathionase (cystathionine gamma-lyase) 6.0
SLC22A15 solute carrier family 22, member 15 5.7
PSAT1 phosphoserine aminotransferase 1 5.7
Transcripts Upregulated by Rottlerin in Normal Cells Only
IL8 Interleukin 8 6.0
ITGB3 integrin, beta 3 4.4
SLC38A1 solute carrier family 38, member 1 4.4
CBS cystathionine-beta-synthase 4.3
RRAGD Ras-related GTP binding D 4.2
CD55 CD55 molecule 4.2
AKR1C1 Aldo-keto reductase family 1, member C1 3.8
PION pigeon homolog (Drosophila) 3.6 VEGFA vascular endothelial growth factor A 3.4
SLC4A7 solute carrier family 4, member 7 3.4
BEX4 brain expressed, X-linked 4 3.3
Transcripts Upregulated by Rottlerin in SSc Cells Only
THBD Thrombomodulin 5.1
THBD Thrombomodulin 5.0
SLC6A15 solute carrier family 6 member 15 4.4
THBD Thrombomodulin 4.2
PTGS1 prostaglandin-endoperoxide synthase 1 3.6 IGDCC4 Ig superfamily, DCC subclass, member 4 3.3
JARID2 jumonji, AT rich interactive domain 2 3.1
GADD45A growth arrest and DNA-damage-induc., 45a 2.9 PTGS2 prostaglandin-endoperoxide synthase 2 2.9
IL20RB Interleukin 20 receptor beta 2.9
NAMPT nicotinamide phosphoribosyltransferase 2.8
Fold change indicates the difference between untreated normal or SSc cells compared to rottlerin treated normal or SSc cells. The entire dataset discussed in this paper is deposited at Gene Expression Omnibus (http://www.ncbi.nlm. nih.gov/geo/query/acc.cgi?acc=GSE23741) under accession number GSE23741. doi:10.1371/journal.pone.0027110.t002
Table 3.Selected downregulated rottlerin responsive transcripts.
Gene Symbol Description Fold Change
Transcripts Downregulated by Rottlerin in Normal and SSc cells
C5orf13 24.4
SOX9 SRY (sex determining region Y)-box 9 24.3
SOX9 SRY (sex determining region Y)-box 9 23.8 GBP1 Guanylate binding protein 1, IFN-inducible 23.0
GBP1 Guanylate binding protein 1, IFN-inducible 22.9
C5orf13 chromosome 5 open reading frame 13 22.6 CXCL12 chemokine (C-X-C motif) ligand 12 22.5
CARHSP1 calcium regulated heat stable protein 1 22.5
HUNK hormonally up-reg. Neu-associated kinase 22.4 METTL7A methyltransferase like 7A 22.4
TNFRSF19 TNF receptor superfamily, member 19 22.4
HELLS helicase, lymphoid-specific 22.4
Transcripts Downregulated by Rottlerin in Normal Cells Only
FAM65B family w/sequence similarity 65, memb.B 23.5
SHROOM3 shroom family member 3 23.2
23.1 ST6GALNAC5 Alpha-2,6 sialyltransferase 23.1
PSRC1 proline/serine-rich coiled-coil 1 23.1
SOCS2 suppressor of cytokine signaling 2 23.0 MYLIP myosin reg. light chain interacting protein 23.0
MRVI1 murine retrovirus integ. site 1 homolog 22.8
GNG2 guanine nucleotide binding protein,c2 22.8 MKI67 antigen identified by MAb Ki-67 22.8
C5orf13 chromosome 5 open reading frame 13 22.7
Transcripts Downregulated by Rottlerin in SSc Cells Only
CXCL6 chemokine (C-X-C motif) ligand 6 23.5
CLIC3 chloride intracellular channel 3 23.3
PHACTR3 phosphatase and actin regulator 3 23.1 DIRAS3 DIRAS family, GTP-binding RAS-like 3 23.1
FN1 fibronectin 1 22.6
MCM4 minichromosome maintenance complex 4 22.6 TEAD2 TEA domain family member 2 22.4
OLFML1 olfactomedin-like 1 22.4
MCM5 minichromosome maintenance complex 5 22.3 GINS4 GINS complex subunit 4 (Sld5 homolog) 22.3
RAB7B RAB7B, member RAS oncogene family 22.2
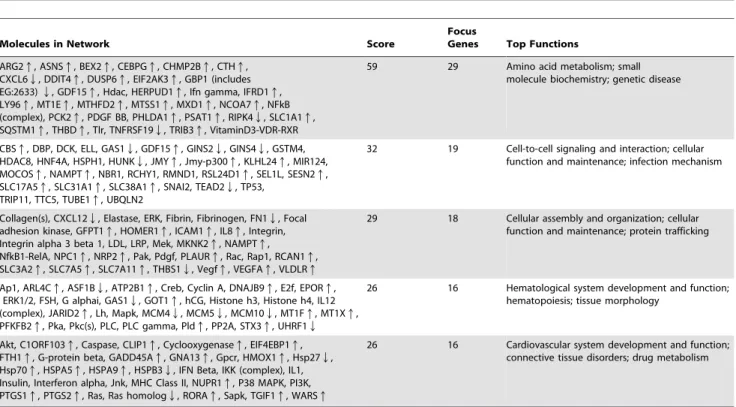
Table 4.Selected genetic networks with high scores (.26) in Normal Control vs Normal Rottlerin-exposed human dermal fibroblasts.
Molecules in Network Score Focus Genes Top Functions
ASNSq, ATF4q, BEX2q, CEBPGq, CTHq, DDIT4q, EIF2AK3q, GARSq, GBP2Q, GBP1Q, GDF15q, HERPUD1q, IFN-cq, IFNGR1q, IFRD1q, LY96q, MFHAS1q, MT1Eq, MTHFD2q, MTSS1q, NCOA7q, NFkB (comp), PCK2q, PDGF BB, PSAT1q, PSPHq, PTX3q, RND3q, RRN3q,
SHMT2q, TNFRSF19Q, TRIB3q, TXNRD1q, WARSq, XPOTq
64 32 Amino acid metabolism; small molecule biochemistry; carbohydrate metabolism
AKT, APC, BIRC5Q, C1ORF103q, C5ORF13Q, Caspase, CDC20Q, CDCA8Q, Cyclin A, Cyclin E, DHFRQ, E2f, FGF2q, GPNMBq, Hdac, Histone h3, Histone h4, HMMRQ,
Hsp27Q, Hsp70q, HSPB1Q, MCM5Q, MKI67Q, MT1Fq, MT1Gq, MXD1q, NUPR1q, NUSAP1Q, PTGS1q, Rb, Rsk, TGIF1q, TPX2Q, TYMSQ, VEGFAq
37 22 Cell cycle; cardiovascular system development
and function; organismal development
CARHSP1Q, CENPE, CHMP2B, COG5 (includes EG:10466)q, DSN1, ELK3, ERBB2, GTSE1Q, HSPA9q, JMYq, Jmy-p300q,
KIAA0101Q, MIS12, MKI67Q, MXD3Q, NBR1, NCAPD2, NCAPG (includes EG:64151)Q, NCAPH, NDC80Q, NUF2Q, POLG,
POLHQ, PSRC1Q, PXN, RPSA, SH2D5q, SLC19A2q, SPC24, SPC25Q, SQSTM1q, TACC3Q, TP53, TTC5, ZWINT (includes EG:11130)Q
29 19 Cell cycle; cellular assembly and organization; DNA replication, recombination and repair
ABCG8, ACOX1, ACSL1, ARG2, BAAT, BNC1q, CDCA2Q, DNMT3L, EXO1Q, FABP2, FAM65BQ, GPT2q, HDAC1, HNF4A, HUNKQ, MDH1, MOCOSq, NAGA, NDUFA1, NDUFV1, NRBF2q, NUCB1, PCK2q, PPP1CA, PSMA3, RSL24D1q, RXRA, SESN2q, SLC2A4, SLC38A1q, SLMO2q, SYTL2Q, TCF19Q, TUBE1q, UHRF1BP1q
26 17 Lipid metabolism; small molecule biochemistry; cardiovascular disease
ASB1q, BCAT1q, C9ORF72q, CARSq, CDCA3Q, CIDEC, EAF2q, EPRSq, GARSq, HSP90AA1, IARSq, IKBKG, Integrin alpha V beta 3q, KCNG1q, KDM5B, MARSq, NCAPH, NDRG4Q, NET1, NFIL3, NOD2, PA2G4, PIRq, PPAP2B, progesterone, PTGER4, RYR3, SAA1, SLC39A14q, SMYD3q, SRXN1q, TGFB1, TMEM14AQ, TNFSF11, ZFP36
26 17 Cellular growth and proliferation; embryonic development; reproductive system function and development
doi:10.1371/journal.pone.0027110.t004
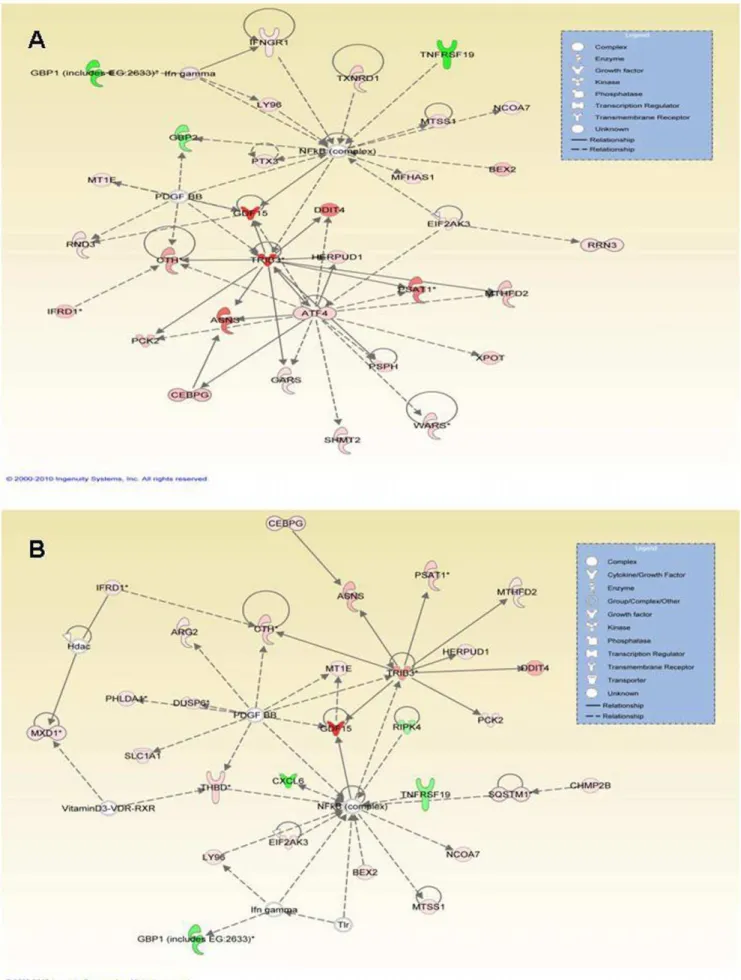
depicted in the inset box. All of the upregulated genes are displayed in red whereas all of the downregulated genes are displayed in green and the degree of differential expression is reflected by the intensity of the color, with darker colors indicating a greater level of differential expression. doi:10.1371/journal.pone.0027110.g003
Table 5.Selected genetic networks with high scores (.26) in SSc Control vs SSc Rottlerin-exposed human dermal fibroblasts.
Molecules in Network Score
Focus
Genes Top Functions
ARG2q, ASNSq, BEX2q, CEBPGq, CHMP2Bq, CTHq, CXCL6Q, DDIT4q, DUSP6q, EIF2AK3q, GBP1 (includes EG:2633)Q, GDF15q, Hdac, HERPUD1q, Ifn gamma, IFRD1q, LY96q, MT1Eq, MTHFD2q, MTSS1q, MXD1q, NCOA7q, NFkB (complex), PCK2q, PDGF BB, PHLDA1q, PSAT1q, RIPK4Q, SLC1A1q, SQSTM1q, THBDq, Tlr, TNFRSF19Q, TRIB3q, VitaminD3-VDR-RXR
59 29 Amino acid metabolism; small molecule biochemistry; genetic disease
CBSq, DBP, DCK, ELL, GAS1Q, GDF15q, GINS2Q, GINS4Q, GSTM4, HDAC8, HNF4A, HSPH1, HUNKQ, JMYq, Jmy-p300q, KLHL24q, MIR124, MOCOSq, NAMPTq, NBR1, RCHY1, RMND1, RSL24D1q, SEL1L, SESN2q, SLC17A5q, SLC31A1q, SLC38A1q, SNAI2, TEAD2Q, TP53,
TRIP11, TTC5, TUBE1q, UBQLN2
32 19 Cell-to-cell signaling and interaction; cellular function and maintenance; infection mechanism
Collagen(s), CXCL12Q, Elastase, ERK, Fibrin, Fibrinogen, FN1Q, Focal adhesion kinase, GFPT1q, HOMER1q, ICAM1q, IL8q, Integrin, Integrin alpha 3 beta 1, LDL, LRP, Mek, MKNK2q, NAMPTq, NfkB1-RelA, NPC1q, NRP2q, Pak, Pdgf, PLAURq, Rac, Rap1, RCAN1q, SLC3A2q, SLC7A5q, SLC7A11q, THBS1Q, Vegfq, VEGFAq, VLDLRq
29 18 Cellular assembly and organization; cellular function and maintenance; protein trafficking
Ap1, ARL4Cq, ASF1BQ, ATP2B1q, Creb, Cyclin A, DNAJB9q, E2f, EPORq, ERK1/2, FSH, G alphai, GAS1Q, GOT1q, hCG, Histone h3, Histone h4, IL12 (complex), JARID2q, Lh, Mapk, MCM4Q, MCM5Q, MCM10Q, MT1Fq, MT1Xq, PFKFB2q, Pka, Pkc(s), PLC, PLC gamma, Pldq, PP2A, STX3q, UHRF1Q
26 16 Hematological system development and function; hematopoiesis; tissue morphology
Akt, C1ORF103q, Caspase, CLIP1q, Cyclooxygenaseq, EIF4EBP1q, FTH1q, G-protein beta, GADD45Aq, GNA13q, Gpcr, HMOX1q, Hsp27Q, Hsp70q, HSPA5q, HSPA9q, HSPB3Q, IFN Beta, IKK (complex), IL1, Insulin, Interferon alpha, Jnk, MHC Class II, NUPR1q, P38 MAPK, PI3K, PTGS1q, PTGS2q, Ras, Ras homologQ, RORAq, Sapk, TGIF1q, WARSq
26 16 Cardiovascular system development and function; connective tissue disorders; drug metabolism
and multiple studies of the SSc transcriptome have reported wide variability in expression patterns, the criteria for analysis were broadened to include transcripts displaying a 1.5 fold or greater change in expression level with a p-value of 0.10. This resulted in the identification of a total of 360 differentially expressed genes (191 upregulated and 169 downregulated) between normal versus SSc-derived fibroblasts irrespective of whether or not the cells had been treated with rottlerin (Table 1). Of these 360 genes, 61 genes were differentially expressed (38 upregulated and 23 downregu-lated) in both the untreated and rottlerin-treated SSc fibroblasts compared to their normal counterparts. Untreated fibroblasts
demonstrated 134 transcripts (62 upregulated and 72 downregu-lated) that were differentially regulated in SSc-derived fibroblasts compared to normal-derived fibroblasts, whereas rottlerin treated SSc-derived fibroblasts displayed 165 unique transcripts (91 upregulated and 74 downregulated) that were differentially regulated compared to normal-derived fibroblasts. A partial list of the most upregulated transcripts in SSc fibroblasts is displayed inTable 6and a partial list of the most downregulated transcripts in SSc fibroblasts is displayed inTable 7.
Several genes known to be involved in the regulation of production and maintenance of the extracellular matrix (ECM) or
Figure 4. Validation of expression levels of downregulated genes following PKC-d inhibition. A.mRNA expression levels of 7 downregulated genes in normal and SSc human dermal fibroblasts following treatment withA.5mM rottlerin,B.10 nM PKC-dsiRNA,C.10mM cell permeable specific PKC-dinhibitory peptide for 24 h. Results are expressed as mean percent difference+/2SD of 3 replicate samples analyzed by quantitative RT-PCR. The PBS control was arbitrarily set to 100% expression. NC: Normal untreated fibroblasts, NR: Normal treated fibroblasts, SC: SSc untreated fibroblasts, SR: SSc treated fibroblasts. Statistical significance was calculated to compare treated vs untreated normal or SSc fibroblasts. *: p,0.1; **: p,0.01; ***: p,0.0001.
in the development of fibrosis, including fibronectin 1 (FN1), insulin growth factor binding protein 7 (IGFBP7), plasminogen activator urokinase (PLAU), Wnt-inducible signaling protein 2 (WISP2), were upregulated in SSc-derived dermal fibroblasts compared to normal dermal fibroblasts. The expression patterns of transcripts for these genes in control and PKC-d-inhibited normal and SSc fibroblasts, as well as for those encoding type I and type III collagen were examined by real time RT-PCR. Figure 6a
displays expression levels in rottlerin treated normal and SSc
fibroblasts whereasFigure 6bdisplays expression levels in siRNA treated fibroblasts and Figure 6c displays expression of these genes in fibroblasts treated with the inhibitory PKC-d peptide. The control siRNA and the control peptide did not affect the expression levels of these genes compared to the saline control. Expression of these genes as measured by real time PCR was consistent with the pattern observed in the microarray results.
Microarray results indicated that cyclooxgenase 1/prostaglan-din synthase 1 (COX1/PTGS1) and cyclooxygenase 2/prosta-Figure 5. Validation of expression levels of upregulated genes following PKC-dinhibition. A.mRNA expression levels of 6 upregulated genes in normal and SSc human dermal fibroblasts following treatment withA.5mM rottlerin,B.10 nM PKC-dsiRNA,C.10mM cell permeable specific PKC-dinhibitory peptide for 24 h. Results are expressed as mean percent difference+/2SD of 3 replicate samples analyzed by quantitative RT-PCR. The PBS control was arbitrarily set to 100% expression. NC: Normal untreated fibroblasts, NR: Normal treated fibroblasts, SC: SSc untreated fibroblasts, SR: SSc treated fibroblasts. Statistical significance was calculated to compare treated vs untreated normal or SSc fibroblasts. *: p,0.1; **: p,0.01; ***: p,0.0001.
glandin synthase 2 (COX2/PTGS2), important mediators of arachidonic acid and prostaglandin synthesis were strongly downregulated in untreated SSc-derived fibroblasts compared to normal untreated fibroblasts as were matrix metalloproteinase 3 (MMP3), pentraxin-3 (PTX3) and suppressor of cytokine signaling 2 (SOCS2). Rottlerin strongly induced upregulated expression COX1/PTGS1, MMP3 and PTX3 but upregulated expression of COX2/PTGS2 was observed only in rottlerin-treated SSc fibroblasts and upregulated SocS2 expression only in rottlerin-treated normal fibroblasts The expression patterns of transcripts for these genes in control and PKC-d-inhibited normal and SSc fibroblasts, as well as for those encoding type I and type III collagen were examined by real time RT-PCR. Figure 7a
displays expression levels in rottlerin treated normal and
SSc-derived fibroblasts whereasFigure 7bdisplays expression levels in siRNA treated fibroblasts andFigure 7cdisplays expression of these genes in fibroblasts treated with the inhibitory PKC- d
peptide. The control siRNA and the control peptide did not affect the expression levels of these genes compared to the saline control. COX1a/PTGS1a, COX1b/PTGS1b, COX2/PTGS2, MMP3, PTX3 and SOCS2 were downregulated in untreated SSc fibroblasts versus untreated normal fibroblasts (Figure 7a–c). PKC-d inhibition strongly induced expression of COX1a/ PTGS1a, COX1b/PTGS1b, MMP3 and PTX3 in both normal and SSc fibroblasts whereas COX2/PTGS2 expression was induced only in treated SSc fibroblasts and SocS2 expression was induced only in treated normal fibroblasts. This expression pattern was consistent with the pattern observed in the microarray
Table 6.Selected transcripts upregulated in SSc fibroblasts.
Gene Symbol Description Fold Change
Transcripts Upregulated in SSc vs NormalFibroblasts
IGFBP5 insulin-like growth factor binding protein 5 5.0
FGFR2 fibroblast growth factor receptor 2 4.6
POMZP3 POM and ZP3 fusion zona pellucida glycoprotein 3 4.5
FGFR2 fibroblast growth factor receptor 2 4.4
FGFR2 fibroblast growth factor receptor 2 4.3
POMZP3 POM and ZP3 fusion zona pellucida glycoprotein 3 4.1
CADP5 Ca++-dependent secretion activator 5 3.9
NFIB nuclear factor I/B 3.8
MCAM melanoma cell adhesion molecule 3.3
MRVI1 murine retrovirus integration site 1 3.2
Transcripts Upregulated in Untreated SSc vs Untreated Normal FibroblastsCells Only
ACTG2 actin, gamma 2, smooth muscle, enteric 6.0
ITGA7 integrin, alpha 7 4.4
ANK2 ankyrin 2, neuronal 4.4
CLIC3 chloride intracellular channel 3 4.3
EBF1 early B cell factor 1 4.3
ANK2 ankyrin 2, neuronal 4.2
CDO1 cysteine dioxygenase 1 4.2
HSPB7 heat shock 27 kDa protein family, member 7 3.8
AFF3 AF4/FMR2 family, member 3 3.6
CAMK2D calcium/calmodulin-dependent protein kinase II delta 3.4
CD74 CD74 molecule, MHC, class II invariant chain 3.4
Transcripts Upregulated in SSc Rottlerin-Treated vs Normal Rottlerin-Treated Fibroblasts Cells Only
DES desmin 5.6
PRUNE2 prune homolog 2 (Drosophila) 5.3
CSGALNA chondroitin sulfate Nacetylgalactosaminyltransferase 1 5.2
ACTC1 actin, alpha, cardiac muscle 1 5.0
TM4SF20 transmembrane 4 L six family member 20 3.8
PLAU plasminogen activator, urokinase 3.7
FHL1 four and a half LIM domains 1 3.6
FOS v-fos FBJ murine osteosarcoma viral oncogene 3.6
FHL1 four and a half LIM domains 1 3.3
FHL1 four and a half LIM domains 1 3.2
MEF2C myocyte enhancer factor 2C 3.1
Fold change indicates the difference between untreated or treated normal cells compared to untreated or treated SSc cells. The entire dataset discussed in this paper is deposited at Gene Expression Omnibus (http://www.ncbi.nlm.nih.gov/geo/query/acc.cgi?acc=GSE23741) under accession number GSE23741.
results. Interestingly, treatment of SSc fibroblasts with rottlerin, siRNA or PKC- d-inhibitory peptide increased the expression levels of COX1 isoforms 1 and 2, COX2, MMP3 and PTX3 (Figure 7a–c). Expression of type I and type III collagen were also upregulated in SSc-derived fibroblasts compared to normal fibroblasts by real time RT-PCR although this upregulation was not observed in the microarray results, possibly due to the very high fibroblast expression levels of these genes.
To further confirm the validity of the results, the production of type I collagen by the cultured fibroblasts and the effect of rottlerin on type I collagen production by these cells was evaluated by Western blots of culture supernatants. Consistent with previously described results, SSc-derived dermal fibroblasts showed
substan-tially increased levels of type I collagen production compared to normal dermal fibroblasts. Exposure to rottlerin induced a dramatic reduction in type I collagen production in both normal and SSc-derived dermal fibroblasts (data not shown).
Analysis of common transcription regulatory networks
Analysis of the promoter regions of the 443 genes differentially regulated in response to rottlerin was performed by entering the transcript IDs into the PAINT program. The analysis revealed a statistically significant association between the presence of specific TREs and exposure to rottlerin. The results of promoter analysis filtered by p,0.05 with the FDR set at ,0.3 demonstrated 14
Table 7.Selected transcripts downregulated in SSc fibroblasts.
Gene Symbol Description Fold Change
Transcripts Downregulated in SSc vs NormalFibroblasts
CDH2 cadherin 2, type 1, neuronal 5.0
B3GACTL beta 1,3-galactosyltransferase-like 4.6
GRIK2 glutamate receptor, ionotropic, kainate 2 4.5
SSTR1 somatostatin receptor 1 4.4
DACT1 dapper, antagonist of beta-catenin, homolog 1 4.3
CDH2 cadherin 2, type 1, neuronal 4.1
TSPAN13 tetraspanin 13 3.9
SIPR1 sphingosine-1-phosphate receptor 1 3.8
TBX3 T-box 3 3.3
NID2 nidogen 2 (osteonidogen) 3.2
COL13A1 collagen, type XIII, alpha 1 2.9
Transcripts Downregulated in Untreated SSc vs Untreated Normal FibroblastsCells Only
DAB1 disabled homolog 1 (Drosophila) 6.0
PTGS1 prostaglandin-endoperoxide synthase 2 4.4
TMTC2 transmembrane and tetratricopeptide repeat cont. 2 4.4
RUNX3 runt-related transcription factor 3 4.3
PID1 phosphotyrosine interaction domain containing 1 4.3
SOCS2 suppressor of cytokine signaling 2 4.2
CRISPLD2 cysteine-rich secretory protein LCCL domain cont. 2 4.2
IFI27 interferon, alpha-inducible protein 27 3.8
CDKN1C Cyclin-dependent kinase inhibitor 1C (p57, Kip2) 3.6
DSEL dermatan sulfate epimerase-like 3.4
NDRG4 NDRG family member 4 3.4
Transcripts Downregulated in SSc Rottlerin-Treated vs Normal Rottlerin-Treated Fibroblasts Cells Only
LHX8 LIM homeobox 8 8.2
MMP3 matrix metallopeptidase 3 (stromelysin 1) 5.3
C9orf167 chromosome 9 open reading frame 167 3.6
AKR1C1 Aldo-keto reductase family 1, member C1 3.5
C9orf167 chromosome 9 open reading frame 167 3.0
CALB2 calbindin 2 2.8
FOXF1 forkhead box F1 2.7
DOK6 docking protein 6 2.6
DIO2 deiodinase, iodothyronine, type II 2.6
MALAT1 metastasis assoc. lung adenocarcinoma trans. 1 2.5
FAM44A family with sequence similarity 44, member A 2.4
Fold change indicates the difference between untreated or treated normal cells compared to untreated or treated SSc cells. The entire dataset discussed in this paper is deposited at Gene Expression Omnibus (http://www.ncbi.nlm.nih.gov/geo/query/acc.cgi?acc=GSE23741) under accession number GSE23741.
transcription factors whose TREs were significantly enriched in response to rottlerin. These factors were: transcription factor CP2 (TFCP2), olfactory neuronyl transcription factor 1/early B-cell factor 1 (OLF1/EBF1), aryl hydrocarbon receptor nuclear translocator/hypoxia inducible factor 1 (ARNT/HIF1), myogenin (MYOG), NFkB, E2F, selenocysteine tRNA gene transcription activating factor (STAF), hepatocyte nuclear factor 4 (HNF4), paired box gene 6 (PAX6), CCAAT box binding protein, cooperates with myogenic protein 1 (COMP1), upstream stimu-latory factor (USF), v-ets avian erythroblastosis virus E26 oncogene homolog 1(c-ETS1) and E26-like protein 1 (ELK1) as shown in Table S2. The identification of statistically significant enrichment of a specific TRE within a particular expression cluster may indicate a role for the cognate transcription factor in coordinate regulation of genes in that cluster. An analysis of the 359 transcripts differentially regulated between normal and
SSc-derived dermal fibroblasts identified 4 transcription factors TREs that were enriched in response to rottlerin. These factors were upstream transcription factor 1 (USF1), STAT1, cAMP response element binding protein (CREB) and cJun (Table S2).
Discussion
PKC-dhas been implicated as a regulator of a wide variety of cellular processes and has been shown to participate in the pathogenesis of numerous disorders. PKC-d also plays an important role in tissue fibrosis as it is regulated by TGF-b. TGF-bactivates PKC-dwhich in turn positively regulates Smad3 transcriptional activity, resulting in increased transcription of genes encoding various collagens and fibronectin [17,18]. Other studies have shown that production and secretion of type I collagen by vascular smooth muscle cells requires PKC-d [15]. Figure 6. Validation of expression levels of genes upregulated in SSc fibroblasts compared to normal fibroblasts following PKC-d inhibition.mRNA expression levels of 7 upregulated genes in normal and SSc human dermal fibroblasts following treatment withA.5mM rottlerin, B.10 nM PKC-dsiRNA,C.10mM cell permeable specific PKC-dinhibitory peptide for 24 h. Results are expressed as mean percent difference+/2SD of 3 replicate samples analyzed by quantitative RT-PCR. The PBS control was arbitrarily set to 100% expression. NC: Normal untreated fibroblasts, NR: Normal treated fibroblasts, SC: SSc untreated fibroblasts, SR: SSc treated fibroblasts. Statistical significance was calculated to compare treated vs untreated normal or SSc fibroblasts. *: p,0.1; **: p,0.01; ***: p,0.0001.
Furthermore, PKC-d activation is necessary to mediate the stimulatory effect of CTGF in cooperation with insulin/insulin growth factor 1 (IGF1) on collagen synthesis in SSc fibroblasts [14]. In a previous study we demonstrated that SSc fibroblasts have substantially increased levels of PKC-d compared to normal fibroblasts and that exposure of these fibroblasts to rottlerin resulted in a.80% reduction in COL1A1 mRNA, and a.70% reduction in COL3A1 mRNA with a corresponding decrease in the production of these proteins. The role of PKC-d in the regulation of collagen gene expression was further documented by the demonstration that a dominant-negative form of PKC-d
caused a potent decrease in the transcription of the type I collagen gene promoter [13].
Given the demonstrated effect of rottlerin to downregulate the production of type1 and type 3 collagens, we undertook the
present study in order to gain a better understanding of the effects of rottlerin on the transcriptome of fibroblasts to identify molecules and pathways that may be important in the pathogenesis of fibrotic diseases such as SSc. Microarray analysis on total RNA isolated from rottlerin-treated and non-treated normal and SSc fibroblasts yielded a total number of 433 gene transcripts that displayed a greater than 2 fold difference in expression at a significance level of p,0.05 (Table 1, Figure 1). Since experimental replicates were not used in this study, transcripts displaying a fold change of less than 2 fold were excluded. The differentially regulated genes are involved in many of the processes already attributed to be regulated by PKC-d activity. These include: cell death, cell cycle control, cell growth and proliferation, cellular movement, cell-cell interaction, amino acid synthesis and tumor morphology as well as embryonic, tissue, hematopoietic and Figure 7. Validation of expression levels of genes downregulated in SSc fibroblasts compared to normal fibroblasts following PKC-dinhibition.mRNA expression levels of 6 downregulated genes in normal and SSc human dermal fibroblasts following treatment withA.5mM rottlerin,B.10 nM PKC-dsiRNA,C.10mM cell permeable specific PKC-dinhibitory peptide for 24 h. Results are expressed as mean percent difference +/2SD of 3 replicate samples analyzed by quantitative RT-PCR. The PBS control was arbitrarily set to 100% expression. NC: Normal untreated fibroblasts, NR: Normal treated fibroblasts, SC: SSc untreated fibroblasts, SR: SSc treated fibroblasts. Statistical significance was calculated to compare treated vs untreated normal or SSc fibroblasts. *: p,0.1; **: p,0.01; ***: p,0.0001.
skeletal development. The differentially regulated genes also are associated with the development of a variety of disease conditions, such as: cancer, gastrointestinal, reproduction, cardiovascular and hematological diseases as well as various genetic disorders. The gene network displaying the greatest number of genes that were differentially regulated showed that one of the central molecular hubs was the NFkB transcription factor. The important role of NFkB was an observation strongly supported by the PAINT analysis of the TREs that are enriched at a significantly greater level than chance in untreated versus rottlerin treated fibroblasts which identified the NFkB TRE.
Although several recent papers have shown that rottlerin is a potent PKC-d inhibitor exerting its effects on PKC-d at nanomolar concentrations, it has become apparent that at much higher concentrations it can also inhibit other kinases [25]. Rottlerin can also uncouple mitochondrial respiration from oxidative phosphorylation and some of the effects on apoptosis previously attributed to PKC-dcould be caused by mitochondrial uncoupling and increased ROS production. However, the results we obtained did not provide compelling evidence of a role in mitochondrial uncoupling in dermal fibroblasts, one of the effects attributed to rottlerin, although, on the contrary, three genes encoding proteins located in the mitochondria [27–29] were upregulated in response to rottlerin, namely, mitochondrial phosphoenolpyruvate carboxypeptidase 2 (PCK2), mitochondrial serine hydroxymethyltransferase 2 (SHMT2), and mitochondrial lon peptidase 1 (LONP1). Among these only LONP1 has been reported to be affected by mitochondrial uncoupling [29]. Additionally, in order to address the possibility that the microarray results reflected changes in the transcriptome mediated by targets of rottlerin other than PKC-d, we also isolated and analyzed RNA from normal and SSc fibroblasts in which PKC-d activity had been targeted by RNA interference or with a cell-permeable
PKC-dinhibitory peptide. The real time PCR results from these PKC-d
inhibited fibroblasts support the conclusion that the differential expression observed in the microarray data can be attributed to inhibition of PKC-dactivity by rottlerin.
Twelve genes that were part of the most differentially regulated networks (Figure 3) or that were among the most strongly differentially expressed genes identified in our microarray analysis were randomnly selected for verification by real time PCR. Changes in the expression levels of these genes were analyzed and confirmed using RNA from fibroblasts in which PKC-d activity was targeted by exposure to rottlerin, exposure to PKC-d
inhibitory peptide or by RNA interferenece. The upregulated genes that were confirmed (Figure 5) were: DDIT3/CHOP, a dominant negative inhibitor of C/EBP and CCAAT/enhancer binding protein beta [30]; DDIT4/REDD1, a transcriptional target of p53 which is upregulated by hypoxia [31]; GDF15, also known as macrophage inhibitory cytokine 1 (MIC1) which is expressed in activated but not in resting macrophages [32]; THBD, an endothelial cell surface protein which forms a complex with thrombin and coverts it into a physiologic anticoagulant [33] and TRIB3, a negative regulator of the transcription factors AKT, NFkB, AP1 and oncogenic ras [34]. It was of interest that among the genes found to be downregulated by inhibition of PKC-d
activity there were several genes that are likely to participate in the development of fibrotic reactions. Thus, these genes represent novel or less well recognized participants in the fibrotic process that were upregulated by PKC-d. The profibrogenic genes that were downregulated by PKC-dinhibition (Figure 4), which were confirmed by RT-PCR, included c5orf13, which downregulates TGF-b1 and TGF-bR2 and has been shown to decrease collagen expression and induce differentiation of myofibroblasts to
fibroblasts [35]; CXCL6, a chemokine that displays increased expression during progression of liver fibrosis [36]; CXCL12, a chemokine that is a powerful attractant for fibrocytes and that participates in the angiogenesis associated with chronic inflam-mation and fibrosis and has been found to be increased in pulmonary fibrosis tissues [37–39]; GBP1, an interferon inducible guanylate binding protein that is expressed at gap junctions and is involved in endothelial cell proliferation and invasion [40]; SOX9, which is coexpressed with Col2a1, the gene encoding type II collagen, the major cartilage matrix protein [41] and which has recently been suggested to participate in SSc fibrosis [42]; and TNFRSF19, which is expressed primarily in prostate cells and is capable of activating the JNK pathway and of inducing NFkB activation [43].
Analysis of the differential expression of genes between normal and SSc fibroblasts identified a total of 75 genes that displayed a greater than 2 fold difference in expression with a p value,0.05. However, to make the results of our studies comparable to other previously published studies comparing the normal and SSc transcriptomes [44–47], we reanalyzed the data including genes with differential expression greater than 1.5 fold and a significance of p,0.10 to reflect the high level of heterogeneity known to exist even between fibroblasts derived from normal and SSc skin biopsies. Using these parameters, we identified 360 genes that were differentially expressed between normal and SSc fibroblasts. Interestingly, only 61 of these transcripts were unaffected by rottlerin treatment. However, 134 transcripts were differentially expressed only in untreated cells, while 165 transcripts were differentially expressed only in rottlerin treated cells.
Urokinase plasminogen activator (PLAU), which has been implicated as a suppressor of fibrosis via activation of MMPs [48] was upregulated in normal fibroblasts but not in SSc fibroblasts following PKC-d inhibition (Figure 6). Expression of COX1a, COX1b, and COX2 which regulate prostaglandin synthesis thereby suppressing the synthesis of collagen [49,50]; and SOCS2, which acts to suppress insulin growth factor 1 (IGF1) and growth hormone (GH) mediated deposition of excessive collagen [51] were significantly downregulated in untreated SSc cells (Figure 7). Treatment with rottlerin, PKC-dspecific siRNA or with a PKC-d
inhibitory peptide dramatically induced expression of COX1a, COX1b, COX2 and SOCS2, an effect which would be expected to abrogate some of the potent PKC-d profibrotic effects. Furthermore, MMP3, a matrix metalloproteinase involved in collagen remodeling [52] and PTX3, a gene involved in innate immune responses that is found to be elevated in the serum of SSc patients and that is constitutively expressed in SSc fibroblasts [53,54] were downregulated in SSc fibroblasts following inhibition of PKC-dactivity (Figure 7).
broad spectrum of its profibrogenic effects may be a novel and effective therapeutic approach for SSc and other fibrosing diseases.
Supporting Information
Table S1 Primers used for real-time PCR studies.PCR primers used to validate real-time PCR expression levels. Primers are listed in 59-39orientation.
(DOC)
Table S2 PAINT analysis of enriched Transcriptional Regulatory Elements (TREs). PAINT v 3.9, containing a database of promoter sequences (UpstreamDB) constructed for all known and putative annotated genes in the Ensembl genome database for Homo sapiens, version 49, cross referenced with
Unigene build #213 was used for promoter analysis Statistical significance for TRE overrepresentation was set at p,0.05 with additional filtering performed by setting the false discovery rate (FDR) at 0.3.N: enriched in rottlerin treated normal fibroblasts;S: enriched in rottlerin treated SSc fibroblasts; B: enriched in rottlerin treated normal and SSc fibroblasts.
(DOC)
Author Contributions
Conceived and designed the experiments: SAJ. Performed the experiments: PJW SA. Analyzed the data: PJW SA. Contributed reagents/materials/ analysis tools: PJW SA SAJ. Wrote the paper: PJW SAJ.
References
1. Kikkawa U, Ogita K, Ono Y, Asaoka Y, Shearman MS, et al. (1987) The common structure and activities of four subspecies of rat brain protein kinase C family. 1987. FEBS Lett 223: 212–216.
2. Carpenter D, Jackson T, Hanley MR (1987) Protein kinase Cs. Coping with a growing family. Nature 325: 107–108.
3. Jaken S, Parker PJ (2000) Protein kinase C binding partners. Bioessays 222: 245–254.
4. Spitaler M, Cantrell DA (2004) Protein kinase C and beyond. Nat Immunol 5: 785–790.
5. Poole AW, Pula G, Hers I, Crosby D, Jones ML (2004) PKC-interacting proteins: from function to pharmacy. Trends Pharmacol Sci 25: 528–535. 6. Newton AC (2003) The ins and outs of protein kinase C. Methods Mol Biol 233:
3–7.
7. Newton AC (2010) Protein kinase C: poised to signal. Am J Physiol Endocrinol Metab 298: E395–403. Epub 2009 Nov 24.
8. Jackson DN, Foster DA (2004) The enigmatic protein kinase C delta: complex roles in cell proliferation and survival. FASEB J 18: 627–636.
9. Steinberg SF (2004) Distinctive activation mechanisms and functions for protein kinase C delta. Biochem J 384: 449–459.
10. Vallee S, Laforest S, Fouchier F, Montero MP, Penel C, et al. (2004) Cytokine-induced upregulation of NF-kappaB, IL-8, and ICAM-1 is dependent on colonic cell polarity: implication for PKCdelta. Exp Cell Res 297: 165–185. 11. Wang Q, Wang X, Evers BM (2003) Induction of cIAP-2 in human colon cancer
cells through PKCd/NF-kB. J Biol Chem 278: 51091–51099.
12. Page K, Li J, Zhou L, Iasvovskaia S, Corbit KC, et al. (2003) Regulation of airway epithelial cell NF-kB-dependent gene expression by protein kinase C-d. J Immunol 170: 5681–5689.
13. Jimenez SA, Gaidarova S, Saitta B, Sandorfi N, Herrich DJ, et al. (2001) Role of protein kinase C-delta in the regulation of collagen gene expression in scleroderma fibroblasts. J Clin Invest 108: 1395–1403.
14. Gore-Hyer E, Pannu J, Smith EA, Grotendorst G, Trojanowska M (2003) Selective stimulation of collagen synthesis in the presence of costimulatory insulin signaling by connective tissue growth factor in scleroderma fibroblasts. Arthritis Rheum 48: 798–806.
15. Zohlman A, Kamiya K, Kato K, Salvarezza SB, Doty SB, et al. (2008) Protein kinase C delta is necessary for the secretion of collagen type I from vascular smooth muscle cells. FASEB J 22: lb609.
16. Runyan CE, Schnaper HW, Poncelet AC (2004) Smad3 and PKCdelta mediate TGF-beta1-induced collagen I expression in human mesangial cells. Am J Physiol Renal Physiol 285: F413–F422.
17. Ryer EJ, Hom RP, Sakakibara K, Nakayama KI, Nakayama K, et al. (2006) PKCdelta is necessary for Smad3 expression and transforming growth factor beta-induced fibronectin synthesis in vascular smooth muscle cells. Arterioscler Thromb Vasc Biol 26: 780–786. Epub 2006 Feb 9.
18. Runyan CE, Schnaper HW, Poncelet AC (2003) Smad3 and PKCdelta mediate TGF-beta1-induced collagen I expression in human mesangial cells. Am J Physiol Renal Physiol 285: F413–22. Epub 2003 May 20.
19. Gschwendt M, Mu¨ller HJ, Kielbassa K, Zang R, Kittstein W, et al. (1994) Rottlerin, a novel protein kinase inhibitor. Biochem Biophys Res Commun 199: 93–98.
20. LeRoy EC, Black C, Fleischmajer R, Jablonska S, Krieg T, et al. (1988) Scleroderma (systemic sclerosis): classification, subsets, and pathogenesis. J Rheumatol 15: 202–205.
21. Mi Z, Mai J, Lu X, Robbins PD (2000) Characterization of a class of cationic peptides able to facilitate efficient protein transduction in vitro and in vivo. Mol Ther 2: 339–347.
22. Chen L, Hahn H, Wu G, Chen CH, Liron T, et al. (2001) Opposing cardioprotective actions and parallel hypertrophic effects of delta PC and epsilon PKC. Proc Natl Acad Sci U S A 98: 11114–11119.
23. Vadigepalli R, Chakravarthula P, Zak DE, Schwaber JS, Gonye GE (2003) PAINT: a promoter analysis and interaction network generation tool for gene regulatory network identification. OMICS 7: 235–252.
24. Gonye GE, Chakravarthula P, Schwaber JS, Vadigepalli R (2007) From Promoter Analysis to Transcriptional Regulatory Network Prediction Using PAINT. Gene Function Analysis, Methods in Molecular Biology, edited by Michael Ochs. Totowa: Humana Press 408: 49–68.
25. Soltoff SP (2007) Rottlerin: an inappropriate and ineffective inhibitor of PKCdelta. Trends Pharmacol Sci 28: 453–458. Epub 2007 Aug 10. 26. Mochly-Rosen D, Gordon AS (1998) Anchoring proteins for protein kinase C: a
means for isozyme selectivity. FASEB J 12: 35–42.
27. Modaressi S, Brechtel K, Christ B, Jungermann K (1998) Human mitochondrial phosphoenolpyruvate carboxykinase 2 gene. Structure, chromosomal localiza-tion and tissue-specific expression. Biochem J 333: 359–366.
28. Stover PJ, Chen LH, Suh JR, Stover DM, Keyomarsi K, Shane B (1997) Molecular cloning, characterization, and regulation of the human mitochondrial serine hydroxymethyltransferase gene. J Biol Chem 272: 1842–1848. 29. Wang N, Maurizi MR, Emmert-Buck L, Gottesman MM (1994) Synthesis,
processing, and localization of human Lon protease. J Biol Chem 269: 29308–29313.
30. Ron D, Habener JF (1992) CHOP, a novel developmentally regulated nuclear protein that dimerizes with transcription factors C/EBP and LAP and functions as a dominant-negative inhibitor of gene transcription. Genes Dev 6: 439–653. 31. Ellisen LW, Ramsayer KD, Johannessen CM, Yang A, Beppu H, et al. (2002) REDD1, a developmentally regulated transcriptional target of p63 and p53, links p63 to regulation of reactive oxygen species. Mol Cell 10: 995–1005. 32. Bootcov MR, Bauskin AR, Valenzuela SM, Moore AG, Bansal M, et al. (1997)
MIC-1, a novel macrophage inhibitory cytokine, is a divergent member of the TGF-beta superfamily. Proc Natl Acad Sci U S A 94: 11514–11519. 33. Esmon NL, Carroll RC, Esmon CT (1983) Thrombomodulin blocks the ability
of thrombin to activate platelets. J Biol Chem 258: 12238–12242.
34. Kiss-Toth E, Bagstaff SM, Sung HY, Jozsa V, Dempsey C, et al. (2004) Human tribbles, a protein family controlling mitogen-activated protein kinase cascades. J Biol Chem 279: 42703–42708. Epub 2004 Aug 6.
35. Pan D, Zhe X, Jakkaraju S, Taylor GA, Schuger L (2002) P311 induces a TGF-beta1-independent, nonfibrogenic myofibroblast phenotype. J Clin Invest 110: 1349–1358.
36. Asselah T, Bieche I, Laurendeau I, Paradis V, Vidaud D, et al. (2005) Liver gene expression signature of mild fibrosis in patients with chronic hepatitis C. Gastroenterology 129: 2064–2075.
37. Strieter RM, Keeley EC, Hughes MA, Burdick MD, Mehrad B (2009) The role of circulating mesenchymal progenitor cells (fibrocytes) in the pathogenesis of pulmonary fibrosis. J Leukoc Biol 86: 1111–1118.
38. Phillips RJ, Burdick MD, Hong K, Lutz MA, M urray LA, et al. (2004) Circulating fibrocytes traffic to the lungs in response to CXCL12 and mediate fibrosis. J Clin Invest 114: 438–446.
39. Tourkina E, Bonner M, Oates J, Hofbauer A, Richard M, et al. (2011) Altered monocyte and fibrocyte phenotype and function in scleroderma interstitial lung disease: reversal by caveolin-1 scaffolding domain peptide. Fibrogenesis Tissue Repair 4: 15.
40. Schnoor M, Betanzos A, Weber DA, Parkos CA (2009) Guanylate-binding protein-1 is expressed at tight junctions of intestinal epithelial cells in response to interferon-gamma and regulates barrier function through effects on apoptosis. Mucosal Immunol 2: 33–42. Epub 2008 Sep 17.
41. Bell DM, Leung KK, Wheatley SC, Ng LJ, Zhou S, et al. (1997) SOX9 directly regulates the type-II collagen gene. Nat Genet 16: 174–178.
42. Hanley KP, Oakley F, Sugden S, Wilson DI, Mann DA, et al. (2008) Ectopic SOX9 mediates extracellular matrix deposition characteristic of organ fibrosis. J Biol Chem 283: 14063–14071.
43. Eby MT, Jasmin A, Kumar A, Sharma K, Chaudhary PM (2000) TAJ, a novel member of the tumor necrosis factor receptor family, activates the c-Jun N-terminal kinase pathway and mediates caspase-independent cell death. J Biol Chem 275: 15336–15342.
fibroblasts from systemic sclerosis patients with early disease. Arthritis Rheum 52: 865–876.
45. Gardner H, Shearstone JR, Bandaru R, Crowell T, Lynes M, et al. (2006) Gene profiling of scleroderma skin reveals robust signatures of disease that are imperfectly reflected in the transcript profiles of explanted fibroblasts. Arthritis Rheum 54: 1961–1973.
46. Milano A, Pendergrass SA, Sargent JL, George LK, McCalmont TH, et al. (2008) Molecular subsets in the gene expression signatures of scleroderma skin. PLoS One 3: e2696.
47. Fuzii HT, Yoshikawa GT, Junta CM, Sandrin-Garcia P, Fachin AL, et al. (2008) Affected and non-affected skin fibroblasts from systemic sclerosis patients share a gene expression profile deviated from the one observed in healthy individuals. Clin Exp Rheumatol 26: 866–874.
48. Zhang Y, Zhou ZH, Bugge TH, Wahl LM (2007) Urokinase-type plasminogen activator stimulation of monocyte matrix metalloproteinase-1 production is mediated by plasmin-dependent signaling through annexin A2 and inhibited by inactive plasmin. J Immunol 179: 3297–3304.
49. Varga J, Diaz-Perez A, Rosenbloom J, Jimenez SA (1987) PGE2 causes a coordinate decrease in the steady state levels of fibronectin and types I and III
procollagen mRNAs in normal human dermal fibroblasts. Biochem Biophys Res Commun 147: 1282–1288.
50. Huang SK, Wettlaufer SH, Chung J, Peters-Golden M (2008) Prostaglandin E2 inhibits specific lung fibroblast functions via selective actions of PKA and Epac-. Am J Respir Cell Mol Biol 39: 482–489. Epub 2008 Apr 17.
51. Fruchtman S, Simmons JG, Michaylira CZ, Miller ME, Greenhalgh CJ, et al. (2005) Suppressor of cytokine signaling-2 modulates the fibrogenic actions of GH and IGF-I in intestinal mesenchymal cells. Am J Physiol Gastrointest Liver Physiol 289: G342–50. Epub 2005 Apr 14.
52. Sellers A, Murphy G (1981) Collagenolytic enzymes and their naturally occurring inhibitors. Int Rev Connect Tissue Res 9: 151–190.
53. Iwata Y, Yoshizaki A, Ogawa F, Komura K, Hara T, et al. (2009) Increased serum pentraxin 3 in patients with systemic sclerosis. J Rheumatol 36: 976–983. Epub 2009 Feb 27.