COMPARISON BETWEEN THE NUTRITIONAL QUALITY OF FLOUR
OBTAINED FROM RAW, ROASTED AND FERMENTED SESAME
(
SESAMUM INDICUM
L.) SEED GROWN IN NIGERIA
Folasade Maria Makinde
1,
Rahman Akinoso
21Department of Food Science and Technology, Bowen University, Osun State, Nigeria 2Department of Food Technology, University of Ibadan, Ibadan, Nigeria
ABSTRACT
Background. The most common form of utilization of sesame seed is its roasting, which supplies nutrients to the diet. Therefore, in view of the nutritional values of sesame seeds, the present study aimed at investigating the effect of roasting and fermentation on the nutritional quality of sesame fl our.
Material and methods. Nigeria grown white sesame seeds (NCRI-98-60) were collected from National
Cereal Research Institute (NCRI), Badegi, Nigeria. The seeds were divided into three portions, and treated as raw, roasted and fermented sesame seeds respectively. Each of the samples was milled, sieved and analysed for chemical composition using standard methods. Animal studies were used to evaluate the raw and pro-cessed sesame in terms of nutritional and histopathological qualities.
Results. The ranges of proximate contents from sesame were: protein 15.4-26.5 g/100 g, fat 52.4-62.8 g/100 g, crude fi bre 3.34-3.89 g/100 g, ash 3.93-6.78 g/100 g, carbohydrate 11.7-13.4 g/100 g and energy value 550.7--593.7 kcal/g. Among the minerals, calcium was highest (464-567 mg/100 g) followed by phosphorus (442--508 mg/100 g), magnesium (399-455 mg/100 g) and potassium (336-489 mg/100 g). Total essential amino acid was within the range of 26.66-32.73 mg/100 g and these values were higher than FAO/WHO dietary requirement for infant and adult. Fatty acid profi les of raw, roasted and fermented sesame showed a predomi-nance of oleic acid (46.43%, 44.20%, and 43.16%, respectively) followed by linoleic acid (36.76%, 39.02%, and 39.67%); while the least was behenic acid. The unsaturated/saturated fatty acid ratio ranges between 5.01-5.13. Phytate and oxalate concentrations of fermented sesame were signifi cantly reduced than other food samples. In general, fermented sesame was found to have to have better nutritional quality as indicated by rat growth response. Correspondingly, the Food Effi ciency Ratio (FER) value of 0.16 was higher than raw and roasted sesame respectively. Signifi cantly higher Protein Effi ciency Ratio (PER) value was also obtained for fermented sesame. The organ to body ratios of the test animals were infl uenced by treatments as recorded on heart, kidney, spleen, liver and pancreas.
Conclusion. The present study investigated the effect of roasting and fermentation on the nutritional quality of sesame fl our. The fi ndings showed that roasting and fermentation could enhance the nutritional quality of sesame seeds without detrimental effect on human.
INTRODUCTION
The search for lesser known and underutilized crops, many of which are potentially valuable as
hu-man food has been intensifi ed to maintain a balance
be-tween population growth and agricultural product. In tropical developing countries where the supply of ani-mal protein is inadequate to meet the rapid population growth, intense research efforts are currently directed
toward identifi cation and evaluation of underexploited
oil seeds, which normally a have considerable high protein content. Such studies are of great importance to reduce hunger and malnutrition among the vulnerable group which basically consist of children and pregnant women. In the tropical regions of Africa, numerous varieties of oil crops occur ranging from commonly known and utilized ones such as groundnut, soybean, palm kernel, cotton seed, olive, melon seed, linseed
and saffl ower to underutilized ones such as walnut,
lo-cust bean, African oil bean and sesame seed.
Sesame seed (Sesamum indicum L., synonymous
with S. orientale L.), also known as sesamum,
gin-gelly, sim sim, benniseed, and til is probably the most ancient oilseed crop. It is not clear where the seed originated, but it is speculated that it was native to tropical Africa. Moreover, the importance of sesame in the economies of several African countries
justi-fi es the African continent to be the centre of its
or-igin. It has since travelled all over the world and is now extensively grown in many tropical and warm temperate regions [Biabani and Pakniyat 2008]. The
genus Sesamum belongs to the family Pedaliaceae,
which contains more than 30 species, of which only
S. indicum L. is cultivated [Padma et al. 2011]. A large
number of these occur in Africa (18 exclusively), 8 in the India-Sri Lanka region (5 exclusively), and others occurring in several regions on a non-exclusive basis
[Weiss 2000].The total world crop area under sesame
is about 6 million hectares. Sixty-six percent of this is
concentrated is Asia, twenty fi ve percent of the world
sesame is planted in Africa (mainly Nigeria, Ethiopia and Sudan) and 8% in America, Venezuela, Mexico, Guatemala and Columbia) as reported by Federal In-stitute for Industrial Research [1990]. Nigeria is one
of the major producers of sesame seed in Africa andit
is found predominantly in Benue, Nasarawa and
Ji-gawa States. Nigeria is the fi fth largest producer of
the commodity in the world with an estimated produc-tion of 120,000 metric tonnes annually [NCRI 2003].
Theleading world producers are India, China, Mexico
and Sudan in Africa. As a crop, capable of growing in areas where growth requirements are quite limited, sesame has a key role in sustaining food provision in disadvantaged areas of the tropical Africa. Total an-nual consumption is about 65% for oil extraction and 35% for food. The food segment includes about 42% roasted, 12% grounded, 36% washed and processed and 10% roasted and salted [RMRDC 2004]. In Af-rica, the most popular method of preparing this seed is cooking or roasting. Fermented sesame seeds (Ogiri-saro) are popular in Sierra Leone but not very com-mon in the other African countries. Limited studies have been conducted to explore the nutritional asset
of sesame seed grown in tropical Africa.Raw sesame
seeds have been shown to contain high levels of un-desirable chemical compounds, majorly phytate and oxalate usually found in the seed hulls which lower the bioavailability of minerals and digestibility of plant proteins thereby limiting its use as food ingredi-ent [Giami and Isichei 1999]. Consequingredi-ently, sesame seed must be subjected to various processing condi-tions before it is consumed by humans.
Enhancement of the nutritional quality of sesame seeds can be anticipated through processing (such as roasting and fermentation) prior to consumption.
The knowledge of how processing conditions affect
nutrient availability is critical to develop structured foods to meet the nutritional needs of end users.
No comprehensive study has been reported
simulta-neously to show chemical composition, nutritional and histopathological qualities of sesame seeds grown
inAfrican tropics as affected by roasting and
fermen-tation. The purpose of the present study was to estab-lish the nutritional qualities of raw and processed ses-ame seeds grown in Nigeria in view of their increased utilization in human diets.
MATERIAL AND METHODS
Materials
Processing of raw, roasted and fermented sesame seeds
Raw. The whole seeds were soaked in water (1:5
w/v) ratio for 4 h at temperature of 29 ±2°C, followed by dehulling with palms of hand and washed with water. The dehulled seeds were dried in an air oven (GallenKamp BS Oven 250) at 105°C for 12 h, milled
(Wiley mill, 30 mesh) to obtain raw sesame fl our and
stored in a glass container.
Roasting. Roasted sesame was prepared by
plac-ing raw seeds in Pyrex petri dish (8.0-diameter) and roasted at 160°C for 25 min using a household toaster oven (Hamilton Brands, Washington, USA). The tem-perature of the oven was calibrated using a thermo-couple to detect actual temperature at the sample lo-cation. After roasting, the seeds were allowed to cool to ambient temperature, milled (Wiley mill, 30 mesh)
to obtain roasted sesame fl our and stored in a glass
container.
Fermentation. Fermented sesame seeds were
prepared by cooking 200 g dehulled sesame in boil-ing water for 6 h and cooled. The cooked seeds were placed in a plastic container with a tight lid and sealed.
Thesamples were allowed to ferment at 35 ±2°C for
7 days and oven dried at 105°C for 12 hr to bring an end to fermentation, milled (Wiley mill, 30 mesh) to
obtain fermented sesame fl our and stored in a glass
container.
Nutritional composition
Proximate analysis. Proximate analysis was
car-ried out on the raw, roasted and fermented sesame
fl ours. The moisture, crude protein (N × 6.25), fat,
ash and fi bre were determined by standard procedures
[AOAC 2005]. Total carbohydrates were calculated by difference. The energy value was estimated (kcal/g)
following the method as described by Ekanayake etal.
[1999]. All proximate analyses of the sesame fl ours
were carried out in triplicate.
Mineral analysis. Potassium was determined
us-ing fl ame photometry (Corning, UK Model 405).
Phosphorus was determined by the phosphovanado-molybdate (yellow) method [AOAC 2005]. The oth-er elemental contents (Ca, Mg, Fe, Se, Zn and Mn) were determined, after wet digestion of sample ash
with amixture of concentrated nitric acid, sulphuric
acid and perchloric acid (10:0.5:2, v/v) using Atomic
Absorption Spectrophotometer (AAS, Hitachi Z6100, Tokyo, Japan). All the determinations were carried out in triplicates and minerals reported in mg/100 g.
Amino acid determination
The amino acid profi le was determined using the
method described by Sparkman et al. [1958]. Each sample was initially dried to constant weight, defat-ted, hydrolyzed and evaporated. The amino acids of the samples were analysed by ion exchange chroma-tography (IEC) using the Technicon Sequential Mul-tisample (TSM) Amino Acid Analyzer (Technicon In-struments Corporation, New York) which is designed to separate and analyse free acidic, neutral and basic amino acids of the hydrolysate. The period of analysis
was 76 min for each sample. The gas fl ow rate was
0.50 mL·min-1 at 60°C with reproducibility
consist-ent within ±3%. The net height of each peak produced by the chart recorder of the TSM (each representing
anamino acid) was measured and calculated.
Norleu-cine was the internal standard. The amino acid values reported were averages of two determinations. Trypto-phan was not determined.
Fatty acids determination
Fatty acid compositions of the samples were ana-lysed using gas-liquid chromatography (with omega wax capillary column Supelco, USA). The lipid class-es were separated by thin layer chromatography on silica gel G 60 (Merck, Darmstadt), using n-hexane/ ethyl ether/acetic acid (73/25/2/v/v/v) as developing solvent. The fatty acids of phospholipids and triglyc-erides were transformed with sodium methylate into methyl esters.
Anti-nutritional composition
Determination of phytate. The phytate content
was determined by the method described by Maga
[1982]. Two grams of each fi nely ground sample was
soaked in 20 mL of 0.2 N HCl and fi ltered. After fi
ltra-tion, 0.5 mL of the fi ltrate was mixed with 1 mL
fer-ric ammonium sulphate solution in a test tube, boiled for 30 min in a water bath, cooled in ice for 15 min
andcentrifuged at 3000 rpm for 15 min. One millilitre
acid was obtained by extrapolation from a standard curve using standard phytic acid solution.
Determination of oxalate. Oxalate was determined
following the standard method [AOAC 2005]. 1 g of the
sample was weighed into 100 mL conical fl ask. 75 mL
of 3M H2SO4 was added and the solution was carefully
stirred intermittently with a magnetic stirrer for about
1 h and then fi ltered using Whatman No. 1 fi lter paper.
The sample fi ltrate (extract; 25 mL) was collected and
titrated against hot (80-90°C) 0.1 N KMnO4 solution to
the point when a faint pink colour appeared that per-sisted for at least 30 s. The concentration of oxalate in each sample was obtained from the calculation:
1 mL 0.1 permanganate = 0.006303 g oxalate.
Biological evaluation of protein quality
Test animals. Twenty wistar albino rats (Rattus
norvegicus), 4 weeks old, were obtained from the
Animal Breeding Centre, Department of Veterinary Physiology and Pharmacology, Faculty of Veterinary Medicine, University of Ibadan, Nigeria. They were
randomly divided into groups of fi ve and acclimatized
in polypropylene metabolic cages housed in a
tem-perature controlled room (22 ±1°C) with 50% relative
humidity and 12 h photoperiod. The control and ex-perimental diets along with water were fed to
respec-tive animal groups ad libitum for 28 days.
Diet composition. The diet of rats consisted of ca-sein (control), protein-free (basal diet), raw, roasted and
fermented sesame fl ours (experimental diets). All the
diets except for basal diet, consisted of 10% protein. Experimental and control diets were prepared by
incor-porating the processed sesame fl ours and casein
respec-tively into the basal diet to achieve an iso-nitrogenous diet at 10% protein level. The group of rat fed with ca-sein as an active source of protein served as control. The diets were prepared and stored in airtight glass
con-tainers a week prior to the experiment. Thecomposition
of the basal diets was as shown in Table1.
Growth performance assay. Weighed diet was
given daily and unconsumed diet was collected and weighed to calculate the feed intake (FI) values. Weight of the rats was recorded twice in a week and the body weight gain (BWG) was calculated at the end of the experiment. The protein content of the diet was determined by micro-Kjeldahl method [AOAC 2005]
and feed effi ciency ratio (FER), protein effi ciency
ra-tio (PER), net protein retenra-tion (NPR), protein
reten-tion effi ciency (PRE) and feed conversion ratio (FCR)
were calculated according to the method of Chapman et al. [1959].
At the end of 28 days, one rat per replicate was
se-lected from the fi ve treatments and sacrifi ced. Theheart,
kidney, spleen, liver and pancreas were removed, weighed and the organ to body ratio was determined.
Statistical analysis
The data were analysed using SPSS/PC + version 15.0 statistical software. Statistical parameters were es-timated with analysis of variance (ANOVA). Differenc-es between means were evaluated by the Duncan
multi-ple range test and signifi cance was accepted at p≤ 0.05.
RESULTS
Proximate and mineral composition of sesame fl our
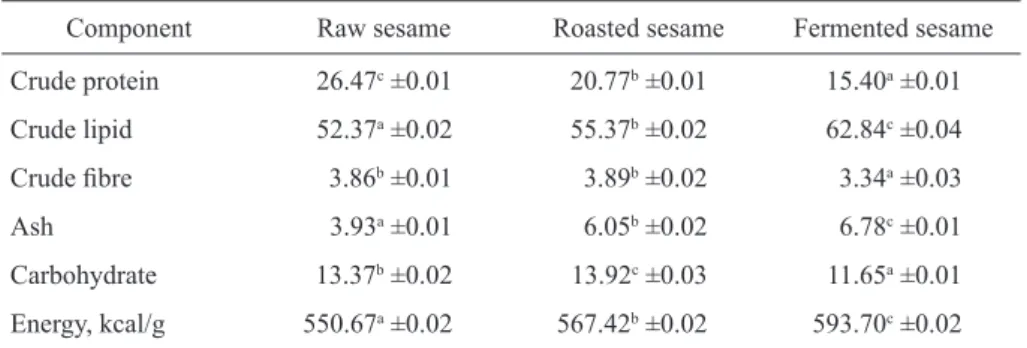
The proximate compositions of raw, roasted and fer-mented sesame are given in Table 2. The protein
con-tent of sesame samples ranged between 26.5 g/100 g
Table 1. Composition of basal diet, g/kg
Ingredient Quantity
Fermented corn fl our 647.5
Glucose 50.0
Sucrose 150.0
Non-nutritive cellulose (microgranular cellulose)
50.0
Vegetable oil 100.0
Vitamin mixture* 20.0
Oyster shell 10.0
Bone meal 20.0
Sodium chloride 2.5
for raw sesame, 20.8 g/100 g for roasted sesame and
15.4g/100 g for fermented sesame. The raw sesame
was signifi cantly higher in protein content when
compared with the roasted and fermented sample
re-spectively (p≤ 0.05). The fat contents of both roasted
(55.4g/100 g) and fermented (62.8 g/100 g) sesame
were higher than the raw sample (52.37 g/100 g).
The ash content of fermented sesame (6.78 g/100g)
was signifi cantly higher than that of the roasted sesame
(6.05 g/100 g) and raw sesame (3.93 g/100 g). A lower
crude fi bre was observed in the fermented sesame than
the raw and roasted sesame respectively (3.34 vs. 3.86,
3.89 g/100 g).The carbohydrate content of fermented
sesame was 11.65 g/100 g which was signifi cantly
lower than13.37 and 13.92 g/100 g for raw and roast-ed sesame respectively. However, the energy value of
fermented sesame (593.70 kcal/g) was signifi cantly
higher than roasted sesame (567.42 kcal/g) and that of raw sample (550.67 kcal/g).
Calcium was the predominant mineral followed by phosphorus, magnesium and potassium while other el-ements were present in comparatively low concentra-tions as given in Table 3. The macro mineral elements
were in a range of calcium (464.97-567.91 mg/100g),
Table 2. Proximate composition of raw, roasted and fermented sesame on dry weight basis (mean ±SD, n = 3), g/100 g
Component Raw sesame Roasted sesame Fermented sesame Crude protein 26.47c ±0.01 20.77b ±0.01 15.40a ±0.01
Crude lipid 52.37a ±0.02 55.37b ±0.02 62.84c ±0.04
Crude fi bre 3.86b ±0.01 3.89b ±0.02 3.34a ±0.03
Ash 3.93a ±0.01 6.05b ±0.02 6.78c ±0.01
Carbohydrate 13.37b ±0.02 13.92c ±0.03 11.65a ±0.01
Energy, kcal/g 550.67a ±0.02 567.42b ±0.02 593.70c ±0.02
Figures across the columns with different letters are signifi cantly different (P≤ 0.05).
Table 3. Mineral composition of raw, roasted and fermented sesame on dry weight basis (mean ±SD, n = 3), mg/100 g
Mineral Raw sesame Roasted sesame Fermented sesame Calcium 464.97a ±0.68 519.70b ±0.57 567.91c ±0.43
Potassium 336.75a ±0.79 461.16b ±1.52 489.43c ±0.57
Phosphorus 442.94a ±0.58 474.08b ±1.00 508.50c ±0.54
Magnesium 399.65a ±1.00 429.43b ±0.93 455.70c ±0.53
Iron 6.42a ±0.02 7.08b±0.12 8.00c ±0.05
Zinc 7.97a ±0.13 10.07b ±0.03 10.39c ±0.06
Manganese 1.50a ±0.06 1.47a ±0.06 5.00b ±1.00
Selenium 0.02a ±0.01 0.01a ±0.01 0.07b ±0.01
Ca/P 1.05a 1.10b 1.12b
Ca/Mg 1.16a 1.21b 1.25b
phosphorus (442.94-508.50 mg/100 g), potassium (336.75-489.43 mg/100 g) and magnesium (399.65--455.70 mg/100 g) respectively. Fermented sesame had the highest concentration of the minerals which
were signifi cantly different from raw and roasted
samples. Nutritionally, the ratio of Ca/P of the fl our
samples range between 1.05 for raw sesame, 1.10 for roasted sesame and 1.12 for fermented sesame. Ca/Mg ratio for raw, roasted and fermented sesame samples were 1.16, 1.21 and 1.25 respectively.
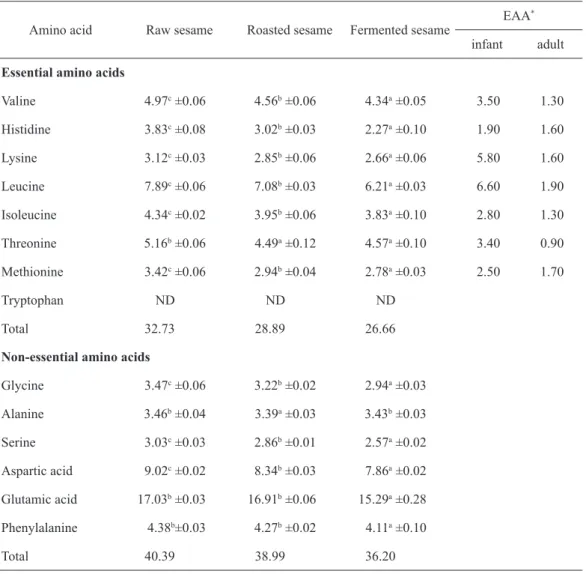
Amino acid composition
The amino acids compositions of raw and pro-cessed sesame are given in Table 4. The total essen-tial amino acids composition of the raw, roasted and fermented sesame samples were 32.73, 28.89 and
26.66 mg/100 g respectively. The highest
concentra-tion of essential amino acids for the raw, roasted and fermented seeds was leucine, while the least concen-tration was lysine. Also, for the non-essential amino acids, the total concentration was 40.39 mg/100 g
Table 4. Amino acid composition of raw, roasted and fermented sesame (mean ±SD, n = 3), mg/100 g protein
Amino acid Raw sesame Roasted sesame Fermented sesame
EAA*
infant adult
Essential amino acids
Valine 4.97c ±0.06 4.56b ±0.06 4.34a ±0.05 3.50 1.30
Histidine 3.83c ±0.08 3.02b ±0.03 2.27a ±0.10 1.90 1.60
Lysine 3.12c ±0.03 2.85b ±0.06 2.66a ±0.06 5.80 1.60
Leucine 7.89c ±0.06 7.08b ±0.03 6.21a ±0.03 6.60 1.90
Isoleucine 4.34c ±0.02 3.95b ±0.06 3.83a ±0.10 2.80 1.30
Threonine 5.16b ±0.06 4.49a ±0.12 4.57a ±0.10 3.40 0.90
Methionine 3.42c ±0.06 2.94b ±0.04 2.78a ±0.03 2.50 1.70
Tryptophan ND ND ND
Total 32.73 28.89 26.66
Non-essential amino acids
Glycine 3.47c ±0.06 3.22b ±0.02 2.94a ±0.03
Alanine 3.46b ±0.04 3.39a ±0.03 3.43b ±0.03
Serine 3.03c ±0.03 2.86b ±0.01 2.57a ±0.02
Aspartic acid 9.02c ±0.02 8.34b ±0.03 7.86a ±0.02
Glutamic acid 17.03b ±0.03 16.91b ±0.06 15.29a ±0.28
Phenylalanine 4.38b±0.03 4.27b ±0.02 4.11a ±0.10
Total 40.39 38.99 36.20
Mean values with the same superscript in a column are not signifi cantly different (P≤ 0.05).
for raw sesame, 38.99 mg/100 g for roasted sesame and 36.20 mg/100 g for the fermented sesame. Glu-tamic acid was the highest concentration of non-essen-tial amino acid while serine was the least.
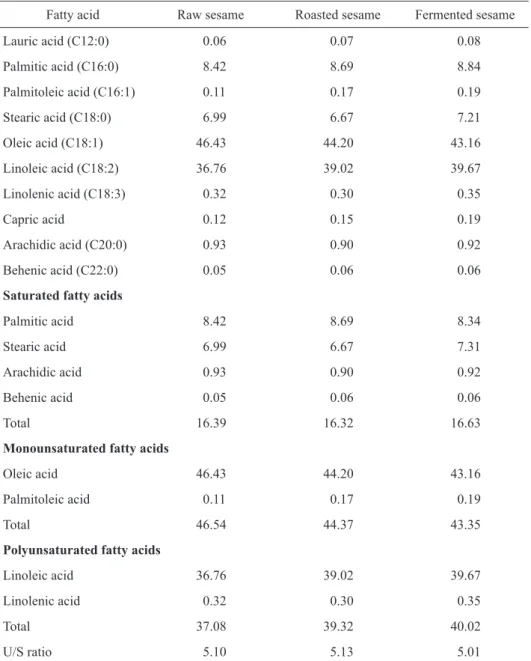
Fatty acid composition
The most abundant fatty acids in raw, roast-ed and fermentroast-ed sesame samples were oleic acid
(46.43, 44.20, and 43.16% respectively), linoleic acid (36.76%, 39.02%, and 39.67% respectively), palmitic acid (8.42%, 8.69%, and 8.84% respectively), and stearic acid (6.99%, 6.67%, and 7.21% respectively) as given in Table 5. There were variations in fatty acid composition as regards raw, roasted and fermented sesame. For the saturated fatty acids (SFA), palmitic acid was the most dominant fatty acids, while behenic
Table 5. Fatty acid composition of raw, roasted and fermented sesame (mean ±SD, n = 3), %
Fatty acid Raw sesame Roasted sesame Fermented sesame
Lauric acid (C12:0) 0.06 0.07 0.08
Palmitic acid (C16:0) 8.42 8.69 8.84
Palmitoleic acid (C16:1) 0.11 0.17 0.19
Stearic acid (C18:0) 6.99 6.67 7.21
Oleic acid (C18:1) 46.43 44.20 43.16
Linoleic acid (C18:2) 36.76 39.02 39.67
Linolenic acid (C18:3) 0.32 0.30 0.35
Capric acid 0.12 0.15 0.19
Arachidic acid (C20:0) 0.93 0.90 0.92
Behenic acid (C22:0) 0.05 0.06 0.06
Saturated fatty acids
Palmitic acid 8.42 8.69 8.34
Stearic acid 6.99 6.67 7.31
Arachidic acid 0.93 0.90 0.92
Behenic acid 0.05 0.06 0.06
Total 16.39 16.32 16.63
Monounsaturated fatty acids
Oleic acid 46.43 44.20 43.16
Palmitoleic acid 0.11 0.17 0.19
Total 46.54 44.37 43.35
Polyunsaturated fatty acids
Linoleic acid 36.76 39.02 39.67
Linolenic acid 0.32 0.30 0.35
Total 37.08 39.32 40.02
acid was the least. The total saturated fatty acid of fer-mented sample (16.63%) was the highest when com-pared with raw sample (16.39%) and roasted sample (16.32%). The ratio of unsaturated fatty acids to satu-rated fatty acids (U/S ratio) ranged between 5.10 for raw sesame, 5.13 for roasted sesame and 5.01 for fer-mented sesame.
Antinutritional composition
The antinutritional compositions of sesame are given in Table 6. The phytate concentration ranged
be-tween 30.00 mg/100 g for raw sesame, 18.33 mg/100g
for roasted sesame and 10.3 mg/100 g fermented ses-ame sample. Oxalate concentration ranged between 85.67 mg/100 g for raw sesame, 36.00 mg/100 g for roasted sesame and 24.95 mg/100 g fermented sesame sample.
Nutritional quality of sesame fl our
The nutritional and histopathological characteris-tics of test animals fed with diets containing raw and processed sesame are given in Table 7. Food intake
of fermented sesame was signifi cantly higher than
the roasted and raw samples (260.13 vs. 254.25 g,
232.20g). The average weight gain of rats fed raw,
roasted and fermented samples were 14.90 g, 23.00g
and 42.58 g respectively compared to casein diet – 85.00 g. The raw sesame exhibits poor FER (0.06) value when compared to control and processed sesa-me. For roasted and fermented sesame included diets, higher FER values were recorded over raw sample.
Correspondingly, the protein effi ciency ratio (PER)
value were 0.90 and 1.62 for roasted and fermented sesame containing diet fed rats, respectively, how-ever, these values were lower compared to that of the casein control diet – 2.64. The net protein
reten-tion (NPR) of the fermented sesame was signifi cantly
higher than that of roasted and raw samples (2.17 vs. 1.47, 1.44). The PRE of fermented sesame was
sig-nifi cantly higher than of raw and roasted samples
respectively (34.72 vs. 23.04, 23.52). The values of feed conversion ratio (FCR) were 15.58, 11.05 and 6.16 for the raw, roasted and fermented sesame sam-ple respectively.
The organ to body ratios of the test animals as
giv-en in Table 7 showed signifi cant heavy weight on the
experimental diets containing roasted and fermented sesame and the control while the organ weight on the diet with raw sesame were relatively low in weight
(p ≤ 0.05).
DISCUSSION
The decrease in protein content as a result of fer-mentation is the direct result of leaching of some protein into the processing water especially during cooking prior to fermentation. Furthermore, this is an indication of increased protein catabolism by the activities of micro organisms responsible for fermen-tation. Similarly, the roasting process accelerates the Maillard reactions and subsequently making the
pro-tein and its amino acids signifi cantly unavailable for
digestion. The reactive carbonyl group of the sugar reacts with the nucleophilic amino group of the amino acid, and forms a complex mixture of molecules
re-sponsible for a range of fl avours. The fermentation
process also resulted in lipid enhancement as some micro organisms have the potential of producing oil during growth on substrate [Akindumila and Glatz 1998]. Thermal treatment of nuts in roasting process leads to changes in active substances in relation to the degree of heat treatment during preparation, which
ex-plains the signifi cant increase in fat content of roasted
sesame compared to that of raw sesame. Crude fat
Table 6. Some antinutritional components of raw, roasted and fermented sesame on dry weight basis (mean ±SD, n = 3), mg/100 g
Component Raw sesame Roasted sesame Fermented sesame Phytate 30.00c ±1.00 18.33b ±0.18 10.33a ±0.50
Oxalate 85.67c ±0.23 36.00b ±1.00 24.95a ±0.18
content of raw and processed sesame were over twice the content of soybean (22.8-23.5%) but comparable
with pumpkin (47.0-49.2%)and groundnut(48-49%)
grown in Nigeria [Salunkhe et al. 1985, Asiegbu 1989,
Adeyeye 2010]. The signifi cant increase in ash content
observed in fermented sesame resulted from metabolic activities of microorganisms during fermentation. The process of roasting also resulted in decrease in mois-ture content that gave rise to increase in ash content.
The observed decrease in fi ber content of fermented
sesame is perhaps due to extended cooking time to soften the seeds which resulted in the degradation and solubilisation of complex polysaccharides within the
fi bre matrix. Lower accessibility of micro organisms
to insoluble fi bre fraction during the fermentation may
also contribute to observe decrease in fi bre content.
However, the crude fi bre content of roasted sesame
was signifi cantly higher than that of fermented sesame
and this could be attributed to heat applied. The de-pletion of carbohydrate during fermentation is an in-dication that they were used as source of energy by
the fermenting micro organisms. Contrary, the roasted sesame recorded higher carbohydrate content than fermented sesame that suggested that roasting causes sesame granules to break down, softens the cellulose,
and makes the starch more available.The increase in
energy value observed with fermentation and roast-ing could be attributed to increase in fat content of the samples as fat contains about twice the food energy values of protein and carbohydrate.
Fermentation resulted in signifi cant increase in
mineral concentrations which is an indication of the conversion of the insoluble reserve foods by en-zymes during fermentation. Also, observed decrease in phytate was responsible for the increase in mineral extractability as the major elements such as phospho-rus, calcium and potassium are parts of the molecular structure of phytic acid and phytin [Duhan et al. 2002]. Similarly, the roasting process increases the digestibil-ity of oilseed that initiated the release and increment
in some minerals.The ratio of Ca/P indicated that raw,
roasted and fermented sesame were good sources of
Table 7.Nutritional characteristics of test animals fed diets of raw, roasted and fermented sesame
Characteristics Casein (control) Raw sesame Roasted sesame Fermented sesame Feed intake, g 346.63d ±0.58 232.20a ±0.25 254.25b ±0.29 260.10c ±0.25
Protein intake, g 34. 66c ±0.50 20.13a ±0.64 25.43b ±0.50 26.01b ±0.04
Mean weight gain, g 85.00d ±1.00 14.90a ±0.76 23.00b ±0.29 42.58c ±0.50
Weight loss, g 14.25a ±0.05 14.25a ±0.05 14.25a ±0.05 14.25a ±0.05
Protein consume, g 4.66d ±0.06 20.13a ±0.04 25.43b ±0.50 26.01c ±0.29
Feed effi ciency ratio 0.24d ±0.01 0.06a ±0.03 0.09b ±0.01 0.16c ±0.02
Protein effi ciency ratio 2.45d ±0.06 0.60a ±0.04 0.90b ±0.01 1.62c ±0.03
Net protein retention 2.86c ±0.06 1.44a ±0.11 1.47a ±0.08 2.17b ±0.08
Protein retention 45.76d ±0.58 23.04a ±0.66 32.52b ±0.57 34.72c ±0.76
Effi ciency
Food conversion ratio 4.08a ±0.11 15.58d ±0.76 11.05c ±0.10 6.16b ±0.25 Organ: body weight ratio
Lungs (× 10−3) 4.56 3.04 3.42 3.86
Spleen (× 10−3) 5.37 3.95 4.38 5.15
Kidney (× 10−3) 6.46 5.42 5.92 6.28
Liver (× 10−3) 41.00 34.08 38.60 39.40
these essential mineral elements as food products con-taining Ca/P ratio of greater than 1.0 is rated good, while less than 0.5 is rated poor [Nieman et al. 1992]. However, the Ca/Mg ratios are low compared with the recommended value of 2.2 for maximum nutritional
benefi ts [Recommended... 1989].
In general, fermented sesame had the lowest con-centrations of amino acids than any of counterparts. This is by virtue of degradation of these amino acids by the fermenting micro organisms and high loss of nitrogen during the process. Similarly, the observed decrease in the roasted sesame compared to raw sesa-me is an indication of Maillard reactions that occurred during roasting process. It has been observed that lit-tle damage occurred during Maillard reactions unless the heat treatment causes the reaction to go beyond the deoxy-ketosyl stage which is often accompanied by
se-vere destruction of lysine and arginine and, to alesser
extent, tryptophan, cystine and histidine [Muller and Tobin 1980]. However, by comparing the essential
amino acid profi le with the FAO/WHO [1990]
refer-ence standard, it was observed that the values of raw and processed sesame were higher than recommended values for infant and adult with the exception of lysine.
The raw sesame was high in monounsaturated fatty acid and polyunsaturated fatty acid composition
aswell as roasted and fermented samples. It is evident
that essential fatty acid such as oleic and linoleic acid are primarily used to produce hormone like substance that regulates a wide range of functions, blood
pres-sure, blood clotting, blood lipid-level and infl
amma-tion response to injury infecamma-tions [Zwarts et al. 1999]; hence the consumption of sesame seed would serve as a good source. The U/S ratio is a clear indication of high amount of unsaturated fatty acid and can be posi-tively considered from the nutritional point of view. In addition, the U/S ratio could be regarded as useful criterium to measure edible oil quality; however, these ratios were higher than value of 3.40 reported for soy-bean grown in Nigeria [Ezeagu et al. 1998].
The phytate and oxalate concentrations of roasted and fermented sesame samples were lower when com-pared with raw sample. However, fermented sample had the lowest concentrations. This is due to the fact that initial soaking, hydration and cooking of the de-hulled seeds had caused leaching of the some of these antinutrients into the processing water before the
actual fermentation process. This is also attributed to diminishing effect of enzymes (phytase and polyphe-nol oxidase) produced by microorganisms during fer-mentation on these antinutrients. The only factor that could account for the lower concentrations of phytate and oxalate in roasted sesame was the heat applied as these antinutrients are thermo labile in nature.
The lower FI in rats fed with raw sesame than con-trol and processed sesame were probably due to the dif-ference between the diets in protein quality and effects of antinutritional compounds. The reduction in the levels of various anti nutritional substances by roast-ing and fermentation might be related to larger FI val-ues compared to raw sesame. The raw sesame exhibits poor FER value when compared to control and pro-cessed sesame since the food and protein intake were low. The lower PER value of roasted and fermented sesame compared to casein may be attributed to loss of available lysine due to processing. Similarly, much of the methionine supplied in the diets could have been
used to synthesise pancreatic enzymes. Inthe present
study, the fermented sesame had intermediate protein quality in that the PER value fell within the range of 1.5-2.0 compared to casein with good protein quality – 2.46 while raw and roasted samples had poor protein quality as described by Friedman [1996].
Organ to body weight is an important index of physiological and pathological status in man and
ani-mals. The fi ndings suggest that the rats fed untreated
(raw sesame) could not effectively utilize the nutri-ents in the diet compared to rats fed roasted and fer-mented sesame respectively. The high concentrations of phytate and oxalate initially observed in the raw sesame hinder the absorption of nutrients which sub-sequently affected the organ weight.
CONCLUSION
Roasted and fermented sesame seeds contain high protein, fat and energy values with nutritionally valu-able minerals comparvalu-able with known protein-rich plant foods, such as groundnut and soybean.
Process-ing also enhanced the amino acid and fatty acid profi le
of sesame. Considering the biological value, ferment-ed sesame exhibitferment-ed better rat growth response and
protein quality compared to roasted sesame. The
contribute to increased production and utilization of the crop for enhanced food and nutrition security in Nigeria and other developing African countries.
ACKNOWLEDGEMENT
Authors are grateful to the management and ad-ministrative authorities of Bowen University for their support.
REFERENCES
Adeyeye E.I., 2010. Effect of cooking and roasting on the amino acid composition of raw groundnut (Arachis hy-pogaea) seed. Acta Sci. Pol., Technol. Aliment. 9 (2), 201-216.
Akindumila F., Glatz B.A., 1998. Growth and oil production of Apiotrichum curvatum in tomato juice. J. Food Prot. 61 (11), 1515-1517.
AOAC, 2005. Offi cial methods of analysis. Association of Offi cial Analytical Chemists Washington, DC.
Asiegbu J.E., 1989. Some biochemical evaluation of fl uted pumpkin seed. J. Sci. Food Agric. 40, 150-155.
Biabani A.R., Pakniyat H., 2008. Evaluation of seed yield--related characters in sesame (Sesamum indicum L.) using factor and path analysis. Pak. J. Biol. Sci. 11, 1157-1160.
Chapman D.G., Castillo R., Campbell J.A., 1959. Evalua-tion of proteins in foods. Canad. J. Biochem. Biophys. 37, 679-683.
Duhan A., Khetarpaul N., Bishnoi S., 2002. Content of phyt-ic acid and HCl-extractability of calcium, phosphorus and iron as affected by various domestic processing and cooking methods. Food Chem. 78, 9-14.
Ekanayake S., Jansz E.R., Nair B.M., 1999. Proximate com-position, mineral and amino acid content of mature Ca-navalia gladiata seeds. Food Chem. 66, 115-119. Ezeagu I.E., Petzke K.J., Lange E., Metgea C.C., 1998. Fat
content and fatty acid composition of oils extracted from selected wild gathered tropical plant seeds from Nigeria. JAOCS 75, 1031-1035.
FAO/WHO, 1990. Protein quality evaluation: Report of a Joint FAO/WHO Expert Consultation. FAO Rome. Federal Institute for Industrial Research. 1990. (FIIR)
Re-port on survey of selected agricultural raw material in Nigeria. Raw Materials Research and Development Council.
Friedman M., 1996. Nutritional value of proteins from dif-ferent food sources. A review. J. Agric. Food Chem. 44, 6-29.
Giami S.Y., Isichei I., 1999. Preparation and properties of fl ours and protein concentrates from raw, fermented and germinated fl uted pumpkin (Telfairia occidentalis Hook) seeds. Plant Foods Hum. Nutr. 54, 67-77. Maga J.A., 1982. Phytates: Its chemistry, occurrence, food
interactions. Nutritional signifi cance and method of analysis. J. Agric. Food Chem. 30 (1), 1-7.
Muller H.G., Tobin G., 1980. Nutrition and food processing. CroomHelm London.
NCRI, 2003. Oil seeds research divisional report. Nation-al CereNation-al Research Institute. AnnuNation-al Review Meeting. June, 10-13.
Nieman D.C., Butterworth D.E., Nieman C.N., 1992. Nutri-tion. WmC. Brown, Dbugye, USA, 237-312.
Padma N., Ramasamy P., Sujatha M., Umesh K.R., 2011. Wild crop relatives: Genomic and breeding resources. DOI: 10.1007/978-3-642-14871-2-16, 261-273. Recommended Dietary Allowances. 1989. National
Re-search Council. National Academic Press Washington D.C.
RMRDC, 2004. Survey report of ten selected agro raw ma-terials in Nigeria. Raw Mama-terials Research and Develop-ment Council. BENISEED (Maiden Edition).
Salunkhe D.K., Kadam S.S., Chavan J.K., 1985. Post-har-vest biotechnology of food legumes. CRC Boca Raton, 132-140.
Sparkman D.H., Stein E.H., Moore L., 1958. Automatic re-cording apparatus for use in chromatography of amino acids. Anal. Chem. 30, 11-91.
Weiss E.A., 2000. Oilseed crops. Blackwell Sci. Oxford. Zwarts L., Savage G.P., McNeil D.L., 1999. Fatty acid
con-tent of New Zealand grown walnuts (Juglans regia L.). Int. J. Food Sci. Nutr. 50, 189-194.
Received – Przyjęto: 9.11.2013 Accepted for print – Zaakceptowano do druku: 14.04.2014
For citation – Do cytowania