Original Article
BIOLOGICAL EVALUATION OF PROTEIN QUALITY OF TWO
HOMEMADE CEREAL/LEGUME MIXTURES AND A COMMERCIAL
WEANING FOOD
Zatolah Asemi1, Mohsen Taghizade2, Shadi Sarahroodi3, Hoda Ahmari Tehran4
1: Food and Drug Administration, Kashan University of Medical Sciences, Kashan, Iran 2: Biochemistry Department, Kashan University of Medical Sciences, Kashan, Iran
3: Pharmacology Department, School of Medicine, Qom University of Medical Sciences, Qom, Iran 4: School of Nursing and Midwifery, Qom University of Medical Sciences, Qom, Iran
Corresponding author:
Assist. Prof. Dr. Shadi Sarahroodi (Pharm.D & PhD), School of Medicine, Golestan St., Second St., Moallem Jonoubi Ave., Qom, Iran. Phone: +98.9123095228, E-mail:sarahroodi@yahoo.com
Bibliographic information of this paper for citing:
Asemi Z., Taghizadeh M., Sarahroodi S., and Ahmari T. H. Biological evaluation of protein quality of two homemade cereal/legume mixtures and a commercial weaning food. Electron. Pysicician 2010, 2: 85-94, Available at:http://www.ephysician.ir/2010/85-94.pdf
Received: 17 May 2010 Reviewed by: Four referees Revised: 10 July 2010 Accepted: 22 July 2010 Published: 02 August 2010 © 2009-2010 Electronic Physician
Introduction:Delivery of low-cost, high-protein foods from local materials for weaning infants is a challenge for developing countries. The quality of nutritional protein of cereal/legume mixtures must be developed with an optimal nutrient profile. The current study was conducted to biologically evaluate (in rats) the protein found in two homemade foods and a commercial weaning food.
Methods:Biological evaluation of the formulations was conducted in 21-day-old weanling Wistar rats, compared with a control diet of casein. The nutrient quality of the weaning foods were monitored by measuring protein efficiency ratio (PER), net protein ratio (NPR), relative net protein ratio (RNPR), true digestibility (TD), apparent digestibility (AD), and food efficiency ratio (FER).
Results: The TD value of one kind of pasta (Sww1+ SBG) was significantly less than casein (P< 0.001) and Humana (P< 0.01). FER value of the first pasta diet (Sww1 + SBG) was significantly less than casein (P<0.01) and Humana (P< 0.05) and its PER value was significantly less than Humana (P<0.01) and casein (P<0.001). There were no significant differences in TD and FER values between the pasta diet (Sww1 + SBG) and Humana group (P>0.05), but its PER was significantly less than Humana (P<0.05).
Conclusions: Our findings showed that the second kind of homemade food (Sww2 + SBG), consisting of a ratio of 50 percent soy bean protein-granulate and 50 percent pasta based on wheat flour protein, has high protein quality and is similar to commercial weaning food. It can support the growth of infants in developing countries during the critical weaning period.
Electronic Physician 2010; Vol 2, Pages 85-94
Keywords:Protein quality; Pasta; Soy bean; Commercial weaning food
INTRODUCTION
Poor growth is caused by some of factors linked to standards of living and the ability to meet basic needs, such as food, housing, and healthcare. Recent findings show that malnutrition is increasing in developing countries, and the major causative factors are infections, unsatisfactory feeding practices, or, more often, a combination of both them (1, 2, and 3). Recent reports from the World Health Organization show that about 60 percent of all deaths occurring among children under 5 years of age in developing countries can be attributed to malnutrition (4). It is also estimated that about 50.6 million children under the age of 5 are malnourished, 90 percent of whom are from developing countries (5).
Intelligence and physical growth are affected by many factors. Although genetics play a prime role, social, environmental, and psychological factors significantly influence growth and intelligence and these can be improved through intervention. Breastfeeding and weaning practices are also important factors (6). When breast milk alone is no longer sufficient, complementary feeding can meet the nutritional requirements of infants. Some other foods and liquids will be needed along with breast milk (5).
In most developing countries,
complementary diets are derived mainly from local staples such as cereals and tubers, with animal proteins used as supplements. However, since animal proteins are expensive, attempts have been made to identify alternative sources of protein, especially from plants (7). In countries where cereals are a staple, mothers usually use wheat, rice, maize, or barley in children’s homemade foods. The protein of cereals revealed that they are deficient in lysine and tryptophan, but provide adequate amounts of methionine and cysteine which are sulphur-containing amino acids (8).
soybean, a commercial weaning food based on rice, and a standard casein diet in rats.
MATERIALS AND METHODS
Test animals
White, male albino Wistar rats, 21-23 days old, weighing 65±5.0 g were obtained from the Pasteur Institute of Iran, Karaj, Iran. The rats were randomly divided into 10 groups, each consisting of eight rats. The rats were individually housed in polypropylene cages with suspended-wire bottoms in an animal care room maintained at 22±2˚C and 50-70 percent relative humidity with alternating 12 hour periods of light and darkness throughout the study.
The weanling rats were fed a standardized laboratory rodent chow for an acclimatization period of six days. Subsequently, they were weighed, and rats at the extremes of the distribution curve were discarded. The remaining animals were distributed into 10 groups of eight animals each, with mean weight differences + 0.5 gr.
Each group was randomly assigned a diet. Feed intake and weight change of the animals were monitored and recorded on alternate days for a study period of 28 days.
Composition of Diets
1. Commercial weaning food
The weaning food (rice milk cereals -Humana®) was selected on the basis of its popularity and market availability. This weaning food was purchased from a drugstore in Kashan, Iran. It was manufactured by Humana (Iran) Limited Tehran and is recommended for infants 6 months old and above.
2. Homemade weaning foods
The two weaning food samples used in this study were prepared from mixed soybean protein, granulate, and pasta based on wheat flour with 11 percent or 12.1 percent protein. These foods are most popularly used for weaning in Iran because they are cheap, readily available, and easy to prepare. Samples of soybean protein, granulate (Sobhan, Iran), pasta based on wheat flour with 11 percent protein (Salam Co., Iran) and pasta based on wheat flour with 12.1 percent protein (Zar Macaroni Co., Iran) were purchased from a supermarket in Kashan, Iran.
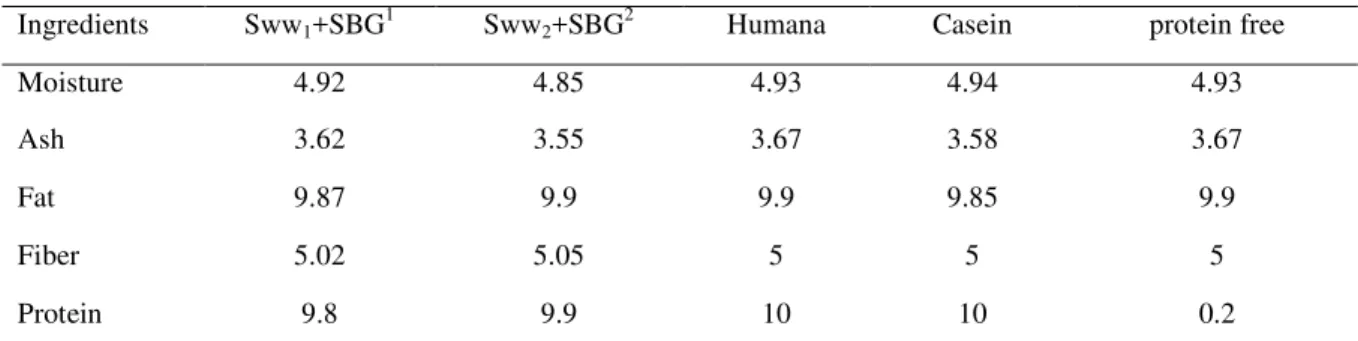
The multi mixes (Sww1+SBG) consisted of a ratio of 35 percent soybean protein-granulate (legume), 30 percent protein gluten (cereals), and 35 percent pasta based on wheat flour protein (cereals). Sww2+ SBG consisted of a ratio of 50 percent soybean protein-glutamate (legume) and 50 percent pasta based on wheat flour protein (cereals) (Table. 1). The mixtures were powdered in a cyclotec mill to pass through a 60mesh sieve to ensure uniform distribution of vitamins and minerals. The diets were prepared for one week at a time and kept in the freezer at –20 ˚C. All diets were analyzed for moisture, Ash, fat, fiber, and protein content (Table 2) (14). One group of rats was fed a purified diet (casein) containing 10 percent protein as control group and three other groups were fed a commercial weaning food and two kinds of pasta based on wheat flour and soybean diets (Table 1).
Growth experiment
every other day. A weighed diet was administered daily and the unconsumed diet was collected, dried, and weighed. Body weight gain during this period was calculated and recorded. Also food and protein intakes for the period were calculated. FER and PER were calculated using the following:
PER = Gain in body weight (g)/ protein consumed (g)
FER = Gain in body weight (g)/ food consumed (g)
Nitrogen balance studies
For nitrogen balance studies, adult male Wistar rats were housed individually in polypropylene cages. In apparent protein digestibility (AD) and true protein digestibility (TD) studies, the rats were randomly divided into five groups, each consisting of eight rats. One group was fed a protein-free diet, three groups received test diets, and the last group was given a reference protein. The experiment was conducted for nine days, including an initial acclimatization period of four days and a subsequent balance period of five days. They were provided water ad libitum, but diets were restricted to 15g dry matter/ day and the change in body weight was recorded. During the last five days, feces and spilled food for each rat were collected separately in open containers (one for the feces and one for the food). At the end of the five-day balance period, the spilled food was air dried for 3 days and the weights of uneaten and spilled food were deducted from the food offered to determine total food intake. Dry feces were placed in a vacuum oven at 1000covernight. It was then weighed, ground, and analyzed for nitrogen. The nitrogen content in urine and feces was estimated by the micro Kjeldahl method.
The data obtained from this experiment was used to calculate AD and TD.
TD = Ni−(NF1−NF2) × 100/ Ni AD= Ni−NF1× 100/ Ni
Ni = Nitrogen intake of animals fed the test diet.
NF1 = Nitrogen excreted in feces of animals fed the test diet.
NF2 = Nitrogen excreted in feces of animals fed the protein-free diet.
The period of study for net protein retention (NPR) was 14 days. In the NPR study, the rats were randomly divided into five groups, each consisting of eight rats. One group was fed a protein-free diet, three groups received test diets, and the last one group was given a reference protein. Gains in weight during this period were calculated and recorded. Food and protein intakes for the period were calculated. NPR was calculated using the following:
NPR = Weight gain of test group + weight loss of protein-free group/Weight of test protein consumed - protein intake of protein-free group
Relative NPR = (mean NPR of test protein) × 100/mean NPR of reference protein
Statistical analysis
RESULTS
The experimental diet and the analyses are illustrated in table 1 and 2. AD and TD of all formulations was determined in a rat bioassay. AD and TD in casein-diet rats
were found to be greater than those of the test groups. Rats fed the commercial weaning food diet had the lowest AD (77.4 percent) and TD (79.6 percent).
Table 1.Composition of the experimental diets (g/100 g diet)
Ingredients Sww1+SBG1 Sww2+SBG2 Humana Casein protein free
Casein & Methionine - - - 10 0.2
Commercial weaning food - - 53 -
-Pasta 35 41.6 - -
-Gluten 4 - - -
-soy bean, granulate 7 9.8 - -
-Sucrose 5 5 5 5 5
Groundnut oil 9.6 9.41 1.5 10 10
Vitamin mixture 1 1 1 1 1
Mineral mixture 4 4 4 4 4
Cellulose 4.2 4.56 5 5 5
DL-methionine - - - 0.3
-Choline chloride 0.2 0.2 0.2 0.2 0.2
Corn starch 29.6 24.43 30.3 64.5 74.6
1. Sww1+SBG1:pasta based on wheat flour- white with amount protein 11%, gluten with amount protein 75% and
soy bean, granulate with amount protein 51%
2. Sww2+SBG2:pasta based on wheat flour- white with 12.1% protein amount & soy bean, granulate with amount
protein 51%
Table 2.analyzed of diets for Moisture, Ash, Fat, Fiber and protein contents (g/100 g diet)
Ingredients Sww1+SBG1 Sww2+SBG2 Humana Casein protein free
Moisture 4.92 4.85 4.93 4.94 4.93
Ash 3.62 3.55 3.67 3.58 3.67
Fat 9.87 9.9 9.9 9.85 9.9
Fiber 5.02 5.05 5 5 5
Protein 9.8 9.9 10 10 0.2
1. Sww1+SBG1:pasta based on wheat flour- white with amount protein 11%, gluten with amount protein 75% and
soy bean, granulate with amount protein 51%
2. Sww2+SBG2:pasta based on wheat flour- white with amount protein 12.1% & soy bean, granulate with amount
Table 3.Protein intake and output and protein digestibility of the commercial and homemade baby food as determined by rat bioassay and enzymatic procedures*
Dietary Group Protein intake (g) Fecal Protein (g) TD in vivo AD in vitro
Sww1+SBG1 3.7 ± 0.7 0.9 ± 0.3 b 79.6 ± 5.8 c 77.4± 5.8 c
Sww2+SBG2 4.4 ± 0.6 0.6 ± 0.2 ac 88.3 ± 4.2 ab 86.2 ± 4.2 ab
Humana 4.3 ± 0.8 0.7 ± 0.1 ac 83.1 ± 3.9 b 80.6 ± 4.2 b
Casein 4.7 ± 0.8 0.4 ± 0.1 ac 91.7 ± 4.1 a 89.8 ± 4.3 a
P value P=0.15 P= 0.001 P<0.0001 P<0.0001
* Mean values (± standard deviation) in the same column not followed by the same letter are significant different (p
≤0.05).
1. Pasta based on wheat flour-white with amount protein 12.1%& soy bean, granulate 2. Pasta based on wheat flour-white with amount protein 11% & soy bean, granulate
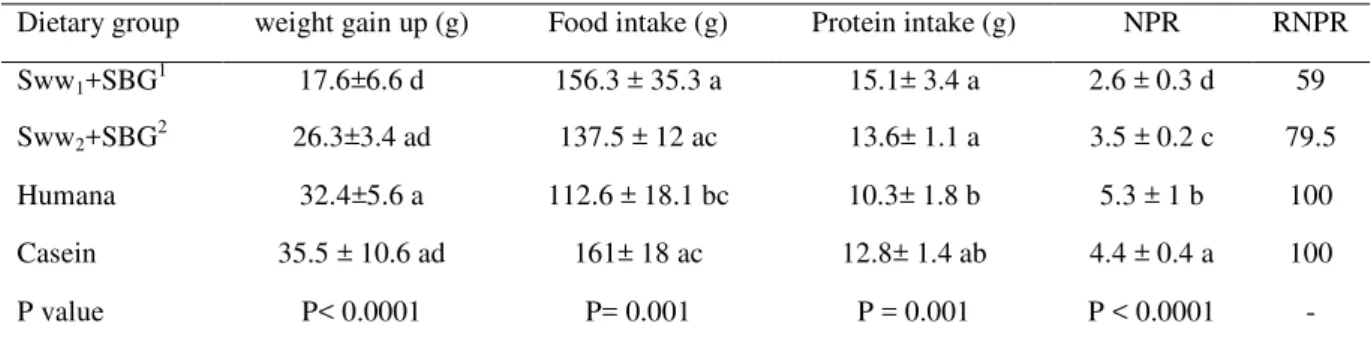
Table 4.Food intake, protein intake and body weight gain of rats, for assessment of NPR and RPNR
Dietary group weight gain up (g) Food intake (g) Protein intake (g) NPR RNPR
Sww1+SBG1 17.6±6.6 d 156.3 ± 35.3 a 15.1± 3.4 a 2.6 ± 0.3 d 59
Sww2+SBG2 26.3±3.4 ad 137.5 ± 12 ac 13.6± 1.1 a 3.5 ± 0.2 c 79.5
Humana 32.4±5.6 a 112.6 ± 18.1 bc 10.3± 1.8 b 5.3 ± 1 b 100
Casein 35.5 ± 10.6 ad 161± 18 ac 12.8± 1.4 ab 4.4 ± 0.4 a 100
P value P< 0.0001 P= 0.001 P = 0.001 P < 0.0001
-* Mean values (± standard deviation) in the same column not followed by the same letter are significant different (p
≤0.05).
1. Pasta based on wheat flour -white with amount protein 12.1% & soy bean, granulate 2. Pasta based on wheat flour-white with amount protein 11% & soy bean, granulate
Table 5.Food intake, protein intake and body weight gain of rats, for assessment of PER and FER
Dietary group weight gain up (g) Food intake (g) Protein intake (g) PER FER
Sww1+SBG1 25.3 ± 13.4 d 305.6 ± 70.5 d 29.7 ± 6.8 a 0.9 ± 0.3 d 0.09± 0.02 c
Sww2+SBG2 51.4 ± 10.5 c 278 ± 36.2 cbd 27.5 ± 3.5 a 1.8 ± 0.1 c 0.18± 0.01 b
Humana 56.4 ± 10.8 bc 269.2 ± 25.8 bd 21.5 ± 2 b 2.6 ± 0.4 b 0.2 ± 0.03 ab
Casein 90.5 ± 15.2 a 368.5 ± 36.7 a 29.4 ± 2.9 a 3 ± 0.2 a 0.2 ± 0.01 a
P value P< 0.0001 P= 0.001 P= 0.002 P<0.0001 P<0.0001
* Mean values (± standard deviation) in the same column not followed by the same letter are significant different (p
≤0.05).
The average protein intake of the rats on the commercial weaning food diet was lower than that of rats on diets prepared from Sww2+SBG and higher than rats eating Sww1+SBG pasta and soybean and the range was between 3.7–4.7g. The average protein output of the rats fed on all diets ranged between 0.4- 0.9g.
This is reflected by the results of the TD measurement. The greater digestibility of the casein diet resulted in a higher retention of dietary nitrogen as indicated by the lower fecal nitrogen output of the rats consuming that diet. The casein diet was significantly more digestible than commercial weaning food using apparent digestibility indices of measurement (Table 3).
In a 14-day study of feed intake, the casein-diet group was the highest (161 g/rat) and it differed significantly (p < 0.05) from that of the Humana diet where food intake ranged from 112.6 to 156.3g per rat. Weight gain and NPR on the Sww1+SBG diet was the lowest (Table 4).
The NPR value of the casein diet (4.4) was higher than other diets. The highest value of NPR for other diet groups was for commercial weaning food (Table 4). Relative NPR values were computed from the NPR data by correcting the casein to 100 [16]. NPR and relative NPR indices accounted for the maintenance requirement of the weanling rat. In a 28-day study of food intake, the casein diet was the highest (368.5 g per rat) and it differed significantly (p<0.05) from other diets where food intake ranged from 269.2 to 305.6g per rat (Table 5). Gains in body weight in the Casein diet group rats were highest (90.5g), and they differed significantly (p<0.05) from other diets. The gains in body weight of the three other groups of rats ranged from 25.3 to 56.4 g per rat. Also, protein intake of the casein
rats was highest. FER was highest for those rats on the casein diet (0.2), which differed significantly (p<0.05) from Sww1+SBG and Sww2+SBG diets. The other diets had FER ranging from 0.09 to 0.2, differing significantly among themselves. The casein diet had a PER of 3 which was significantly (p<0.05) higher than the other diets. PER of other diets ranged from 0.9 to 2.6, respectively (Table 5).
DISCUSSION
Some researchers report that a large population of nursing mothers utilized soybean (15) and pasta as source of protein to feed their children. This trend is caused by the high price of animal proteins and commercial weaning foods that a large proportion of low-income families cannot afford. These mothers typically believe that fortifying local weaning diets with soybean ensures that infants and children consuming these supplemented diets receive their required protein and other nutrients (14, 15, 16, 17, and 18).
white wheat flour with the amount of protein being 12.1% and granulated soybean.
Values for true digestibility of protein in diets from India (54-75 percent), Guatemala (77 percent) and Brazil (78 percent) were considerably lower than the values from our study. TD of North American diets (including vegetarians, 88-94 percent), was higher than ours, suggesting that protein digestibility is of greater concern in diets in some developing countries (25). With respect to NPR and PNPR, the data in Table 4 indicates the distinct superiority of the casein diet over certain pasta and commercial weaning food diets. Relative NPR values were computed by correcting casein to 100. The NPR value of casein diets was 4.4. The highest NPR and RNPR were 5.3 and 123 for commercial weaning food, indicating that it is significantly more efficient (p<0.05) than both kinds of pasta diets and similar to casein in supporting growth and maintenance of weanling rats.
It has also been reported that NPR of different kinds of cowpea (3.2-3.3) (15) and soybean (3-3.1) (15) and the NPR of some different kinds of barley (2.3- 2.6) (11) are lower than our tested diets. However, they are near to both kinds of pasta and soybean diets. The higher NPR for commercial weaning food could be due to its quality of protein not its amount. As Table 5 shows, FER was highest on the casein diet (0.2), which differed significantly from other kinds of diet. The FER of commercial weaning food was higher than both kinds of pasta diets but not significantly. The range of pasta-diet FER was higher than FER reported by Klara and Jood for barley (0.11-0.12) in 1997 (22).
The casein diet had a PER of 3, which was significantly higher than the test diets. The
commercial weaning food had significantly (p<0.05) higher protein quality (2.6) than the pasta diets (0.9-1.8). The PER of all tested diets was higher than barley (1.4-1.5) and lower than cowpea (2.3- 2.4) and cereal/legumes (2.1-2.2).
CONCLUSION
Our findings show that the second kind of homemade food (Sww2 + SBG), consisting of a ratio of 50 percent granulated soybean protein and 50 percent pasta based on wheat flour protein has a higher protein quality and is similar to commercial weaning food. It can support the growth of infants during the critical weaning period in developing countries.
ACKNOWLEDGMENT
The authors would like to thank Dr. Ansam Sawalha from An-Najah National University in Palestine for her kind assistance in preparing this manuscript.
REFERENCES
1. Akinrele IA, Edwards CA. An assessment of the nutritional value of maize-soy mixture “soy-ogi” as a weaning food in Nigeria. Br J Nutr. 1971;26:172-85.
barleys and their isolated protein fractions. Cereal Chem. 1987;64:144-9.
3. Desikachar HSR. Development of weaning foods with high caloric density and low hot-paste viscosity using traditional technologies. Food and Nutritional Bulletin. 1980;2(4): 21-3.
4. Antwi S. Malnutrition: missed opportunities for diagnosis. Ghana Med J 2008;42:101-4.
5. Bethesda MD. Report of the Joint FAO/WHO Expert consultation on protein quality evaluation. FAO/WHO 1989.
6. Faruque AS, Ahmed AM, Ahmed T, Islam MM, Hossain MI, Roy SK, Alam N, Kabir I, Sack DA. Basis for Healthy Children and Mothers in Bangladesh. J Health Popul Nutr. 2008;26(3):325-39.
7. Ihekoronye AI, Ngoddy PO. Integrated Food Science and Technology for the Tropics. London: Macmillan Publishers. 1985;253-7.
8. Ijarotimi OS, Famurewa JAV. Assessment of Chemical Compositions of Soybean Supplemented Weaning Foods and Nutritional Knowledge of Nursing Mothers on Their Utilizations. Pak J of Nutr. 2006; 5(3):218-23.
9. Ikujenlola AV. Quality evaluation of weaning food produced from malted cowpea and rice blends. Knowledge Rev. 2004;8(1):83-7.
10. Jansen GR. Biological evaluation of protein quality. Food Technology: Chicago. 1978;32:52-56.
11. Jood S, Singh M. Amino acid composition and biological evaluation of the protein quality of high lysine barley genotypes. Plant Foods for Human Nutrition. 2001;56:145-55.
12. Klara S, Jood S. Biological Evaluation of Protein Quality of Barley. Food Chem. 1998;61(1):35-39.
13. Lindsay AC, Machado MT, Sussner KM, Hardwick CK, Peterson KE. Infant-feeding Practices and Beliefs about Complementary
Feeding among Low-income Brazilian Mothers: A Qualitative Study. Food Nutr Bull. 2008;29(1):15-24.
14. Ikujenlola VA, Fashakin JB. Bioassay assessment of a complementary diet prepared from vegetable proteins. J Food, agricul environ. 2005;3(3&4):20-22.
15. Mensa-Wilmot Y, Philips RD, Hargrove JL. Protein Quality Evaluation of Cowpea-based extrusion cooked cereal/Legume Weaning Mixtures. Nutr Res. 2001;21:849-57.
16. Marero LM, Payumo EM, Librando EE, Lorez WN, Gopez MO, Homma S. Technology of weaning food formulations prepared from germinated cereals and legumes. J Food Sci. 1988;53:1391-8.
17. Newman CW, Overland M, Newman RK, Bomg K, Pedersen B. Protein quality of new high-lysine barley derived from Riso-1508. Can J Anim Sci. 1990;70:279-85.
18. Nnanyelugo DO. Nutritional status of children in Anambra State: a comprehensive treatise. Nsukka: University of Nigeria Press. 1985.
19. Plahar WA, Hoyle NT. Estimated protein quality of weaning blends from local cereals and legumes. In: Sefa-Dedeh S, editor. The development of high protein-energy foods from grain legumes. Proceedings of the AAU/UNU international seminar held in Accra, Ghana, University of Ghana. 1991;75-87.
20. Potter D. Food Science. AVI Publishing Co. Westport, Connecticut. 1976;530-535.
21. Ruel MT, Brown KH, Caulfield LF. Moving Forward with Complementary Feeding: Indicators and Research Priorities. Food Consumption and Nutrition Division [FCND], International Food Policy Research Institute, USA, 2003;146:1-7.
of Food Science and Technology. Singapore: Institute of Food Science and Technology. 1987;201-205.
23. UNICEF. Children and Women in Ethiopia. Addis Ababa, Ethiopia: The United Nations Children’s Fund.1989.
24. WHO. Physical status: the use of and interpretation of anthropometry. Geneva, Switzerland: World Health Organization. 1985.