Evaluation of the Environmental DNA
Method for Estimating Distribution and
Biomass of Submerged Aquatic Plants
Saeko Matsuhashi1*, Hideyuki Doi1, Ayaka Fujiwara2, Sonoko Watanabe3, Toshifumi Minamoto2
1Graduate School of Simulation Studies, University of Hyogo, Minatojima-minami-machi, Chuo-ku, Kobe, Japan,2Graduate School of Human Development and Environment, Kobe University, Tsurukabuto, Nada-ku, Kobe, Japan,3Graduate School for International Development and Cooperation, Hiroshima University, Kagamiyama, Higashi-Hiroshima, Japan
Abstract
The environmental DNA (eDNA) method has increasingly been recognized as a powerful tool for monitoring aquatic animal species; however, its application for monitoring aquatic plants is limited. To evaluate eDNA analysis for estimating the distribution of aquatic plants, we compared its estimated distributions with eDNA analysis, visual observation, and past distribution records for the submerged speciesHydrilla verticillata. Moreover, we conducted aquarium experiments usingH.verticillataandEgeria densaand analyzed the relationships between eDNA concentrations and plant biomass to investigate the potential for biomass estimation. The occurrences estimated by eDNA analysis closely corresponded to past dis-tribution records, and eDNA detections were more frequent than visual observations, indi-cating that the method is potentially more sensitive. The results of the aquarium
experiments showed a positive relationship between plant biomass and eDNA concentra-tion; however, the relationship was not always significant. The eDNA concentration peaked within three days of the start of the experiment in most cases, suggesting that plants do not release constant amounts of DNA. These results showed that eDNA analysis can be used for distribution surveys, and has the potential to estimate the biomass of aquatic plants.
Introduction
Freshwater ecosystems provide resources and habitats for many species [1]; however, these habitats have been severely damaged by human activities, such as land-use change, hydrologi-cal modification, climate change, and biologihydrologi-cal invasions [2,3]. The biodiversity of freshwater habitats is declining faster than that of terrestrial ecosystems [4–7], and therefore, it is neces-sary to efficiently monitor and assess the changing biodiversity status for their effective management and conservation. Species distributions and biomass are fundamental for under-standing ecosystem and biodiversity status; however, these are difficult to estimate accurately in aquatic environments.
a11111
OPEN ACCESS
Citation:Matsuhashi S, Doi H, Fujiwara A, Watanabe S, Minamoto T (2016) Evaluation of the Environmental DNA Method for Estimating Distribution and Biomass of Submerged Aquatic Plants. PLoS ONE 11(6): e0156217. doi:10.1371/ journal.pone.0156217
Editor:Andrew R. Mahon, Central Michigan University, UNITED STATES
Received:November 10, 2015
Accepted:May 11, 2016
Published:June 15, 2016
Copyright:© 2016 Matsuhashi et al. This is an open access article distributed under the terms of the
Creative Commons Attribution License, which permits unrestricted use, distribution, and reproduction in any medium, provided the original author and source are credited.
Data Availability Statement:All relevant data are within the paper and its Supporting Information files.
Recently, the environmental DNA (eDNA) method for the direct detection of species-spe-cific DNA from water has been recognized as a powerful tool for monitoring aquatic species [8,9]. This method can be used in freshwater ecosystem surveys to (i) detect the distribution of species and (ii) estimate species biomass and/or abundance. The eDNA method has been applied to detect the distribution of several animals such as fish [10,11], amphibians [12,13], reptiles [14,15], mammals [16,17], and crustaceans [18]. It has also been used to estimate bio-mass and/or abundance of species experimentally and practically in several animal species, including common carp [19–21], Rocky Mountain tailed frog [22], Idaho giant salamander [22], common spadefoot toad [16], and great crested newt [16]. In these survey methods, only 0.015–10 L of water is needed for a sample. Therefore, eDNA analysis could reduce sampling costs, time, and labor [23], and be used to efficiently investigate species distributions and abun-dance/biomass in extensive regions.
Although eDNA methods have been developed for animal species, they have not been used extensively for monitoring aquatic plants. Scriveret al. (2015) [24] showed that the DNA of ten aquatic plant species could be detected from experimental aquarium samples, and Fujiwara
et al. (2016) [25] demonstrated that eDNA of a submerged species,Egeria densa, could be detected from natural ponds. These reports showed that eDNA analysis had a potential use in field surveys for aquatic plants; however, more research should be carried out prior to its appli-cation for aquatic plant management. It is generally not easy to observe and identify small pop-ulations of submerged plants in the field, so eDNA methods are expected to increase research efficiency.
In the present study, we examined the use of eDNA analysis to estimate species occurrence and biomass of submerged aquatic plant species. To examine the use for detecting distribution, we conducted field surveys for the submerged speciesHydrilla verticillata, whose distribution is decreasing across Japan. We compared its estimated occurrence by using eDNA analysis, visual observation, and past distribution records. To examine the utility of eDNA method for estimating biomass, we conducted aquarium experiments using two submerged plant species,
H.verticillataandE.densa, to determine the relationships between the species’eDNA concen-trations and their biomass. From the results of these investigations, we assessed the application of the eDNA method to practical distribution surveys and estimations of plant biomass.
Materials and Methods
Study species
H.verticillata(Hydrocharitaceae) is a submerged aquatic plant native to Asia and Australia [26,27]; however, in Japan its distribution has recently become limited. In eastern Japan, it is threatened with local extinction (according to the Local Red Data Books of Tochigi, Ishikawa, and Nagano Prefectures). However, it has expanded its distribution as an invasive species in North America, South America, New Zealand, Africa, and Europe [28,29].
E.densais a submerged aquatic plant native to South America. The species has invaded in North America, Europe, and Asia [30]. It was introduced to Japan in the 1920s [31] and became a common aquatic plant in southwestern Japan in 1980s [32]. Recently,E.densa popu-lations have been observed in many rivers and ponds and have influenced native plants [32]. eDNA detection has been used to successfully detect this species in several ponds [25].
Development of a primers/probe set for
H.
verticillata
To detectH.verticillataDNA by real-time PCR, we developed anH.verticillata-specific prim-ers/probe set. We obtainedmatKsequences forH.verticillataand seven related species distrib-uted in Japan (Blyxa echinosperma,Blyxa japonica,E.densa,Elodea nuttalli,Hydrocharis Competing Interests:The authors have declared
dubia,Ottelia alismoides, andVallisneria asiatica) from the National Center for Biotechnology Information database. By comparing theH.verticillatasequence with those of the seven related species, we designed primers and a probe forH.verticillata(S1 Fig) using Primer Express 3.0 (Life Technologies, Carlsbad, CA, USA). We selected primers that had two or one species-spe-cific nucleotide site(s) within five bases of the 3’-ends of the forward and reverse primers, respectively, because the 3’end of the primers is important for specificity [33]. To determine the specificity of the primers/probe set, we performed real-time PCR using DNA extracted from the leaf tissue ofH.verticillataandE.densaand examined whether amplicon ofH. verti-cillatawas confirmed but that ofE.densawas not.
Field survey to estimate the species distribution
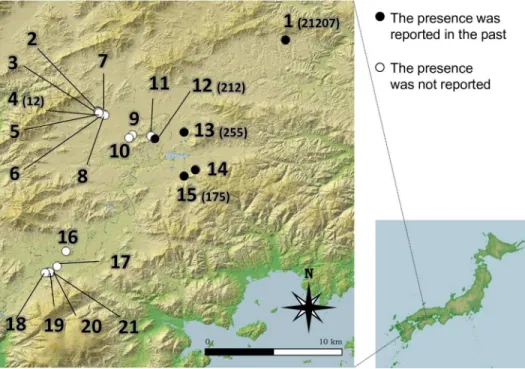
We compared the distribution ofH.verticillatathrough three methods: estimations from the eDNA analysis, visual observation, and past records from 21 ponds in Higashi-Hiroshima City, Japan (Fig 1,Table 1). We conducted the survey from 11 June to 14 October 2014 because it was easier to find this species during summer and autumn. The ponds were selected for their accessibility. In five of the 21 ponds,H.verticillataplants were observed between 1999 and 2002 [34] (Table 1). We collected a single 1 L water sample for eDNA analysis from the surface within 3 m from the shore of each pond. The sampling point at each pond was selected ran-domly. The target species was observed at two ponds (Pond 1 and 12). We visually recognized the target species from the sampling point of Pond 1 where it was dominant, but did not from the sampling point of Pond 12. The plastic sampling bottles were treated with a 0.06% sodium hypochlorite solution before sampling to avoid contamination. The samples were immediately placed in a cool box until they were filtered. We also recorded the presence/absence ofH. verti-cillatabased on visual observations from the shore following the method of Takaharaet al.
Fig 1. The location of 21 ponds in the field survey.The numbers correspond to the site IDs inTable 1. Closed and open circles indicate that the presence ofHydrilla verticillatathat was or was not reported in the past, respectively. The number in parentheses shows the eDNA concentration (copies L-1). This map was constructed using Fundamental Geospatial Data published by the Geographical Survey Institute, Japan.
2013 [11]. A person observedH.verticillatain the water while walking along the shoreline for 10–20 min depending on the shoreline length. We also used the rake toss method at some sites where we could not observe submerged plants clearly due to water turbidity or other reasons. WhenH.verticillatawas observed, we collected samples of leaf tissue. No specific permits were required for the described field studies.
To confirm the results of eDNA detection at the ponds where we detected the eDNA, we con-ducted water sampling and the eDNA analysis again in the next year. On 10th July 2015, we col-lected 1 L water from all the ponds where the eDNA was detected (Ponds 1, 4, 12, 13, and 15).
Each water sample was filtered using two GF/F glass filters (mesh size: ~0.7μm, GE Health-care Japan, Tokyo, Japan) within 6 h of sampling to capture eDNA. The amount of filtered water varied (0.6–1 L) according to the timing when each filter became clogged. All filtration equipment was bleached and rinsed with DNA-free pure water between rounds of filtration to prevent cross-contamination. To determine whether contamination among samples occurred during filtration, 1 L of DNA-free distilled water was filtered after the filtration of the samples on each sampling day as a negative control. The filters were stored at–20°C until DNA extrac-tion. The captured DNA was collected from each filter by a centrifuge by using a Salivette tube (Sarstedt, Nümbrecht, Germany) and extracted with a DNeasy Blood & Tissue Kit (Qiagen, Hilden, Germany) following the method of Uchiiet al. (2016) [35]. DNA was eluted in 100μL of Buffer AE and stored at–20°C until PCR was conducted.
To confirm identification, we also extracted DNA from the collected leaf tissue using a DNeasy Blood & Tissue Kit on a different day to avoid contamination. For each sample, 1–2
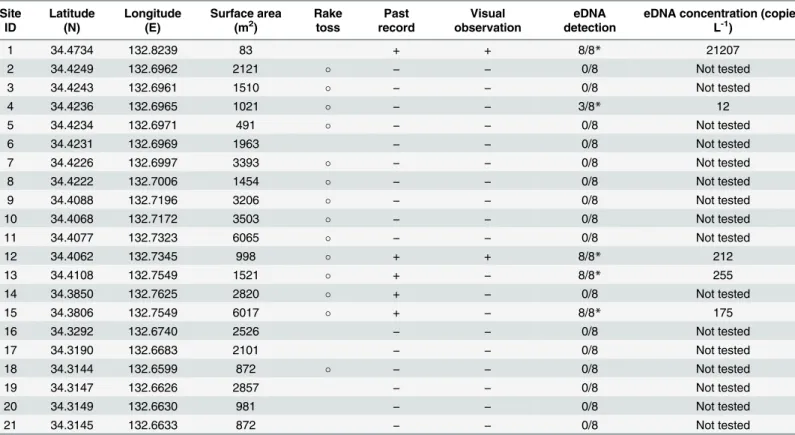
Table 1. Sampling locations, information from past distribution records, and results of the field surveys.Sites where the rake toss method was used are shown with“”. For the past distribution and visual observation from this study,“+”indicates thatHydrilla verticillatawas confirmed visually, and“–”
indi-cates that it was not. eDNA detection shows the number of positives in eight PCR repliindi-cates. An asterisk indiindi-cates a site where eDNA detection was checked and confirmed in the next year. The eDNA concentration at each site was estimated by quantitative real-time PCR.
Site ID Latitude (N) Longitude (E) Surface area (m2)
Rake toss Past record Visual observation eDNA detection
eDNA concentration (copies L-1)
1 34.4734 132.8239 83 + + 8/8* 21207
2 34.4249 132.6962 2121 − − 0/8 Not tested
3 34.4243 132.6961 1510 − − 0/8 Not tested
4 34.4236 132.6965 1021 − − 3/8* 12
5 34.4234 132.6971 491 − − 0/8 Not tested
6 34.4231 132.6969 1963 − − 0/8 Not tested
7 34.4226 132.6997 3393 − − 0/8 Not tested
8 34.4222 132.7006 1454 − − 0/8 Not tested
9 34.4088 132.7196 3206 − − 0/8 Not tested
10 34.4068 132.7172 3503 − − 0/8 Not tested
11 34.4077 132.7323 6065 − − 0/8 Not tested
12 34.4062 132.7345 998 + + 8/8* 212
13 34.4108 132.7549 1521 + − 8/8* 255
14 34.3850 132.7625 2820 + − 0/8 Not tested
15 34.3806 132.7549 6017 + − 8/8* 175
16 34.3292 132.6740 2526 − − 0/8 Not tested
17 34.3190 132.6683 2101 − − 0/8 Not tested
18 34.3144 132.6599 872 − − 0/8 Not tested
19 34.3147 132.6626 2857 − − 0/8 Not tested
20 34.3149 132.6630 981 − − 0/8 Not tested
21 34.3145 132.6633 872 − − 0/8 Not tested
leaves were added to 200μL of TE and ground with a pestle in a 1.5 mL tube. Then 200μL of Buffer AL and 20μL of Proteinase K were added and the sample was incubated at 56°C for 30 min. After incubation, DNA was extracted following the standard protocol of the kit.
Real-time PCR was performed with the StepOnePlus Real-Time PCR System (Life Technol-ogies) using the designed primers/probe set (seeResults). Each TaqMan reaction contained 900 nM each primer, 125 nM TaqMan probe, 10μL of PCR master mix (TaqMan Environ-mental Master Mix 2.0; Life Technologies), and 3μL of the DNA solution, for a final volume of 20μL. The PCR conditions were as follows: 10 min at 95°C, and 55 cycles of 15 s at 95°C, and 1 min at 58°C. Non-quantitative real-time PCR (without a size standard) was performed in eight replicates for each sample to screen forH.verticillata. For the samples that detected the target DNA in at least one of the eight replicates, real-time quantitative PCR was performed in tripli-cate with the same conditions mentioned above except for the addition of a quantification stan-dard, and the mean of the three was treated as the concentration of each sample. To prepare standard DNA for real-time PCR, the target sequence of the amplification was inserted into a pMD20-T vector (Takara, Shiga, Japan), and the vector was digested with EcoRI. A standard curve was constructed using 30,000, 3,000, 300, 30, and 3 copies of the standard DNA per PCR reaction. If the target DNA was not detected in a well, the concentration value of the well was assigned a zero [19]. All PCR plates contained negative controls of ultrapure water in place of template DNA: eight tubes for detection assays and three for quantification assays,
respectively.
To confirm the primer specificity, the PCR amplicons that were positive were directly sequenced after treatment with ExoSAP-IT (USB Corporation, Cleveland, OH, USA). Sequences were determined by a commercial sequencing service (Eurofins Genomics Tokyo, Tokyo, Japan).
We calculated Cohen’s Kappa value to test the correspondence of the ponds whereH. verti-cillatawas reported in the past to those where it was detected by visual observation or by eDNA. Cohen’s Kappa value of 1 implies a perfect match and values less than 1 imply a less-than-perfect match. The analyses were conducted using the function‘kappa2’of the package
‘irr’in R version 3.1.2 [36].
DNA was extracted from the water samples collected in the following year (2015), and the target DNA detection was checked with the same method mentioned above except that the number of PCR replicates was three.
Aquarium experiments
We conducted aquarium experiments to evaluate the relationships between the eDNA concen-trations and the biomass of aquatic plants. Before the start of the experiments,H.verticillata
andE.densa, which were purchased from an aquarium shop for the experiments, were grown in an incubator at 20°C with an 18:6 h light/dark cycle for more than one week. We confirmed the survivorship and growth of the 1 cm plant fragments under these conditions. We cut their stems into 1 or 4 cm lengths after removing the apical meristem, and put each fragment in a clear plastic bag (120 × 85 mm) filled with 250 mL of aged tap water. The next day one 1 cm-, one 4 cm-, and two 4 cm-fragments were each placed in separate clear plastic bags (340 × 240 mm) filled with 2 L of aged tap water and 0.5 mL of the fertilizer Hyponex (N:P:
K = 6%:10%:5%. Hyponex, Osaka, Japan) was added to make three conditions with low, mid-dle, and high biomass. Each condition had six replicates.
To examine the effect on the eDNA detection of other species that grew in the same place, we developed three two-species conditions. In summary, the three conditions consisted ofH.
ofE.densa, a 4 cm-fragment ofH.verticillataand ofE.densa, and two 4 cm-fragments ofH.
verticillataand a 1 cm-fragment ofE.densa(S2 Fig). All conditions were treated in the same way as mentioned above. Four replicates were set for each two-species condition. For a negative control, we prepared a plastic bag with 2 L of aged tap water and nutrition, but without plant fragments. A total of 49 bags, i.e., 32 bags of single-species conditions (6 replicates × 3 condi-tions × 2 species), 12 bags of two-species condicondi-tions (4 replicates × 3 condicondi-tions), and 1 nega-tive control were placed in clear plastic containers and arranged randomly in an incubator (NKsystem, Osaka, Japan) at 20°C with a 18:6 h light/dark cycle. The arrangement was changed every few days to reduce positional bias in the incubator. The photosynthetic photon flux density (PPFD) in the incubator was ca. 130μmol photons m-2s-1. The light source con-sisted of metal halide lamps.
On 1, 2, 3, 5, 7 and 10 d after the start of the experiment, we collected 15 mL of water in 50 mL plastic centrifuge tubes from each water bag. For homogenous distribution of the eDNA concentra-tion, the water was sampled after mixing by pipetting. Immediately after sampling, 1.5 mL of 3 mol L-1sodium acetate (pH 5.2) and 33 mL of absolute ethanol were added to each water sample, and the tubes were stored at–20°C until DNA extraction [37]. The tube was centrifuged at 10,000 ×g
for 1 h at 4°C to precipitate eDNA. The eDNA pellet was eluted with 100μL of TE (pH 8.0). The DNA solution was added to 20μL of proteinase K and incubated at 60°C for 1 h. After heating at 95°C for 10 min, the samples were stored at–20°C until PCR analysis. The DNA extractions and PCR were carried out in different rooms to avoid contamination. After the last sampling, each plant fragment was dried in an oven at 60°C for two days and weighed to obtain its biomass.
Real-time quantitative PCR was performed in triplicate, and the mean value was used for the analyses. Amplification was performed using the previously mentioned conditions. eDNA ofE.densawas amplified using the following primers/probe set: forward primer 5’-CATTTCT CCTTCATTGTATTCTTTCACA-3’, reverse primer 5’-ATTTCTATCTGTATCGTAGCCAC CAA-3’, and TaqMan probe 5’-FAM-CGGGTCCGAACAGAAATGCTTCTCTCT-TAMR A-3’[25]. We used a pUC57 plasmid, to which 373 bp of thetrnL–trnFintergenic spacer region including the target sequence was inserted, as a quantification standard ofE.densa. A standard curve of both species was constructed using 30,000, 3,000, 300, 30, and 3 copies per PCR reaction.
We tested whether the eDNA concentration was correlated with the biomass by using a gen-eralized linear mixed model (GLMM) with a Gaussian distribution and identity link using the function‘lme’of the package‘nlme’in R version 3.1.2. The eDNA concentration was treated as the response variable of GLMM, the biomass and the number of days counted from the start of the experiment were treated as the explanatory variable, and the individual bag was treated as the random effect.
Results
Primers/probe set design and specificity
We designed a primers/probe set forH.verticillatausing selectedmatKsequences (forward primer, 5’- TTTGCGCGAATATGTAGAACTTGT-3’; reverse primer, 5’- GCCAAGGTTTTAGCACAG GAAA-3’; TaqMan MGB probe, 5’- FAM-ATTATTGTAGTGGATCTTCA–NFQ–MGB-3’). We confirmed that this primers/probe set amplified DNA extracted fromH.vertillatatissue but not
E.densatissue, and the DNA sequence of the amplicon was confirmed by direct sequencing.
Estimate of the distribution by eDNA analyses and visual observation
observations from the rake toss trial. The Cohen’s kappa value between the visual observation and the past distribution was 0.504.
We detected eDNA of this species in five ponds (Ponds 1, 4, 12, 13, and 15), including the two ponds where we observed plants. For the samples from four ponds (Pond 1, 12, 13, and 15), the target eDNA was detected in all eight replicates of real-time PCR, while three of eight replicates were positive for Pond 4 (Table 1). By resampling in the following year, we con-firmed that the target DNA was detected from the water samples collected at the five ponds; the detection rate in Ponds 1, 12, 13, and 15 was 3/3 PCR replicates, and that in Pond 4 was 1/3 PCR replicates. All sequences of PCR amplicons from eDNA samples and DNA that was extracted from the leaf tissue corresponded to that ofH.verticillata. Four (Ponds 1, 12, 13, and 15) of the five eDNA-positive ponds corresponded to the ponds whereH.verticillatahas been observed in the past records, and in one pond (Pond 4),H.verticillatahad not been observed in the past survey (Fig 1,Table 1). The Cohen’s kappa value between the eDNA analysis and the past distribution was 0.728, closer to 1 (perfect match) than that between the visual obser-vation and the past distribution.
The concentration ofH.verticillataeDNA in Pond 1, where the species was dominant, was the highest (21,207 ± 2055 copies L-1), and that in Pond 4 was the lowest (12 ± 21 copies L-1) among the five ponds (Table 1). The concentrations in the other ponds ranged from 175 to 255 copies L-1. For this quantification assay, the standard curve (slope:−3.37, y-intercept: 41.003)
had R2= 0.992, and the PCR efficiency was 99.4%.
Relationships between eDNA concentrations and biomass
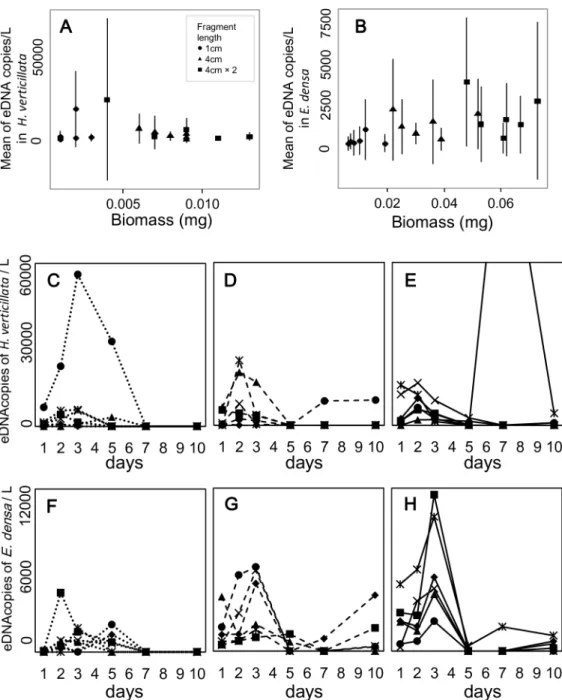
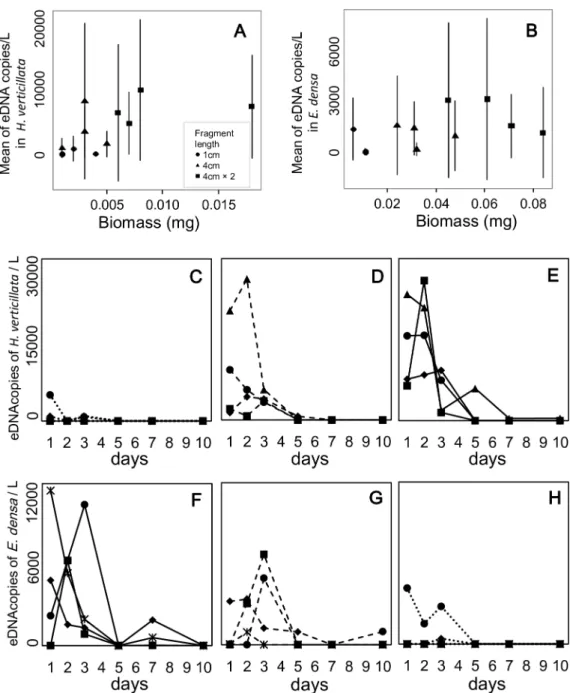
The relationships between eDNA concentration and plant biomass were significantly positive forE.densain single-species conditions (Table 2, Figs2and3). On the other hand, the rela-tionship was not significant forH.verticillatain single-species conditions. In two-species con-ditions, it was marginally significant (P<0.1) for both species.
The eDNA concentrations peaked within 3 d of the start of the experiment in 85% of the experimental bags. The effect of the sampling date on the eDNA concentrations was significant in theE.densakept in the single-species condition and in both species in two-species condi-tions. InH.verticillata, the effect was not significant (Table 2); however, 83% of the bags also had their concentration peaks within 3 d of initiation. eDNA was not detected in all samples. The mean sampling day for undetected samples per water bag was 2.72 ± 1.02 (45.3 ± 17.0%;
N= 18) forH.verticillataand 2.33 ± 1.28 (38.8 ± 21.3%;N= 18) forE.densaunder single-spe-cies conditions, and 3.17 ± 1.70 (52.8 ± 28.3%;N= 12) and 3.17 ± 1.70 (52.8 ± 28.3%;N= 12) under two-species conditions, respectively. In particular, the non-detection rate increased in the latter half of the experiment (5 d, 7 d, and 10 d). However, some bags with low biomass
Table 2. Results of generalized linear mixed models analyzing the effects of biomass and the number of experimental days on the eDNA concen-tration in the aquarium experiments forHydrilla verticillataandEgeria densa. The results of random effect were shown inS2 Table.
Coefficient SE tvalue P
A H.verticillata Biomass -89.684 135.210 -0.663 0.517
Single-species Days -0.281 0.092 -3.040 0.003
condition E.densa Biomass 11.239 4.288 2.621 0.019
Days -0.097 0.026 -3.763 <0.001
B H.verticillata Biomass 172.023 84.492 2.036 0.072
Two-species Days -0.420 0.085 -4.939 <0.001
condition E.densa Biomass 9.729 5.337 1.824 0.098
Days -0.138 0.036 -3.794 <0.001
under two-species conditions did not have detected eDNA throughout the experiment; the number of such bags was one and two per four bags inH.verticillataandE.densa, respectively.
For all PCR reactions in theH.verticillataandE.densaquantification assays, the range of standard curve R2values was 0.984–0.995 and 0.988–0.995, and that of PCR efficiencies was 92.8–106.4% and 91.5–107.6%, respectively. No negative control samples were positive for the target DNA.
Fig 2. The relation between eDNA concentration and biomass, and the temporal changes of eDNA concentration inHydrilla verticillataandEgeria densaunder single-species conditions.The means of eDNA concentration were calculated for each water bag (A, B). The error bars indicate±1 standard deviation. Dotted lines (C, F), dashed lines (D, G), and solid lines (E, H) show the three conditions with low, middle, and high biomass, respectively. Six symbols in each graph indicate the six replicates for each condition. Note that biomass of some samples with a 4 cm-fragment is larger than those with two 4 cm-fragments.
Discussion
In the present study, we developed a specific primers/probe set forH.verticillataand estab-lished a species detection method using eDNA analysis. We successfully showed that eDNA analysis has great potential for determining the distribution of submerged aquatic plants. The use of eDNA to estimate plant biomass was suggested in the aquarium experiment usingH.
verticillataandE.densa. In addition, the experimental results highlighted factors that could influence plant eDNA concentrations and also some issues that need to be addressed.
Fig 3. The relationship between eDNA concentration and biomass, and the temporal changes of eDNA concentration inHydrilla verticillataandEgeria densaunder two-species conditions.The mean eDNA concentrations were calculated for each water bag (A, B). The error bars indicate±1 standard deviation. Dotted lines (C,H), dashed lines (D, G), and solid lines (E, F) show the three conditions with low, middle, and high biomass, respectively. Six symbols in each graph indicate the six replicates for each condition.
Use of eDNA analysis in detecting distributions
The results of our field investigation demonstrated that eDNA analysis could be used for distri-bution detection of the submerged aquatic plant,H.verticillata. We detectedH.verticillatain three of 19 ponds where we did not observe the species visually and two of two ponds where we did. The occurrences detected by eDNA analysis corresponded closely to the past distribution record. These results suggested that it is difficult to accurately detect distributions of sub-merged aquatic plants by a single visual observation, but a single eDNA analysis could provide more information about distributions of aquatic plants.
Although we detected the eDNA but failed to observe plants at Ponds 4, 13 and 15 in the 2014 survey, we confirmed the detection ofH.verticillataDNA again in the following year. In addition, we could visually observe the target species at Pond 15 in August 2015 (Saeko Matsu-hashiet al., personal observation). From these supporting experiments and observations, we concluded that the positive signals in Ponds 4, 13, and 15 were not false positives.
Although Pond 14 had a record ofH.verticillatafrom 1999 to 2002, its eDNA was not detected in our survey in 2014. In Higashi-Hiroshima City, where the field sites were located,
H.verticillatais not regarded as an endangered species even though its distribution recently decreased; Sonoko Watanabeet al. (not published) confirmed the change in its distribution. In 1999 and 2000, they conducted field research at 10 ponds, where this species was observed between 1980 and 1981 [38], and did not observe this species in seven of the 10 ponds (Sonoko Watanabeet al. personal observation). Therefore,H.verticillatamight have disappeared in Pond 14 within the last few decades. In contrast, we detected target eDNA in Pond 4, where the species has not been previously reported. There are two possibilities for this mismatch. One is that the species has been introduced to this pond recently, thus it was not observed in 1999–
2002. The other possibility is that conventional observation methods cannot detect this species in ponds owing to difficulty in surveying the whole water surface, or plant dormancy, or the small population size. Since the concentration of eDNA in this pond was only 12 copies L-1, this low concentration could be indicative of a small population. Although we cannot clarify why this species had not been reported in the past record, our study demonstrates that eDNA surveys can find new occurrences of aquatic plants.
It was reported that eDNA analysis of aquatic plant species was as accurate in detection as visual observations ofE.densa[25]. The present study showed that eDNA analysis was more sensitive than visual observations in detectingH.verticillataoccurrences; the species has been decreasing recently in Japan while increasing in its nonnative range such as the U.S. [39]. This suggests that eDNA analysis could contribute to the conservation and management of sub-merged aquatic plant species such asH.verticillata.
Use of eDNA analysis to estimate biomass
Although the scale of the aquarium experiment was much smaller than that of a natural popu-lation, the results provided basic information on the relationship between eDNA concentration and plant biomass, and showed that eDNA analysis could potentially be used to determine the biomass of aquatic plants. In addition, the results suggested that other factors could influence eDNA concentration. The positive relationship between plant biomass and eDNA concentra-tion was detected inE.densa. However, the effects of biomass were sometimes not significant. Since the differences among replicates in eDNA concentrations could make the significance unclear, it is necessary to examine what factors contribute to individual differences.
be caused by stress from experimental conditions. It is possible that this hypothesis could apply to the present study.
While monitoring temporal changes in eDNA concentration during the experiment, we found that eDNA was occasionally not detected. This provided two important suggestions. First, it is most likely that eDNA of both species can be degraded within a few days under experimental conditions (20°C with an 18:6 h light/dark cycle). For example, we found that the eDNA concentrations decreased from more than 1,000 copies L-1to 0 copies L-1in one or two days in many experimental water bags. This implies that it was possible that most of the eDNA was degraded within only one or two days. This has been observed in animal species, where eDNA degradation proceeded in a short period [40,41]. The high degradation speed should allow us to determine the state of a population in real time and to avoid the misdetection of DNA from species that were historically present. Second, it was suggested that plants may not always release detectable quantities of DNA (Figs2and3). Although previous studies of aquar-ium experiments using animals reported an eDNA concentration increase during the experi-ment or the maintenance of a low level after the peak [16,19,40–43], we could not find cases showing a change from high to zero in a short time period as shown in Figs2and3. Plants and animals differ in as cell and tissue structures, cell functions, and metabolic systems, so the dif-ference in the change of eDNA concentration may be attributable to individual mechanisms that release eDNA. Clarifying how eDNA is released from a plant is important to collect eDNA more efficiently.
The rate of non-detected eDNA increased in the two-species condition. Particularly, in the 1 cm fragments that were added to a bag with two 4 cm fragments of the other species, the rate of non-detected eDNA was higher than that in the other conditions. This result suggests that the amount of released eDNA or the detection rate decreased depending on the habitat water quality and/or the environment or the amount of PCR inhibitors such as polysaccharides. To address this hypothesis, the relationship between the amount of released eDNA and water quality must be examined.
Perspective
The present study demonstrated the potential use of eDNA analysis to estimate occurrence and biomass in submerged aquatic plants. To apply eDNA analysis to field surveys for the management and conservation of aquatic plant populations, the accuracy of the analysis should be improved to avoid risks of misestimates in species distribution, abundance, and biomass. To address the accuracy, preceding studies of animal eDNA can provide useful insights. For exam-ple, water condition, environmental factors, growth process, and the distance between a water sampling point and the location of a target population may influence eDNA concentrations [40,44]. In this study, we selected the sampling points randomly, however, the sampling strat-egy effect should be examined in a future study. Estimates of particle sizes in released eDNA could be important regarding the origin, state, and fate of the eDNA [45,46]. These approaches should be applied to aquatic plants to refine plant eDNA methods and contribute to under-standing the state of natural plant populations.
Supporting Information
S1 Fig. Specificity of a designed PCR primers/probe set forHydrilla verticillatainmatK and sequence information ofH.verticillataand seven related species inmatK.The gray-col-ored parts indicateH.verticillata-specific sites.
S2 Fig. Schematic drawings of the aquarium experiments.Single-species conditions (A) were set up both forH.verticillataandE.densa.
(PDF)
S1 Table. MIQE checklist.
(XLS)
S2 Table. Results of the random effects of generalized linear mixed models analyzing the effects of biomass and the number of experimental days on the eDNA concentration in the aquarium experiments forHydrilla verticillataandEgeria densa.
(DOCX)
Acknowledgments
We thank the Natural Science Center for Basic Research and Development, Hiroshima Univer-sity, for technical support for genetic experiments, and T. Takahara and K. Uchii for help with experiments and their useful comments on this study. This study was supported by the Envi-ronment Research and Technology Development Fund of the Ministry of the EnviEnvi-ronment, Japan (4RF-1302), and by a Research Grant from the Water Resources Environment Center to S. Matsuhashi.
Author Contributions
Conceived and designed the experiments: SM HD AF SW TM. Performed the experiments: SM HD TM. Analyzed the data: SM HD TM. Wrote the paper: SM HD AF SW TM.
References
1. Dudgeon D, Arthington AH, Gessner MO, Kawabata Z-I, Knowler DJ, Lévêque C, et al. Freshwater bio-diversity: importance, threats, status and conservation challenges. Biol Rev Camb Philos Soc. 2006; 81: 163–182. doi:10.1017/S1464793105006950PMID:16336747
2. Carpenter SR, Stanley EH, Vander Zanden MJ. State of the world’s freshwater ecosystems: physical, chemical, and biological changes. Annu Rev Environ Resour. 2011; 36: 75–99. doi: 10.1146/annurev-environ-021810-094524
3. Strayer DL, Dudgeon D. Freshwater biodiversity conservation: recent progress and future challenges. J North Am Benthol Soc. 2010; 29: 344–358. doi:10.1899/08-171.1
4. Ricciardi A, Rasmussent JB. Extinction rates of North American freshwater fauna. Conserv Biol. 1999; 13: 1220–1222.
5. Sala OE, Chapin FS, Armesto JJ, Berlow E, Bloomfield J, Dirzo R, et al. Global biodiversity scenarios for the year 2100. Science. 2000; 287: 1770–1774. doi:10.1126/science.287.5459.1770PMID:10710299
6. Strayer DL, Dudgeon D. Freshwater biodiversity conservation: recent progress and future challenges. J North Am Benthol Soc. 2010; 29: 344–358. doi:10.1899/08-171.1
7. Collen B, Whitton F, Dyer EE, Baillie JEM, Cumberlidge N, Darwall WRT, et al. Global patterns of fresh-water species diversity, threat and endemism. Glob Ecol Biogeogr. 2014; 23: 40–51. doi:10.1111/geb. 12096PMID:26430385
8. Bohmann K, Evans A, Gilbert MTP, Carvalho GR, Creer S, Knapp M, et al. Environmental DNA for wild-life biology and biodiversity monitoring. Trends Ecol Evol. 2014; 29: 1–10. doi:10.1016/j.tree.2014.04. 003PMID:24821515
9. Rees HC, Maddison BC, Middleditch DJ, Patmore JRM, Gough KC. The detection of aquatic animal species using environmental DNA—a review of eDNA as a survey tool in ecology. J Appl Ecol. 2014; 51: 1450–1459. doi:10.1111/1365-2664.12306
10. Minamoto T, Yamanaka H, Takahara T, Honjo MN, Kawabata Z. Surveillance of fish species composi-tion using environmental DNA. Limnology. 2012; 13: 193–197. doi:10.1007/s10201-011-0362-4
12. Ficetola GF, Miaud C, Pompanon F, Taberlet P. Species detection using environmental DNA from water samples. Biol Lett. 2008; 4: 423–5. doi:10.1098/rsbl.2008.0118PMID:18400683
13. Fukumoto S, Ushimaru A, Minamoto T. A basin-scale application of environmental DNA assessment for rare endemic species and closely related exotic species in rivers: a case study of giant salamanders in Japan. J Appl Ecol. 2015; 52: 358–365. doi:10.1111/1365-2664.12392
14. Piaggio AJ, Engeman RM, Hopken MW, Humphrey JS, Keacher KL, Bruce WE, et al. Detecting an elu-sive invaelu-sive species: A diagnostic PCR to detect Burmese python in Florida waters and an assess-ment of persistence of environassess-mental DNA. Mol Ecol Resour. 2014; 14: 374–380. doi: 10.1111/1755-0998.12180PMID:24119154
15. Davy CM, Kidd AG, Wilson CC. Development and validation of environmental DNA (eDNA) markers for detection of freshwater turtles. PLOS ONE. 2015; 10: e0130965. doi:10.1371/journal.pone.0130965 PMID:26200348
16. Thomsen PF, Kielgast JOS, Iversen LL, Wiuf C, Rasmussen M, Gilbert MTP, et al. Monitoring endan-gered freshwater biodiversity using environmental DNA. Mol Ecol. 2012; 21: 2565–2573. doi:10.1111/ j.1365-294X.2011.05418.xPMID:22151771
17. Foote AD, Thomsen PF, Sveegaard S, Wahlberg M, Kielgast J, Kyhn L a., et al. Investigating the poten-tial use of environmental DNA (eDNA) for genetic monitoring of marine mammals. PLOS ONE. 2012; 7: 2–7. doi:10.1371/journal.pone.0041781
18. Deiner K, Altermatt F. Transport distance of invertebrate environmental DNA in a natural river. PLOS ONE. 2014; 9: e88786. doi:10.1371/journal.pone.0088786PMID:24523940
19. Takahara T, Minamoto T, Yamanaka H, Doi H, Kawabata Z. Estimation of fish biomass using environ-mental DNA. PLOS ONE. 2012; 7: e35868. doi:10.1371/journal.pone.0035868PMID:22563411
20. Eichmiller JJ, Bajer PG, Sorensen PW. The relationship between the distribution of Common Carp and their environmental DNA in a small lake. PLOS ONE. 2014; 9: e112611. doi:10.1371/journal.pone. 0112611PMID:25383965
21. Doi H, Takahara T, Minamoto T, Matsuhashi S, Uchii K, Yamanaka H. Droplet digital Polymerase Chain Reaction (PCR) outperforms real-time PCR in the detection of environmental DNA from an inva-sive fish species. Environ Sci Technol. 2015; 49: 5601–5608. doi:10.1021/acs.est.5b00253PMID: 25850372
22. Pilliod DS, Goldberg CS, Arkle RS, Waits LP. Estimating occupancy and abundance of stream amphibi-ans using environmental DNA from filtered water samples. Can J Fish Aquat Sci. 2013; 70: 1123–
1130. doi:10.1139/cjfas-2013-0047
23. Sigsgaard EE, Carl H, Møller PR, Thomsen PF. Monitoring the near-extinct European weather loach in Denmark based on environmental DNA from water samples. Biol Conserv. 2015; 183: 46–52. doi:10. 1016/j.biocon.2014.11.023
24. Scriver M, Marinich A, Wilson C, Freeland J. Development of species-specific environmental DNA (eDNA) markers for invasive aquatic plants. Aquat Bot. 2015; 122: 27–31. doi:10.1016/j.aquabot. 2015.01.003
25. Fujiwara A, Matsuhashi S, Doi H, Yamamoto S, Minamoto T. Use of environmental DNA to survey the distribution of an invasive submerged plant in ponds. Freshw Sci. 2016; 35: 748–754. doi:10.1086/ 685882
26. Cook CDK, Lüönd R. A revision of the genusHydrilla(Hydrocharitaceae). Aquat Bot. 1982; 13: 485–
504. doi:10.1016/0304-3770(82)90074-2
27. Buckingham GR, Bennett CA. Laboratory biology of an immigrant Asian moth,Parapoynx diminutalis
(Lepidoptera: Pyralidae), onHydrilla verticillata(Hydrocharitacea). FLORIDA Entomol. 1996; 79: 353–
363. Available: ISI:A1996VL03300010
28. Madeira PT, Van TK, Steward KK, Schnell RJ. Random amplified polymorphic DNA analysis of the phe-netic relationships among world-wide accessions ofHydrilla verticillata. Aquat Bot. 1997; 59: 217–236. doi:10.1016/S0304-3770(97)00075-2
29. Barnes MA, Jerde CL, Wittmann ME, Chadderton WL, Ding J, Zhang J, et al. Geographic selection bias of occurrence data influences transferability of invasiveHydrilla verticillatadistribution models. Ecol Evol. 2014; 4: 2584–2593. doi:10.1002/ece3.1120PMID:25360288
30. Cook CDK, Urmi-König K. A revision of the genusEgeria(Hydrocharitaceae). Aquat Bot. 1984; 19: 73–
96.
31. Haramoto T, Ikusima I. Life-cycle of Egeria-densa planch, an aquatic plant naturalized in Japan. Aquat Bot. 1988; 30: 389–403.
33. Wilcox TM, McKelvey KS, Young MK, Jane SF, Lowe WH, Whiteley AR, et al. Robust detection of rare species using environmental DNA: the importance of primer specificity. PLOS ONE. 2013; 8: e59520. doi:10.1371/journal.pone.0059520PMID:23555689
34. Higashi–Hiroshima City Board of Education. Aquatic plants of Higashi-Hiroshima. 2011; 108. (in Japanese)
35. Uchii K, Doi H, Minamoto T. A novel environmental DNA approach to quantify the cryptic invasion of non-native genotypes. Mol Ecol Resour. 2016; 16: 415–422. doi:10.1111/1755-0998.12460PMID: 26307935
36. R Core Team. R: A language and environment for statistical computing. R Foundation for Statistical Computing. 2014; Available:http://www.R-project.org/
37. Doi H, Uchii K, Takahara T, Matsuhashi S, Yamanaka H, Minamoto T. Use of droplet digital PCR for estimation of fish abundance and biomass in environmental DNA surveys. PLOS ONE. 2015; 10: e0122763. doi:10.1371/journal.pone.0122763PMID:25799582
38. Shimoda M. Changes in aquatic vegetation and environment in irrigation ponds in the Saijo Basin, Hiro-shima Prefecture, Japan. Veg Sci. 1995; 11: 23–40. (in Japanese with English abstract)
39. Langeland KA. Hydrilla verticillata“The perfect aquatic weed.”Castanea. 1996; 61: 293–304.
40. Barnes MA, Turner CR, Jerde CL, Renshaw MA, Chadderton WL, Lodge DM. Environmental conditions influence eDNA persistence in aquatic systems. Environ Sci Technol. 2014; 48: 1819–1827. doi:10. 1021/es404734pPMID:24422450
41. Maruyama A, Nakamura K, Yamanaka H, Kondoh M, Minamoto T. The release rate of environmental DNA from juvenile and adult fish. PLOS ONE. 2014; 9: e114639. doi:10.1371/journal.pone.0114639 PMID:25479160
42. Klymus KE, Richter CA, Chapman DC, Paukert C. Quantification of eDNA shedding rates from invasive bighead carp Hypophthalmichthys nobilis and silver carp Hypophthalmichthys molitrix q. Biol Conserv. 2014; 183: 77–84. doi:10.1016/j.biocon.2014.11.020
43. Nathan LRM, Simmons MD, Wegleitner BJ, Jerde CL, Mahon AR. Quantifying environmental DNA sig-nals for aquatic invasive species across multiple detection platforms. Environ Sci Technol. 2014; 48: 12800–12806. doi:10.1021/es5034052PMID:25299381
44. Pilliod DS, Goldberg CS, Arkle RS, Waits LP. Factors influencing detection of eDNA from a stream-dwelling amphibian. Mol Ecol Resour. 2014; 14: 109–116. doi:10.1111/1755-0998.12159PMID: 24034561
45. Turner CR, Barnes MA., Xu CCY, Jones SE, Jerde CL, Lodge DM. Particle size distribution and optimal capture of aqueous macrobial eDNA. Methods Ecol Evol. 2014; 5: 676–684. doi:10.1111/2041-210X. 12206