Feeding Behaviour in the Cabbage Looper,
Trichoplusia
ni
Ikkei Shikano*, Jenny S. Cory
Department of Biological Sciences, Simon Fraser University, Burnaby, British Columbia, Canada
Abstract
Evolved resistance to xenobiotics and parasites is often associated with fitness costs when the selection pressure is absent. Resistance to the widely used microbial insecticideBacillus thuringiensis(Bt) has evolved in several insect species through the modification of insect midgut binding sites forBttoxins, and reports of costs associated withBtresistance are common. Studies on the costs ofBt-resistance restrict the insect to a single artificial diet or host-plant. However, it is well documented that insects can self-select appropriate proportions of multiple nutritionally unbalanced foods to optimize life-history traits. Therefore, we examined whether Bt-resistant and susceptible cabbage loopers Trichoplusia ni differed in their nutrient intake and fitness costs when they were allowed to compose their own protein:carbohydrate diet. We found that Bt-resistantT. nicomposed a higher ratio of protein to carbohydrate than susceptibleT. ni. Bt-resistant males exhibited no fitness cost, while the fitness cost (reduced pupal weight) was present in resistant females. The absence of the fitness cost in resistant males was associated with increased carbohydrate consumption compared to females. We demonstrate a sex difference in a fitness cost and a new behavioural outcome associated withBtresistance.
Citation:Shikano I, Cory JS (2014) Genetic Resistance toBacillus thuringiensisAlters Feeding Behaviour in the Cabbage Looper,Trichoplusia ni. PLoS ONE 9(1): e85709. doi:10.1371/journal.pone.0085709
Editor:Juan Luis Jurat-Fuentes, University of Tennessee, United States of America
ReceivedSeptember 17, 2013;AcceptedNovember 30, 2013;PublishedJanuary 21, 2014
Copyright:ß2014 Shikano, Cory. This is an open-access article distributed under the terms of the Creative Commons Attribution License, which permits unrestricted use, distribution, and reproduction in any medium, provided the original author and source are credited.
Funding:Financial support was provided by the Natural Sciences and Engineering Research Council of Canada (NSERC) Discovery Grant to J.S.C. and an NSERC Alexander Graham Bell Canada Graduate Scholarship-Doctoral, the Pacific Century Graduate Entrance Scholarship from the government of BC and a Targeted Special Graduate Entrance Scholarship from SFU to I.S. The funders had no role in study design, data collection and analysis, decision to publish, or preparation of the manuscript.
Competing Interests:The authors have declared that no competing interests exist. * E-mail: [email protected]
Introduction
The evolution of resistance to pathogens, parasites and chemical insecticides is often accompanied by negative pleiotropic effects in the absence of the selection pressure [1–3]. Repeated exposure of insect pests to the toxin-forming bacteriumBacillus thuringiensis(or its Cry toxins expressed in plants) has resulted in the evolution of resistance [4,5]. Fitness costs of insect resistance toBt are well-documented and primarily relate to reductions in survival, fecundity, and mass and increases in development time in comparison to unselected susceptible insects [6–11].
The most common genetic resistance mechanism is the modification or loss of midgut binding proteins (cadherin or aminopeptidase N) forBt Cry toxins, necessary for the toxins to cause death [12]. Changes to midgut binding proteins are hypothesized to increase midgut membrane permeability to toxic phytochemicals and pathogens (cadherin), and interfere with protein digestion (aminopeptidases) [13]. Thus the magnitude of any cost toBtresistance is likely to be influenced by diet. This has been shown to be the case, with the costs ofBt resistance being exacerbated on lower quality or better-defended diets or host plants [14–16].
A key tactic in managing the evolution of resistance toBtrelies on the use of non-Btrefuges [17–19]. If the factors that increase the costs ofBt resistance and their underlying mechanisms were better understood, this knowledge could potentially be used to
Materials and Methods (a) Study Animals
The Bt-resistant T.ni colony was originally collected from a commercial tomato greenhouse in British Columbia, Canada in 2001 [8], and has since been maintained on a wheat-germ based diet at 25uC and 16:8 (L:D) photoperiod. The Bt-resistant strain used in the present study was collected during the same year and from a greenhouse close to the source of the Cry1Ac resistant strain used to determine alterations in aminopeptidase Ns (labeled T2c in [8]). At the time of collection, both strains were highly resistant to DiPel, a formulation of Bt subsp. kurstaki containing Cry1Aa, Cry1Ab, Cry1Ac, and Cry2A [8]. The resistant T. ni colony used in the present study is routinely selected with 40 KIU ml21
diet Bt subsp. kurstaki (Dipel 26DF, Valent Biosciences,
Libertyville, IL, USA) every generation to maintain resistance. The Bt-susceptible colony is a revertant line obtained by not exposing the resistant line toBt[8]. Inbreeding and genetic drift have been minimized by mass mating high numbers of moths (approximately 200 moths) each generation and periodic back-crossing between the resistant and susceptible colonies. The Bt-resistant insects used here were not selected with Bt for one generation (Bt-RU) to avoid possible transgenerational effects [15]. Bt-RU larvae were 55-fold more resistant toBtthan Bt-S at the time of the experiment.
(b) Artificial Diets
Experimental larvae were reared on the wheat-germ based diet (colony diet) from egg-hatch until exposure to the wheat-germ-free, nutritionally-defined treatment diets. ‘Treatment diets’ consisted of altering the ratios of protein (casein) and digestible carbohydrate (sucrose) that made up 60% of the dry weight in the following proportions (% protein: % carbohydrate): 50:10, 30:30, 20:40, 10:50. Other ingredients include Wesson’s salt (5%), cholesterol (1.5%), ascorbic acid (1%), sorbic acid (0.5%), sodium alginate (2.5%), sucrose-free Vanderzant vitamin mix (3.5%), wheat-germ oil (1%) and cellulose (25%) (Bio-Serv, Frenchtown, NJ, USA). Diets were suspended in 1.35% agar solution in a 5:1 agar solution:dry diet ratio. The wheat-germ based ‘colony diet’ also consisted of approximately 60% protein and carbohydrate, and had an approximate protein to digestible carbohydrate ratio of 1 to 1.1.
(c) Choice Experiments
Freshly moulted final (fifth) instar Bt-S and Bt-RU larvae were weighed and individually provided with two pre-weighed nutri-tionally suboptimal but complementary diet blocks, and were allowed to self-compose their diet. Three choice experiments were performed to examine the consistency of self-selected macronutri-ent ratios, with a choice between the highest P:C ratio diet block (50:10) and one of the carbohydrate-biased or equal ratio diet blocks (i) 50:10 & 30:30, ii) 50:10 & 20:40, and iii) 50:10 & 10:50). A total of 72, 75, and 79 larvae were used for each choice experiment, respectively. The diet was replaced each day until pupation; any diet remaining was collected, dried at 50uC for 24 hrs until constant mass, and then weighed. Daily consumption was estimated by calculating the difference between the dry initial and final remaining mass of the diet blocks. The dry initial mass of the diet blocks was estimated by constructing a regression equation with pre-weighed diet blocks without larvae. All larvae successfully pupated, and the date of pupation was recorded. Three days after pupal initiation, pupae were sexed and then dried at 50uC for 48 hrs until constant mass and then weighed.
(d) Statistical Analyses
Differences in the cumulative bivariate consumption of protein and carbohydrate by day between Bt-RU and Bt-S were analysed by multiple analysis of covariance (MANCOVA) using Pillai’s trace statistic. Sex and choice experiment were included as fixed effects and initial larval weight was included as a covariate. Univariate analyses of protein and carbohydrate intake were obtained from post hoc analyses as part of the bivariate MANCOVA. Analysis of covariance (ANCOVA) for pupal weight was performed separately. Pupal weight was squared before analysis to normalize the data. Tukey HSD comparison was used to compare means among treatments. Time to pupation was analyzed using accelerated failure-time analysis using a Weibull distribution. For all analyses, all factors and their interactions were fitted initially in the model and non-significant interactions were removed sequentially to produce the final minimal model. SAS 9.3 was used for all analyses (SAS Institute, 2010, Cary, NC, USA). The dataset has been made available as supporting information (Dataset S1).
Results
When provided with two nutritionally suboptimal but comple-mentary diet blocks, the intake target of Bt-S larvae was more carbohydrate-rich than RU larvae (Figure 1; Table 1). Both Bt-S and Bt-RU showed some flexibility in their final intake targets (Days 0-pupation) as there was a significant effect of choice and a marginally significant three-way interaction between colony, choice and sex. It appears males showed more variation in their nutrient intake target than females. The daily variation in feeding between Bt-S and Bt-RU indicates that Bt-S consumed more food (protein and carbohydrate combined) each day than Bt-RU. The mean nutrient intake targets from the three choice experiments for female Bt-S and Bt-RU were 64.4p:48.4c and 65.6p:30.5c respectively, and 65.0p:48.9c and 68.2p:38.7c respectively for male Bt-S and Bt-RU. Thus, female Bt-RU consumed a higher ratio of protein to carbohydrate than male Bt-RU (2.1:1 and 1.8:1 respectively), while both sexes of Bt-S consumed the same P:C ratio (1.3:1).
This prompted an examination of the univariate ANCOVA results for protein and carbohydrate intake separately. Protein consumption showed a significant three-way interaction that is likely due to differences in the direction of the effects among choice experiments. However, there were no significant differences when compared by Tukey HSD (Figure S1). There were no two-way interactions or main effects in the model either. In contrast, there was no three-way interaction for carbohydrate intake, but a strong effect of colony, sex and their interaction (Table 2). Bt-S larvae consumed more carbohydrate than Bt-RU larvae; however, whereas both Bt-S sexes consumed the same, Bt-RU males consumed more carbohydrate than Bt-RU females (Figure 2). Therefore, the higher P:C ratio composed by Bt-RU resulted from similar protein intake as Bt-S, but reduced carbohydrate intake, more so for females than males.
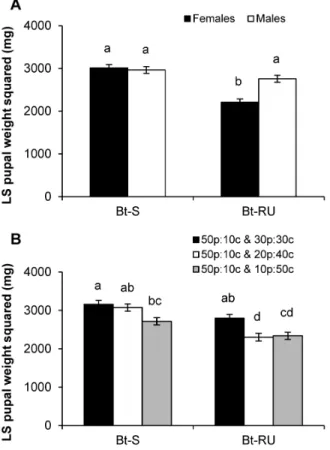
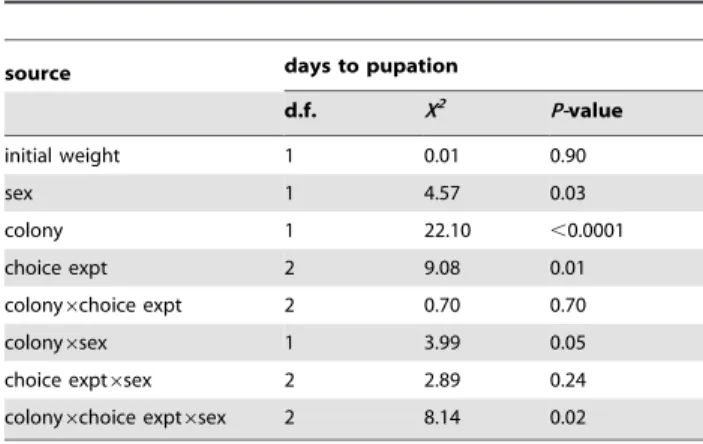
The analysis revealed that Bt-S maintained heavy pupal weights on the two choice experiments that were closer together in nutritional space (50p:10c & 30p:30c and 50p:10c & 20p:40c), while Bt-RU had high pupal weight only when the nutritional space between the two choices was closest (50p:10c & 30p:30c; Figure 3B). Differences in pupal weight could be explained by a significant three-way interaction for the number of days taken to initiate pupation (Table 3). Male Bt-RU achieved the same pupal weight as Bt-S, but consistently fed for a longer period of time to reach pupation (Figure 4). On the other hand, female Bt-RU did
not take longer to develop except on the most skewed diet choice (50p:10c & 10p:50c).
Discussion
Allowing susceptible and resistant T. nilarvae to self-compose their diets in the final instar revealed that while both S and Bt-RU larvae regulate protein and carbohydrate intake, they differed in their nutrient intake target ratio. Bt-RU larvae ate less carbohydrate than Bt-S but similar quantities of protein. Bt-S composed a more balanced diet while Bt-RU larvae composed a
Figure 1.Btresistance alters nutrient intake.Bivariate least squares means (6SE) of protein and carbohydrate intake composed by (A) female and (B) male Bt-S (solid black symbols) and Bt-RU (open symbols). Points along each trajectory correspond to the cumulative intake of protein and carbohydrate over consecutive days. Intake points for day 0–1, days 0–2, and days 0-pupation are shown. The solid gray lines indicate the macronutrient ‘rails’ of each diet block provided. The choices were as follows: 50p:10c & 30p:30c (triangle); 50p:10c & 20p:40c (circle); 50p:10c & 10p:50c (square).
doi:10.1371/journal.pone.0085709.g001
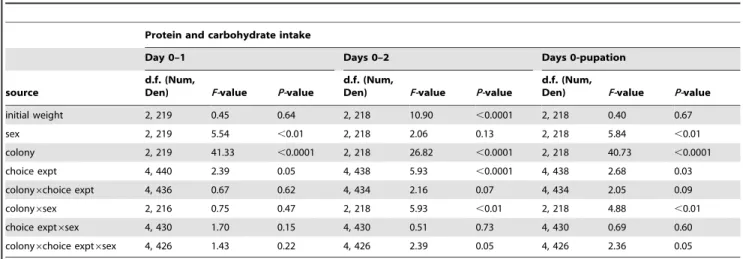
Table 1.MANCOVA analyses for protein and carbohydrate intake by Bt-S and Bt-RU from the three choice experiments.
Protein and carbohydrate intake
Day 0–1 Days 0–2 Days 0-pupation
source
d.f. (Num,
Den) F-value P-value
d.f. (Num,
Den) F-value P-value
d.f. (Num,
Den) F-value P-value
initial weight 2, 219 0.45 0.64 2, 218 10.90 ,0.0001 2, 218 0.40 0.67
sex 2, 219 5.54 ,0.01 2, 218 2.06 0.13 2, 218 5.84 ,0.01
colony 2, 219 41.33 ,0.0001 2, 218 26.82 ,0.0001 2, 218 40.73 ,0.0001
choice expt 4, 440 2.39 0.05 4, 438 5.93 ,0.0001 4, 438 2.68 0.03
colony6choice expt 4, 436 0.67 0.62 4, 434 2.16 0.07 4, 434 2.05 0.09
colony6sex 2, 216 0.75 0.47 2, 218 5.93 ,0.01 2, 218 4.88 ,0.01
choice expt6sex 4, 430 1.70 0.15 4, 430 0.51 0.73 4, 430 0.69 0.60
colony6choice expt6sex 4, 426 1.43 0.22 4, 426 2.39 0.05 4, 426 2.36 0.05
Analyses were performed on each of the three cumulative intake points (days 0–1, 0–2, and 0-pupation). Non-significant interactions (p$0.05) were removed sequentially.
P:C ratio that was considerably higher in protein (1.3p:1c and 2p:1c respectively). Broadly, this is in line with other Lepidoptera, in that protein intake is either equal to or greater than carbohydrate ingestion [20]. The reduced carbohydrate intake was primarily accounted for by resistant females eating less carbohydrate than the males. Reduced food intake by Bt-RU that resulted from reduced carbohydrate intake suggests that the two colonies may be adopting different lifestyles, such that one feeds more and grows faster while the other feeds more conservatively and grows slower. Such differences in lifestyles are often associated with different costs. For example, higher foraging rates can be associated with higher predation rates [25].
Bt-RU females weighed less than the susceptible pupae of both sexes, whereas resistant males weighed the same. However, male Bt-RU achieved a larger pupal weight at the cost of longer development time. Male pupal weight is weakly heritable and positively correlated withBtsusceptibility inBt-resistantT. ni[26]. T. ni males mate multiple times and it is hypothesized that increased weight improves mating success and frequency [26]. Female pupal weight is generally correlated with fecundity; however, no relationship withBtsusceptibility has been found in T. ni[26]. The reduction in female pupal weight found here is thus harder to explain but does suggest an inability to compensate for fecundity loss. One hypothesis is that since feeding on a diet with a
higher P:C ratio increases immune activity and survival after pathogen challenge in another Lepidopteran species [27], selection pressure may be higher for female Bt-RU to surviveBt-challenge, and thus ingest more protein, whereas males are selected for mating success and frequency. Virally-infected caterpillars have shown similar behaviour to improve their likelihood of surviving infection by reducing carbohydrate consumption while
maintain-Figure 2. Sex differences in compensatory feeding.Least squares means (6SE) of total protein and carbohydrate consumption for female and male Bt-S and Bt-RU. Different letters indicate significant differences from Tukey HSD comparison (p,0.05).
doi:10.1371/journal.pone.0085709.g002
Table 2.ANCOVA results for protein and carbohydrate intake, and pupal weight. Non-significant interactions (p$0.05) were removed sequentially.
source protein carbohydrate pupal weight squared
d.f. F-value P-value d.f. F-value P-value d.f. F-value P-value
initial weight 1, 213 0.85 0.36 1, 219 1.6 0.20 1, 219 16.94 ,0.0001
sex 1, 213 2.74 0.10 1, 219 6.28 0.01 1, 219 9.59 ,0.01
colony 1, 213 1.62 0.20 1, 219 90.23 ,0.0001 1, 219 40.77 ,0.0001
choice expt 2, 213 1.27 0.28 2, 219 4.25 0.02 2, 219 10.47 ,0.0001
colony6choice expt 2, 213 2.70 0.07 2, 217 1.07 0.35 2, 217 2.79 0.06
colony6sex 1, 213 1.45 0.23 1, 219 7.05 ,0.01 1, 219 14.11 ,0.001
choice expt6sex 2, 213 1.22 0.30 2, 215 0.30 0.74 2, 215 0.60 0.55
colony6choice expt6sex 2, 213 4.09 0.02 2, 213 1.12 0.33 2, 213 1.79 0.17
colony = susceptible vs. resistant. doi:10.1371/journal.pone.0085709.t002
Figure 3. Potential for compensatory feeding that reduces fitness cost.(A) least squares means (6SE) of square-transformed dry pupal weight for female and male Bt-S and Bt-RU. (B) Least squares means (6SE) of square-transformed dry pupal weight for Bt-S and Bt-RU for each choice experiment. Different letters indicate significant differences from Tukey HSD comparison (p,0.05).
ing protein consumption [28]. Achieving higher immune activity through higher P:C consumption may also allow female Bt-RU to have enhanced immunity in the next generation, as induced Bt tolerance has been shown to be transferred to the next generation by maternal effects [29].
Given that Bt-RU and Bt-S are back-crossed to maintain genetic similarity and have been continuously reared on the same diet, these differences in feeding behaviour are consistent with an association with resistance to Bt. Studies with more lines of Bt-resistant T.ni and other species are needed to confirm the generality of this finding. Investigation of precise mechanisms are beyond the scope of this paper but altered nutrient intake might result from changes in the feedback mechanism that provides information about the nutrient content of food and chemical composition of the haemolymph [30], or from other, as yet identified, mechanisms resulting from the modification of midgut binding proteins [22,23]. It is important to mention that the use of casein as the only protein source (from an animal) and sucrose as the only carbohydrate source are not representative of the natural dietary nutrients forT. ni. Whether the results from this study hold in situations where other protein and carbohydrate
sources are available or on plants differing in nutritional quality warrant further investigation.
Herbivorous insects have access to a variety of plants and plant parts that vary in nutritional content. Our experiments demon-strate that T. ni larvae will self-compose a specific balance of nutrients, and that the evolution of pathogen resistance can change feeding behaviour to alter the nutrient intake target. Consumption of a higher ratio of protein by Bt-RU suggests that they may seek out plant parts higher in protein, adding to their destructive potential as pests by preferentially consuming the reproductive and younger parts of plants that are protein rich. Alternatively, such behaviour might enhance refuge-based resis-tance management strategies if these plant parts contain higher levels of defensive phytochemicals. Understanding the behavioural and physiological outcomes of resistance selection is important in predicting the destructive potential of resistant insects and the success of resistance management strategies.
Supporting Information
Figure S1 Variability of protein intake. Least squares means of the three-way interaction between colony, sex, and choice experiment on Table 2. Same letters indicate no significant differences between means determined by Tukey HSD analysis (p.0.05).
(DOCX)
Dataset S1 Data of nutrient intake and development measures.
(XLS)
Acknowledgments
We gratefully acknowledge the technical assistance of Rafel Sulaiman. We also thank Yves Carrie`re for useful discussion of the data, Kwang P. Lee for statistical advice, Carl Lowenberger and Jerry Ericsson for providing the insect colonies, Michelle Franklin and Michelle Tseng for their comments on an earlier version of the manuscript, and several anonymous reviewers for improving the quality of the manuscript.
Table 3.Accelerated failure-time analysis for days to pupation.
source days to pupation
d.f. X2 P-value
initial weight 1 0.01 0.90
sex 1 4.57 0.03
colony 1 22.10 ,0.0001
choice expt 2 9.08 0.01
colony6choice expt 2 0.70 0.70
colony6sex 1 3.99 0.05
choice expt6sex 2 2.89 0.24
colony6choice expt6sex 2 8.14 0.02
doi:10.1371/journal.pone.0085709.t003
Figure 4. Delayed development accompanies compensatory feeding.Mean number of days (6SE) to initiate pupation in the final instar by Bt-S and Bt-RU.
Author Contributions
Conceived and designed the experiments: IS JSC. Performed the experiments: IS. Analyzed the data: IS JSC. Contributed reagents/ materials/analysis tools: JSC. Wrote the paper: IS JSC.
References
1. Kraaijeveld AR, Godfray HC (1997) Trade-off between parasitoid resistance and larval competitive ability inDrosophila melanogaster.Nature 389: 278–280. 2. Vijendravarma RK, Kraaijeveld AR, Godfray HCJ (2009) Experimental
evolution showsDrosophila melanogasterresistance to a microsporidian pathogen has fitness costs. Evolution 63: 104–114.
3. Martins AJ, Ribeiro CDEM, Bellinato DF, Peixoto AA, Valle D, et al. (2012) Effect of insecticide resistance on development, longevity and reproduction of field or laboratory selectedAedes aegyptipopulations. PLoS ONE 7: e31889. 4. Cory JS, Franklin MT (2012) Evolution and the microbial control of insects.
Evol Appl 5: 455–469.
5. Tabashnik BE, Van Rensburg JB, Carrie`re Y (2009) Field-evolved insect resistance toBtcrops: definition, theory, and data. J Econ Entomol 102: 2011– 2025.
6. Alyokhin AV, Ferro DN (1999) Relative fitness of Colorado potato beetle (Coleoptera:Chrysomelidae) resistant and susceptible to theBacillus thuringiensis Cry3A toxin. J Econ Entomol 92: 510–515.
7. Akhurst RJ, James W, Bird LJ, Beard C (2003) Resistance to the Cry1Acd -Endotoxin ofBacillus thuringiensisin the Cotton Bollworm,Helicoverpa armigera (Lepidoptera: Noctuidae). J Econ Entomol 96: 1290–1299.
8. Janmaat AF, Myers J (2003) Rapid evolution and the cost of resistance to Bacillus thuringiensis in greenhouse populations of cabbage loopers,Trichoplusia ni. Proc Biol Sci 270: 2263–2270.
9. Groeters FR, Tabashnik BE, Finson N, Johnson MW (1994) Fitness costs of resistance toBacillus thuringiensisin the diamondback moth (Plutella xylostella). Evolution 48: 197–201.
10. Oppert B, Hammel R, Throne JE, Kramer KJ (2000) Fitness costs of resistance toBacillus thuringiensisin the Indianmeal moth,Plodia interpunctella. Entomol Exp Appl 96: 281–287.
11. Carrie`re Y, Ellers-kirk C, Biggs R, Higginson DM, Dennehy TJ, et al. (2004) Effects of gossypol on fitness costs associated with resistance toBtcotton in pink bollworm. J Econ Entomol 97: 1710–1718.
12. Pigott CR, Ellar DJ (2007) Role of receptors inBacillus thuringiensiscrystal toxin activity. Microbiol Mol Biol Rev 71: 255–281.
13. Gassmann AJ, Carrie`re Y, Tabashnik BE (2009) Fitness costs of insect resistance toBacillus thuringiensis. Annu Rev Entomol 54: 147–163.
14. Raymond B, Wright DJ, Bonsall MB (2011) Effects of host plant and genetic background on the fitness costs of resistance toBacillus thuringiensis. Heredity 106: 281–288.
15. Janmaat AF, Myers JH (2005) The cost of resistance toBacillus thuringiensisvaries with the host plant ofTrichoplusia ni. Proc Biol Sci 272: 1031–1038.
16. Williams JL, Ellers-Kirk C, Orth RG, Gassmann AJ, Head G, et al. (2011) Fitness cost of resistance toBtcotton linked with increased gossypol content in pink bollworm larvae. PLoS ONE 6: e21863.
17. Carrie`re Y, Crowder DW, Tabashnik BE (2010) Evolutionary ecology of insect adaptation toBtcrops. Evol Appl 3: 561–573.
18. Raymond B, Sayyed AH, Hails RS, Wright DJ (2007) Exploiting pathogens and their impact on fitness costs to manage the evolution of resistance toBacillus thuringiensis. J Appl Ecol 44: 768–780.
19. Carrie`re Y, Ellers-Kirk C, Biggs R, Degain B, Holley D, et al. (2005) Effects of cotton cultivar on fitness costs associated with resistance of pink bollworm (Lepidoptera: Gelechiidae) toBtcotton. J Econ Entomol 98: 947–954. 20. Behmer ST (2009) Insect herbivore nutrient regulation. Annu Rev Entomol 54:
165–187.
21. Raubenheimer D, Simpson SJ, Mayntz D (2009) Nutrition, ecology and nutritional ecology: toward an integrated framework. Funct Ecol 23: 4–16. 22. Wang P, Zhao J-Z, Rodrigo-Simo´n A, Kain W, Janmaat AF, et al. (2007)
Mechanism of resistance toBacillus thuringiensistoxin Cry1Ac in a greenhouse population of the cabbage looper,Trichoplusia ni. Appl Environ Microbiol 73: 1199–1207.
23. Tiewsiri K, Wang P (2011) Differential alteration of two aminopeptidases N associated with resistance toBacillus thuringiensistoxin Cry1Ac in cabbage looper. Proc Natl Acad Sci USA 108: 14037–14042.
24. Zhang X, Tiewsiri K, Kain W, Huang L, Wang P (2012) Resistance of Trichoplusia nitoBacillus thuringiensistoxin Cry1Ac is independent of alteration of the cadherin-like receptor for Cry toxins. PLoS ONE 7: e35991.
25. Werner EE, Anholt BR (1993) Ecological consequences of the trade-off between growth and mortality rates mediated by foraging activity. Am Nat 142: 242–272. 26. Janmaat AF, Myers JH (2011) Genetic variation in fitness parameters associated with resistance to Bacillus thuringiensis in male and female Trichoplusia ni. J Invertebr Pathol 107: 27–32.
27. Lee KP, Cory JS, Wilson K, Raubenheimer D, Simpson SJ (2006) Flexible diet choice offsets protein costs of pathogen resistance in a caterpillar. Proc Biol Sci 273: 823–829.
28. Povey S, Cotter SC, Simpson SJ, Wilson K (2013) Dynamics of macronutrient self-medication and illness-induced anorexia in virally infected insects. J Anim Ecol. DOI: 10.1111/1365-2656.12127.
29. Rahman MM, Roberts HLS, Sarjan M, Asgari S, Schmidt O (2004) Induction and transmission of Bacillus thuringiensis tolerance in the flour mothEphestia kuehniella. Proc Natl Acad Sci USA 101: 2696–2699.