Total 25-Hydroxyvitamin D Concentration
as a Predictor for All-Cause Death and
Cardiovascular Event Risk among Ethnic
Chinese Adults: A Cohort Study in a Taiwan
Community
Kuo-Liong Chien1,2*, Hsiu-Ching Hsu2, Pei-Chun Chen3, Hung-Ju Lin2, Ta-Chen Su2, Ming-Fong Chen2, Yuan-Teh Lee2
1Institute of Epidemiology and Preventive Medicine, College of Public Health, National Taiwan University, Taipei, Taiwan,2Department of Internal Medicine, National Taiwan University Hospital, Taipei, Taiwan,
3Clinical Informatics and Medical Statistics Research Center, Chang Gung University, Taoyuang, Taiwan
Abstract
Background
Evidence of an inverse association between serum 25-hydoroxyvitamin D [25(OH)D] and the risk of all-cause death and cardiovascular disease from prospective studies is inconsis-tent. We tested the relationship between 25(OH)D and the risk among adult ethnic Chinese in Taiwan.
Methods
We conducted a community-based cohort study of 1816 participants (age 60.2±10.2 yrs, 45.0% women) in the Chin-Shan Community Cardiovascular Cohort Study who were free of cardiovascular diseases at baseline and provided 25(OH)D measurements.
Results
During a median 9.6 (interquartile range, 8.8- 10.5) years’follow-up period, totally 263 cases developed cardiovascular death events and 559 participants were documented to death from any cause. As 25(OH)D concentration increased, the incidence rates of cardio-vascular events and all-cause death decreased progressively. 25(OH)D was inversely as-sociated with all-cause death: the adjusted hazard ratio was 0.49 (95% confidence interval [CI], 0.25-0.97) for the third quartile and a significant J-shape relationship was found. The performance measures by integrated discriminative improvement showed significant im-provement after adding 25(OH)D information (0.14%, 95% CI, 0.03-0.31, P=0.050, for all-cause death and 0.32%, 95% CI, 0.02-0.62, P=0.018 for cardiovascular events).
OPEN ACCESS
Citation:Chien K-L, Hsu H-C, Chen P-C, Lin H-J, Su T-C, Chen M-F, et al. (2015) Total 25-Hydroxyvitamin D Concentration as a Predictor for All-Cause Death and Cardiovascular Event Risk among Ethnic Chinese Adults: A Cohort Study in a Taiwan Community. PLoS ONE 10(3): e0123097. doi:10.1371/journal.pone.0123097
Academic Editor:Yiqing Song, Indiana University Richard M. Fairbanks School of Public Health, UNITED STATES
Received:March 18, 2014
Accepted:February 27, 2015
Published:March 25, 2015
Copyright:© 2015 Chien et al. This is an open access article distributed under the terms of the Creative Commons Attribution License, which permits unrestricted use, distribution, and reproduction in any medium, provided the original author and source are credited.
Data Availability Statement:Data are available from the National Taiwan University Hospital Institutional Data Access / Ethics Committee for researchers who meet the criteria for access to confidential data. Data requests may be sent to the corresponding author ([email protected]).
Conclusion
These findings suggested a modest inverse association between 25(OH)D and the risk of all-cause death among diabetic participants and a good predictive factor in the community. Fur-ther studies to investigate the mechanism of vitamin D role on health effect are warranted.
Introduction
The worldwide problem for vitamin D deficiency has been proposed to relate to the risks of common cancers and cardiovascular diseases[1–3], and a level of 25-hydroxyvitamin D [25 (OH)D] less than 30 ng/mL (75 nmol/L) was considered as the deficient status[3]. However, evidence about the relationship between total 25(OH)D concentration and the risk of all-cause death and cardiovascular events was inconsistent, including inverse association[4,5], and null association[6,7]. This inconsistent findings may be attributed to the study participants with high-risk populations[1]. In addition, the relationship between 25(OH)D concentration and all-cause death and cardiovascular events may be nonlinear in the community. Moreover, the community studies based on ethnic Chinese for the protective role of total 25(OH)D concen-tration have been scanty. Therefore, we conducted a community-based cohort to investigate the role of total 25(OH)D concentration on the risk of all-cause death and cardiovascular events in Taiwan. In addition, we evaluated the performance ability of 25(OH)D on predicting the risk.
Materials and Methods
Study design and participants
Details of this cohort study have been published previously[8–10]. Briefly, the Chin-Shan Community Cardiovascular Cohort (CCCC) Study began in 1990 by recruiting 1703 men and 1899 women aged 35 years old and above, in the Chin-Shan township. A total 1816 participants (50.4%) with available serum 25(OH)D measurements was included into the study. Informa-tion about anthropometry, lifestyle, and health condiInforma-tions was assessed by interview quesInforma-tion- question-naires in 2-year cycles up to 2011 and the validity and reproducibility of the collected data and measurements have been reported in detail elsewhere[9]. Incident CVD included coronary heart disease and stroke cases. Incident coronary heart disease cases were defined as fatal coro-nary heart disease and hospitalization due to nonfatal myocardial infarction or percutaneous coronary intervention and coronary bypass surgery. Non-fatal myocardial infarction and hos-pitalizations for coronary intervention and bypass graft surgery was ascertained by the com-bined information from patient interviews and medical record review. Incident stroke cases were ascertained according to the following criteria: a sudden neurological deficit of vascular origin that lasted longer than 24 hours, with supporting evidence from the image study and medical records. All-cause deaths were identified from the official certificate documents, fur-ther verified by house-to-house visits. The National Taiwan University Hospital Committee Review Board approved the study protocol.
Laboratory measurements
We performed the biochemical measurements and fatty acid profiles once in the baseline. The procedures involved in blood sample collection were previously reported.[11] Briefly, all ve-nous blood samples were drawn after a 12-hour overnight fast, immediately refrigerated, and
Competing Interests:The authors have declared
transported within 6 hours to the National Taiwan University Hospital. Serum samples were stored at -70°C before conducting batch assays to determine the levels of total cholesterol, tri-glycerides, and high density lipoprotein cholesterol (HDL-C). To ascertain these levels, stan-dard enzymatic tests for serum cholesterol and triglycerides were employed (Merck 14354 and 14366, Germany, respectively). The supernatants were measured for HDL-C levels following the precipitation of specimens using a reagent of magnesium chloride phosphotungstate (Merck 14993). Low density lipoprotein concentrations were calculated as total cholesterol minus cholesterol in the supernatant obtained through precipitation (Merck 14992).[12]
The serum 25(OH)D levels were evaluated in the hospital laboratory using the 25(OH)-Vi-tamin D direct Elisa Kit (Immunodiagnostik; Bensheim, Germany), based on a competitive ELISA technique with a selected monoclonal antibody that recognizes 25(OH)D. The results were expressed, after point-to-point calculation, as nmol/L (with 1 ng/mL being equivalent to 2.5 nmol/L)[13], and the inter- and intra-assay CV was 7.0%,
Statistical analysis
Participants were categorized on the basis of 25(OH)D quartiles; the ANOVA and the chi-square tests were used to compare means and proportions among the quartiles of 25(OH)D concentration. In addition, the age, gender-adjusted partial Spearman correlation coefficients were estimated between 25(OH)D and various atherosclerotic risk factors.
We plotted the Kaplan-Meir survival curves for all-cause death and cardiovascular events according to categories and stratified according to baseline hypertension and diabetes status. The incidence rates of all-cause death and CVD events were calculated by dividing the number of cases by the number of person-years of the follow-up for each quartile. Quartiles of Vitamin D were entered as dummy variables in a Cox proportional hazards regression model to calcu-late the hazard ratio (HR) and 95% confidence interval (CI), taking the lowest quartile as the reference. Model 1 was adjusted for age groups (35–44, 45–54, 55–64, 65–74,>= 75 years old)
and gender only. Model 2 included additional confounding factors: adjusted for the following baseline covariates: body mass index (<18, 18–20.9, 21–22.9, 23–24.9,>= 25 kg/m2), smoking
(yes/no or abstinence), current alcohol consumption habits (yes/none, defined by>= 1 drink
per day), education level (less than 9 years, at least 9 years), occupation (not employed, manual labor, or office job), and regular exercise (yes/no, defined by>= 30 min per day moderate
in-tensity physical activity, such as walking or cycling). Model 3 included additional clinical vari-ables: baseline hypertension (yes/no, defined by baseline systolic blood pressure>= 140
mmHg, diastolic blood pressure>= 90 mmHg, or on hypertensive medication), type 2
diabe-tes (yes/no, defined as baseline fasting glucose>= 126 mg/dL or on hypoglycemic
medica-tions), continuous LDL cholesterol, and HDL cholesterol values. Tests for trend were derived from the regression model with a single term representative of the medians of each quartile. Due to potential high-risk impacts, we performed subgroup analyses based on baseline hyper-tension and type 2 diabetes. Proportional hazard assumption was not rejected in these Cox models by plotting the log(-log(survival time)) versus log of survival time and including time dependent covariates.
of sensitivity versus 1-specificity (or false-positive rate) for various cutoff definitions of a posi-tive diagnostic test result [16]. Statistical differences in the AUCs were compared using the method of DeLong et al [17]. The AUC was a global summary measure for discrimination be-tween individuals developing outcomes and those who did not[18]. Third, we compared the models by using the net reclassification improvement (NRI) and integrated discrimination im-provement (IDI) statistics [19]. The NRI statistic was based on the reclassification tables and was calculated from a sum of differences between the‘upward’movement in categories for event subjects and the‘downward’movement in those for nonevent subjects. We presented the NRI according to thea prioririsk categories of risk. The IDI can be interpreted as a difference between improvement in average sensitivity and any potential increase in average‘one minus specificity’, and the statistic was a difference in Yates discrimination slopes with and without 25(OH)D information.
In addition, we used the natural cubic splines semi-parametric regression models to exam-ine the relationship between 25(OH)D concentration and the risk of all-cause death and car-diovascular events. Natural cubic splines are smooth polynomial functions that can be used to fit data and accommodate potential changes in the direction of the association between the ex-posure and the outcome of interests, and are constructed of piecewise third-order polynomials which pass through a set of control points and its linear in this tail beyond the boundary knots [20,21]. A SAS macro named‘lgtphcurv9’written by Harvard scholars[22] was used which im-plements natural cubic spline methodology to fit potential non-linear dose-response curves in proportional hazards models. Likelihood ratio tests were performed to test non-linear and linear relationships.
All statistical tests were two-sided and P values<0.05 were considered statistically
signifi-cant. Analyses were performed with SAS version 9.2 (SAS Institute, Cary, NC) and Stata ver-sion 11 (Stata Corporation, College Station, Texas).
Results
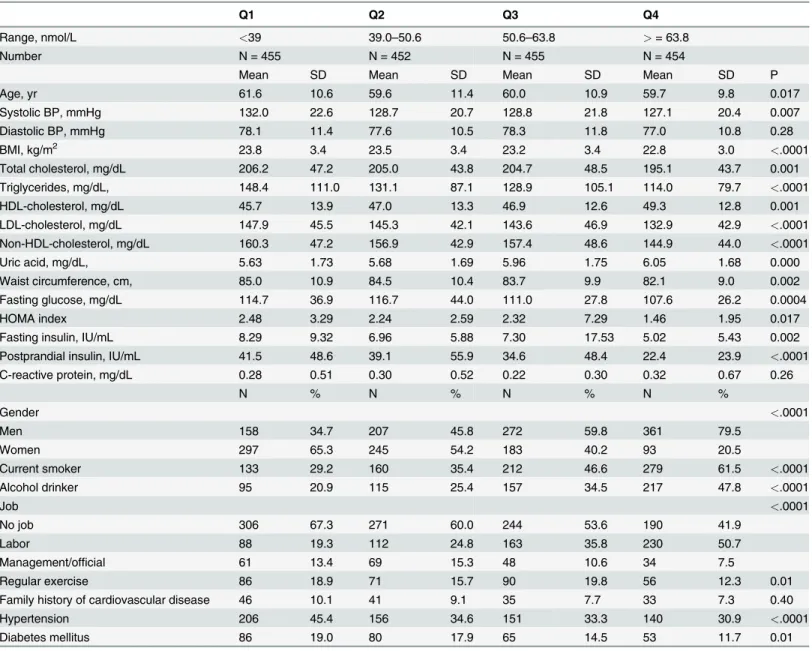
A total of 1816 participants (age 60.210.2 yrs, 45.0% women) were free from cardiovascular dis-eases at baseline and provided serum 25(OH)D measurements were recruited into the study. The participants and non-participants were comparable in baseline characteristics.Table 1 showed the basic characteristics of the study participants according to the 25(OH)D quartiles. Compared with those in the first quartile of 25(OH)D, participants in higher quartiles of 25 (OH)D were likely to be younger, to have a lower systolic blood pressure, body mass index, lower total cholesterol, triglycerides, LDL cholesterol, and a higher HDL cholesterol and uric acid level. In addition, fasting and postprandial glucose and insulin level, as well as HOMA, were lower among participants among higher quartiles. C-reactive protein distribution was similar across the quartiles. In addition, participants in the higher quartiles of 25(OH)D levels were likely to be men, current smoker, drinker, and less likely to have hypertension and diabetes status.
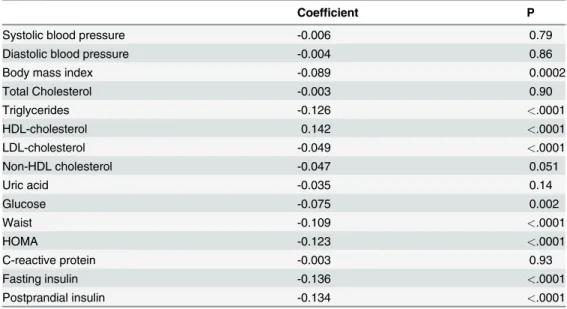
Table 2showed the age, gender-adjusted partial Spearman correlation coefficients showed that significant associations between 25(OH)D and various atherosclerotic risk factors, ranging from -0.136 (P<.0001) for fasting insulin, -0.126 (<.0001) for triglycerides, -0.109 (P<.0001)
for waist, -0.049 (<.0001) for LDL cholesterol, to 0.142(P<.0001) for HDL cholesterol.
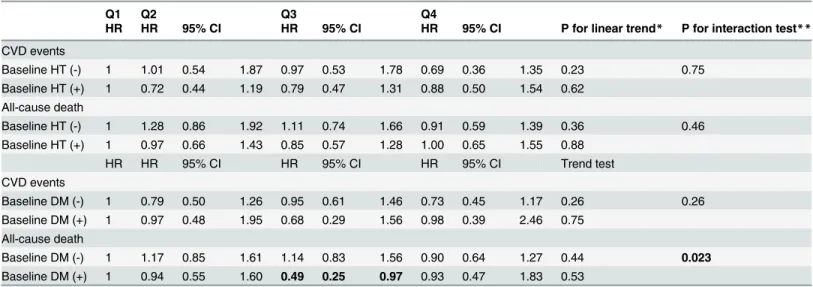
and all-cause death decreased progressively; however, the age and gender-adjusted hazard ra-tios were not significant for CVD events and all-cause deaths (the adjusted hazard rara-tios from the lowest to highest quartile were 1, 0.84, 0.85 and 0.75, test for trend,P= 0.20 for CVD event, and 1, 1.09, 0.95 and 0.90, test for trend,P= 0.38, for all-cause deaths). The patterns of associa-tion between 25(OH)D concentraassocia-tion and the risk of coronary heart disease and stroke events was similar to those of all cardiovascular events, yet not reaching significance level (S1 Table). In the subgroup analysis according to baseline hypertension and diabetes status (Table 4), we found that 25(OH)D concentration was inversely associated with all-cause death: the ad-justed hazard ratio was 0.49 (95% confidence interval [CI], 0.25–0.97) for the third quartile among participants of diabetes. In addition, diabetes played a significant effect modifier for the
Table 1. Basic characteristics of the study participants, specified by 25(OH)D concentration.
Q1 Q2 Q3 Q4
Range, nmol/L <39 39.0–50.6 50.6–63.8 >= 63.8
Number N = 455 N = 452 N = 455 N = 454
Mean SD Mean SD Mean SD Mean SD P
Age, yr 61.6 10.6 59.6 11.4 60.0 10.9 59.7 9.8 0.017
Systolic BP, mmHg 132.0 22.6 128.7 20.7 128.8 21.8 127.1 20.4 0.007
Diastolic BP, mmHg 78.1 11.4 77.6 10.5 78.3 11.8 77.0 10.8 0.28
BMI, kg/m2 23.8 3.4 23.5 3.4 23.2 3.4 22.8 3.0 <.0001
Total cholesterol, mg/dL 206.2 47.2 205.0 43.8 204.7 48.5 195.1 43.7 0.001
Triglycerides, mg/dL, 148.4 111.0 131.1 87.1 128.9 105.1 114.0 79.7 <.0001
HDL-cholesterol, mg/dL 45.7 13.9 47.0 13.3 46.9 12.6 49.3 12.8 0.001
LDL-cholesterol, mg/dL 147.9 45.5 145.3 42.1 143.6 46.9 132.9 42.9 <.0001
Non-HDL-cholesterol, mg/dL 160.3 47.2 156.9 42.9 157.4 48.6 144.9 44.0 <.0001
Uric acid, mg/dL, 5.63 1.73 5.68 1.69 5.96 1.75 6.05 1.68 0.000
Waist circumference, cm, 85.0 10.9 84.5 10.4 83.7 9.9 82.1 9.0 0.002
Fasting glucose, mg/dL 114.7 36.9 116.7 44.0 111.0 27.8 107.6 26.2 0.0004
HOMA index 2.48 3.29 2.24 2.59 2.32 7.29 1.46 1.95 0.017
Fasting insulin, IU/mL 8.29 9.32 6.96 5.88 7.30 17.53 5.02 5.43 0.002
Postprandial insulin, IU/mL 41.5 48.6 39.1 55.9 34.6 48.4 22.4 23.9 <.0001
C-reactive protein, mg/dL 0.28 0.51 0.30 0.52 0.22 0.30 0.32 0.67 0.26
N % N % N % N %
Gender <.0001
Men 158 34.7 207 45.8 272 59.8 361 79.5
Women 297 65.3 245 54.2 183 40.2 93 20.5
Current smoker 133 29.2 160 35.4 212 46.6 279 61.5 <.0001
Alcohol drinker 95 20.9 115 25.4 157 34.5 217 47.8 <.0001
Job <.0001
No job 306 67.3 271 60.0 244 53.6 190 41.9
Labor 88 19.3 112 24.8 163 35.8 230 50.7
Management/official 61 13.4 69 15.3 48 10.6 34 7.5
Regular exercise 86 18.9 71 15.7 90 19.8 56 12.3 0.01
Family history of cardiovascular disease 46 10.1 41 9.1 35 7.7 33 7.3 0.40
Hypertension 206 45.4 156 34.6 151 33.3 140 30.9 <.0001
Diabetes mellitus 86 19.0 80 17.9 65 14.5 53 11.7 0.01
Abbreviation: Q, quartile; SD, standard deviation; BP, blood pressure; HDL, high density lipoprotein; LDL, low density lipoprotein; HOMA, homeostasis model assessment; ANOVA and the chi-square tests were used to compare the means and proportions among quartiles.
Table 2. Partial Spearman correlation coefficients of 25(OH)D and various atherosclerotic risk factor profiles in the study participants.
Coefficient P
Systolic blood pressure -0.006 0.79
Diastolic blood pressure -0.004 0.86
Body mass index -0.089 0.0002
Total Cholesterol -0.003 0.90
Triglycerides -0.126 <.0001
HDL-cholesterol 0.142 <.0001
LDL-cholesterol -0.049 <.0001
Non-HDL cholesterol -0.047 0.051
Uric acid -0.035 0.14
Glucose -0.075 0.002
Waist -0.109 <.0001
HOMA -0.123 <.0001
C-reactive protein -0.003 0.93
Fasting insulin -0.136 <.0001
Postprandial insulin -0.134 <.0001
All were age and gender-adjusted partial Spearman correlation
doi:10.1371/journal.pone.0123097.t002
Table 3. The incidence cases, follow-up person-years, and the rates of cardiovascular disease events and all-cause deaths, and the hazard ratios and 95% confidence intervals of 25(OH)D concentrations in the study participants, according to quartiles.
Vitamin D Q1 Q2 Q3 Q4
Range, nmol/L <39 39.0–50.6 50.6–63.8 >= 63.8
Median, nmol/L 31.9 45.4 56.1 74.8
CVD events
Cases 80 56 67 60
Person-year 3192.6 3406.7 3453.4 3441.2
Rates/1000 py 25.1 16.4 19.4 17.4
HR HR 95% CI HR 95% CI HR 95% CI Trend test
Model 1 1 0.83 0.57 1.20 0.87 0.60 1.25 0.73 0.50 1.08 0.14
Model 2 1 0.84 0.58 1.22 0.86 0.59 1.24 0.74 0.49 1.10 0.15
Model 3 1 0.84 0.57 1.22 0.85 0.58 1.24 0.75 0.49 1.14 0.20
All-cause death
Cases 152 138 139 130
Person-year 3394.91 3548.93 3610.97 3580.81
Rates/1000 py 44.8 38.9 38.5 36.3
HR HR 95% CI HR 95% CI HR 95% CI Trend test
Model 1 1 1.04 0.80 1.36 0.98 0.75 1.28 0.94 0.71 1.24 0.58
Model 2 1 1.03 0.79 1.34 0.95 0.73 1.25 0.89 0.67 1.19 0.36
Model 3 1 1.09 0.83 1.42 0.95 0.72 1.25 0.90 0.67 1.21 0.38
Abbreviation: HR, hazard ratio; CI, confidence interval; CVD, cardiovascular disease; py, person year; Model 1: adjusted for age and gender,
Model 2: Model 1 & additionally adjusted for body mass index, smoking, drinking, marital status, education level, job, and sports activity, Model 3: Model 2 & additionally adjusted for hypertension, diabetes, LDL cholesterol and HDL cholesterol level,
Cox proportional hazards model was applied for estimating the relative risks and 95% confidence intervals
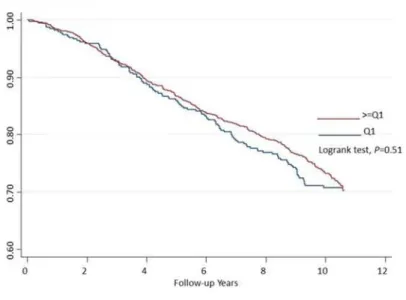
association between 25(OH)D and the risk of all-cause death (interaction p as 0.023), indicat-ing the protective effect of 25 (OH)D on all-cause death indeed varied by the status of diabetes or not.Fig. 1showed the Kaplan-Meir curves for the probability of survival free from all-cause death: 25(OH)D was not related to the death in all participants; however, the lowest quartile of Vitamin had a lower survival rate for all-cause death in the participants with diabetes (the log-rank test,P= 0.047)
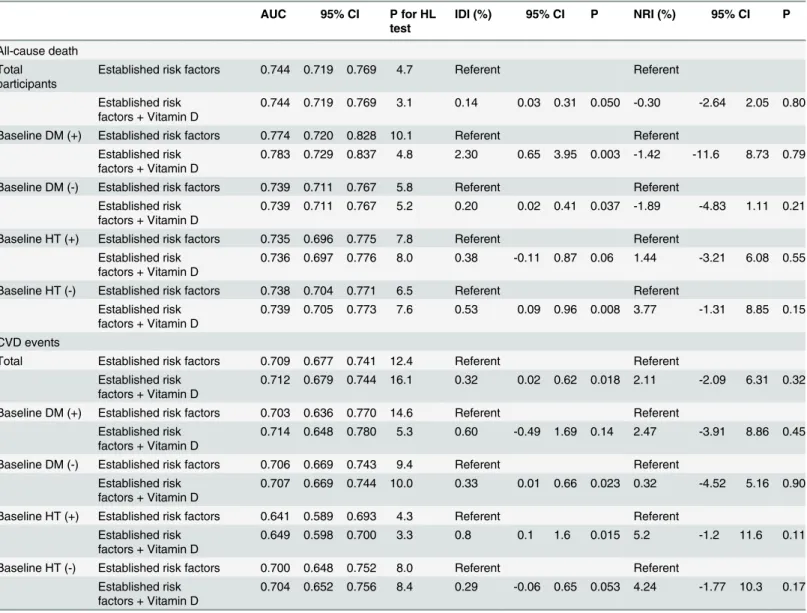
With regards to discriminative ability of 25(OH)D to predict the risk of all-cause death and CVD events, the AUCs were not significantly different between the established risk factor mod-els with and without 25(OH)D (S1 Fig.). In addition, the calibration ability indicated by the Hosmer-Lemeshow test showed an acceptable goodness-of-fit (Table 5). Moreover, we found that the performance measures by integrated discriminative improvement (IDI) showed signif-icant improvement after adding 25(OH)D information (IDI = 0.14%, 95% CI, 0.03–0.31,
P= 0.05, for all-cause death and 0.32%, 95% CI, 0.02–0.62,P= 0.018 for CVD event), which was a weak predictive power of 25(OH)D. The subgroup analyses according to baseline diabe-tes and hypertension status showed consistent improvement of 25(OH)D concentration as the prediction of all-cause death and CVD event risk. We also found that the net reclassification improvement was not statistically significant for the information of 25(OH)D.
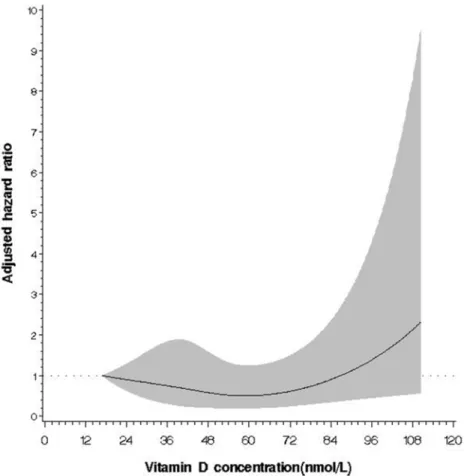
A significant J-shape relation between 25(OH)D concentration and the risk of all-cause death was observed among the diabetic participants (P for non-linear trend = 0.031,Fig. 2), with a null linear association (P for linear trend = 0.07).
Discussion
In this community-based cohort study, we clearly demonstrated that although 25(OH)D was not related to the risk of all-cause death and CVD events, 25(OH)D indeed was a protective
Table 4. Subgroup analysis for the adjusted relative risks and 95% confidence intervals of 25(OH)D concentrations in the study participants, ac-cording to baseline hypertension and diabetes status.
Q1 Q2 Q3 Q4
HR HR 95% CI HR 95% CI HR 95% CI P for linear trend* P for interaction test**
CVD events
Baseline HT (-) 1 1.01 0.54 1.87 0.97 0.53 1.78 0.69 0.36 1.35 0.23 0.75
Baseline HT (+) 1 0.72 0.44 1.19 0.79 0.47 1.31 0.88 0.50 1.54 0.62 All-cause death
Baseline HT (-) 1 1.28 0.86 1.92 1.11 0.74 1.66 0.91 0.59 1.39 0.36 0.46
Baseline HT (+) 1 0.97 0.66 1.43 0.85 0.57 1.28 1.00 0.65 1.55 0.88
HR HR 95% CI HR 95% CI HR 95% CI Trend test
CVD events
Baseline DM (-) 1 0.79 0.50 1.26 0.95 0.61 1.46 0.73 0.45 1.17 0.26 0.26
Baseline DM (+) 1 0.97 0.48 1.95 0.68 0.29 1.56 0.98 0.39 2.46 0.75 All-cause death
Baseline DM (-) 1 1.17 0.85 1.61 1.14 0.83 1.56 0.90 0.64 1.27 0.44 0.023
Baseline DM (+) 1 0.94 0.55 1.60 0.49 0.25 0.97 0.93 0.47 1.83 0.53
Abbreviation: HR, hazard ratio; CI, confidence interval; CVD, cardiovascular disease; adjusted covariates as Model 3 included age, gender, body mass index, smoking, drinking, marital status, education level, job, sports activity, LDL cholesterol and HDL cholesterol level. Baseline hypertension and diabetes status were used as the stratified factor and not included in each subgroup analysis
*Test for trend with a single term representative of the medians of each quartile
**Interaction test by comparing -2 likelihood ratio values between nested model and full model (adding three dummy variables and diabetes or hypertension status)
factor for all-cause death among diabetic participants and the relationship between 25(OH)D and all-cause death was not linear.
Previous literature and current study comparison
Evidence for an inverse association between vitamin D and all-cause death and cardiovascular events was still controversial. Most evidence showed an inverse effect existed for vitamin D as a role for cardiovascular events: Dobnig and colleagues[23] showed that lower 25(OH)D concen-tration quartiles were related to a higher all-cause death (hazard ratio, 2.08, 95% CI, 1.60–2.70) and cardiovascular death (hazard ratio, 2.22, 95% CI, 1.57–3.13) among high-risk patients. In addition, low Vitamin D concentration (less than 50 nmol/L) was highly prevalent (39%) and
Fig 1. Kaplan-Meir survival curves for the risk of all-cause death in the study participants for all participants (upper) and baseline diabetes status (lower).
was associated with an additional 44% (95% CI, 1.01–2.01, p = 0.04) risk for cardiovascular risk [24] among Danish women. Schierbeck[24] also found that vitamin D deficiency (defined by serum 25(OH)D<50 nmol/L) was associated a 1.49 fold (95% CI, 1.16–1.92) for a composite
endpoint, including death, heart failure, myocardial infarction and stroke among Danish women. Moreover, Liu and colleagues showed that 25(OH)D less than 50 nmol/L was associat-ed with a 1.40 fold risk (95% CI, 1.17–1.68) for all-cause death (P<0.001)[5] among adults in
USA. Among 18225 men in the Health Professionals Follow-up Study with 10 years of follow up, Giovannucci and colleagues[4] used the 2:1 matched nested case-control study design and showed that lower 25(OH) D concentration (<= 37.5 nmol/L was associated with a 2.42 fold
Table 5. Improvement in discrimination performance and calibration for risk prediction of cardiovascular events and all-cause death in the multi-variate-adjusted model after including 25(OH)D concentrations.
AUC 95% CI P for HL test
IDI (%) 95% CI P NRI (%) 95% CI P
All-cause death Total
participants
Established risk factors 0.744 0.719 0.769 4.7 Referent Referent
Established risk factors + Vitamin D
0.744 0.719 0.769 3.1 0.14 0.03 0.31 0.050 -0.30 -2.64 2.05 0.80
Baseline DM (+) Established risk factors 0.774 0.720 0.828 10.1 Referent Referent Established risk
factors + Vitamin D
0.783 0.729 0.837 4.8 2.30 0.65 3.95 0.003 -1.42 -11.6 8.73 0.79
Baseline DM (-) Established risk factors 0.739 0.711 0.767 5.8 Referent Referent Established risk
factors + Vitamin D
0.739 0.711 0.767 5.2 0.20 0.02 0.41 0.037 -1.89 -4.83 1.11 0.21
Baseline HT (+) Established risk factors 0.735 0.696 0.775 7.8 Referent Referent Established risk
factors + Vitamin D
0.736 0.697 0.776 8.0 0.38 -0.11 0.87 0.06 1.44 -3.21 6.08 0.55
Baseline HT (-) Established risk factors 0.738 0.704 0.771 6.5 Referent Referent Established risk
factors + Vitamin D
0.739 0.705 0.773 7.6 0.53 0.09 0.96 0.008 3.77 -1.31 8.85 0.15
CVD events
Total Established risk factors 0.709 0.677 0.741 12.4 Referent Referent
Established risk factors + Vitamin D
0.712 0.679 0.744 16.1 0.32 0.02 0.62 0.018 2.11 -2.09 6.31 0.32
Baseline DM (+) Established risk factors 0.703 0.636 0.770 14.6 Referent Referent Established risk
factors + Vitamin D
0.714 0.648 0.780 5.3 0.60 -0.49 1.69 0.14 2.47 -3.91 8.86 0.45
Baseline DM (-) Established risk factors 0.706 0.669 0.743 9.4 Referent Referent Established risk
factors + Vitamin D
0.707 0.669 0.744 10.0 0.33 0.01 0.66 0.023 0.32 -4.52 5.16 0.90
Baseline HT (+) Established risk factors 0.641 0.589 0.693 4.3 Referent Referent Established risk
factors + Vitamin D
0.649 0.598 0.700 3.3 0.8 0.1 1.6 0.015 5.2 -1.2 11.6 0.11
Baseline HT (-) Established risk factors 0.700 0.648 0.752 8.0 Referent Referent Established risk
factors + Vitamin D
0.704 0.652 0.756 8.4 0.29 -0.06 0.65 0.053 4.24 -1.77 10.3 0.17
AUC: area under the receiving operative characteristic curves; CI: confidence interval; HL: Hosmer-Lemeshow Goodness-of-Fit Test; CVD: cardiovascular disease; HT: hypertension; DM: diabetes mellitus; NRI: net reclassification improvement; IDI: integrated discrimination improvement;
Established risk factors included age, sex, smoking status, systolic blood pressure, HDL cholesterol, and LDL cholesterol
risk (95% CI, 1.53–3.84) for acute myocardial infarction, compared with those of high 25(OH) D (>70 nmol/L), and a graded effect was found[4].
The relationship between vitamin D insufficiency with cardiovascular disease may be more evident among the high-risk group such as hypertension, diabetes mellitus and chronic renal disease[1]. A significant trend for higher risks for all-cause deaths and cardiovascular deaths were found in the lower quartiles among hypertensive participants[25]. In addition, a reverse linear association between 25(OH)D and all cause deaths as well as cardiovascular deaths were found[25], after adjustment for covariates such as blood pressure and medication history.
However, some negative results were available: Jassal and colleagues showed that a higher concentration than mean 25(OH)D concentration as 105 nmol/L did not relate cardiovascular mortality in a community[6]. In addition, vitamin D was a protective factor for cardiovascular mortality only in women, but not men among 3404 adult Swiss population[26]. Moreover, a cohort study based on 312 older Spanish (>= 85 years old) did not showed 25(OH)D was
re-lated to cardiovascular death[7]. Our current study showed that overall the association between 25(OH)D and outcomes were not significant; however, the protective effect was found among participants who were diabetic at baseline, and diabetes status had an effect modification to in-fluence the association between 25(OH)D and all-cause death. Our findings implied that the protective effect of 25(OH)D was limited in some specific groups.
Fig 2. Relationship between 25(OH)D concentration and the risk of all-cause death among the subgroup population of diabetes.The multivariate adjusted hazard ratio is plotted as a function of the 25 (OH)D value with the 95% confidence bands shown as the shaded areas (test for nonlinear relation, P = 0.031; test for overall significance of the curve, P = 0.07).
Proposed mechanism of vitamin D for CVD and all-cause death
Our findings supported that in high risk population such as type 2 diabetes, vitamin D indeed provided a protective role for all-cause death. A proposed mechanism for diabetes and cardio-vascular disease was through obesity and endothelial dysfunction[27]. Vitamin D regulated macrophage cholesterol metabolism among diabetic patients to facilitate atherosclerosis pro-cess[28]. In addition, vitamin D deficiency was accompanied with activation of the renin-angiotensin-aldosterone system[29,30], and the associated increase of parathyroid hormone has been related to insulin resistance[31]. Using the knockout mouse model, Zhou and col-leagues[32] clearly demonstrated that Vitamin D was an important regulator for renin-angiotensin system. This modulation of the renin-renin-angiotensin system, in addition to decreasing blood pressure, improved the endothelial function and decreased inflammatory burden, thus limiting progression of atherosclerosis.
Clinical implication
Literature showed that a proposed 30 ng/mL (75 nmol/L) as the cutoff for vitamin D concen-tration was sufficient to provide regulatory effects for cardiovascular disease prevention [33]. Regarding with a cross-sectional study based on nation-wide survey in US, Judd and colleagues (2008) found that an optimal 25(OH)D concentration would attenuate the age-associated in-crease in systolic blood pressure: more than 80 nmol/L was associated with a 20% systolic blood pressure decrease, especially for white population[34]. In addition, seasonable variation of 25(OH)D concentration was observed among 1362 male Health Professionals Follow-up Study[35], and the serum 25(OH)D concentration was estimated as 82 nmol/L in summer and 75 nmol/L in winter among 262 healthy older women living in Taipei[36]. Our study did not provide seasonal variation; however, the sampling time was limited in summer time. The nor-mal range of 25(OH)D was suggested as 50–100 nmol/L (20–40 ng/dL)[37], although some re-searchers argued that the lowest limit as 5 to 80 nmol/L[38]. Our study showed that a cutoff point at 50 nmol/L provided a discriminative measure for the risk for all-cause death.
Strengths and weakness
To the best of our knowledge, this is the first prospective cohort study based on ethnic Chinese to investigate the association and prediction of vitamin D and cardiovascular risk and all-cause death. Because of the prospective cohort design in this study, the baseline measurements of participants were not affected by information bias. In addition, the community-based popula-tion informapopula-tion could help to reduce the selecpopula-tion bias. Moreover, to control potential con-founding factors, we incorporated important socioeconomic and lifestyle factors into the model. We also take consideration into the nonlinear relationship between vitamin D and out-comes. Furthermore, in addition to traditional multivariate adjusted modeling, we applied pre-diction measures, such as AUCs and integrated discrimination improvement, to demonstrate predictive ability of vitamin D. These measures provided comparative powers for novel bio-marker prediction ability[39,40].
Conclusions
In conclusion, 25(OH)D was inversely associated with the risk of all-cause death among diabet-ic partdiabet-icipants and the relationship may be non-linear among ethndiabet-ic Chinese adults in a Tai-wan community. Further studies to investigate the mechanism of vitamin D role on health effect are warranted.
Supporting Information
S1 Fig. ROC curves for the discriminative performance measures of 25(OH)D concentra-tion for all-cause death (upper) and cardiovascular events (lower) in the study participants. (TIFF)
S1 Table. The incidence cases, follow-up person-years, and the rates of specific outcomes, including CAD, all stroke, hemorrhagic and ischemic stroke events, and the hazard ratios and 95% confidence intervals of 25(OH)D concentrations in the study participants, accord-ing to quartiles.
(DOCX)
Acknowledgments
We thank the staff of the Department of Internal Medicine, National Taiwan University Hospi-tal, and the participants of the CCCC study for their valuable contributions.
Author Contributions
Conceived and designed the experiments: KLC MFC YTL. Performed the experiments: HCH HJL MFC. Analyzed the data: KLC PCC HJL. Contributed reagents/materials/analysis tools: KLC HCH TCS MFC YTL. Wrote the paper: KLC PCC HJL YTL.
References
1. Zittermann A (2006) Vitamin D and disease prevention with special reference to cardiovascular dis-ease. Prog Biophys Mol Biol 92: 39–48. PMID:16600341
2. Holick MF (2007) Vitamin D deficiency. N Engl J Med 357: 266–281. PMID:17634462
3. Holick MF, Chen TC (2008) Vitamin D deficiency: a worldwide problem with health consequences. Am J Clin Nutr 87: 1080S–1086S. PMID:18400738
4. Giovannucci E, Liu Y, Hollis BW, Rimm EB (2008) 25-hydroxyvitamin D and risk of myocardial infarction in men: a prospective study. Arch Intern Med 168: 1174–1180. doi:10.1001/archinte.168.11.1174 PMID:18541825
5. Liu L, Chen M, Hankins SR, Nunez AE, Watson RA, Weinstock PJ, et al. (2012) Serum 25-hydroxyvita-min D concentration and mortality from heart failure and cardiovascular disease, and premature mortali-ty from all-cause in United States adults. Am J Cardiol 110: 834–839. doi:10.1016/j.amjcard.2012.05. 013PMID:22658246
6. Jassal SK, Chonchol M, von Muhlen D, Smits G, Barrett-Connor E (2010) Vitamin d, parathyroid hormone, and cardiovascular mortality in older adults: the Rancho Bernardo study. Am J Med 123: 1114–1120. doi:10.1016/j.amjmed.2010.07.013PMID:20870200
7. Formiga F, Ferrer A, Megido MJ, Boix L, Contra A, Pujol R (2013) Low Serum Vitamin D is Not Associat-ed with an Increase in Mortality in Oldest Old Subjects: The Octabaix Three-Year Follow-Up Study. Gerontology.
8. Chien KL, Hsu HC, Sung FC, Su TC, Chen MF, Lee YT (2005) Hyperuricemia as a risk factor on cardio-vascular events in Taiwan: The Chin-Shan Community Cardiocardio-vascular Cohort Study. Atherosclerosis 183: 147–155. PMID:16154134
10. Chien KL, Lee YT, Sung FC, Hsu HC, Su TC, Lin RS (1999) Hyperinsulinemia and related atheroscle-rotic risk factors in the population at cardiovascular risk: a community-based study. Clinical Chemistry 45: 838–846. PMID:10351993
11. Lee YT, Lin RS, Sung FC, Yang CY, Chien KL, Chen WJ, et al. (2000) Chin-Shan Community Cardio-vascular Cohort in Taiwan: baseline data and five-year follow-up morbidity and mortality. Journal of Clinical Epidemiology 53: 836–846.
12. Wieland H, Seidel D (1983) A simple specific method for precipitation of low density lipoproteins. Jour-nal of Lipid Research 24: 904–909. PMID:6631224
13. Wielders JP, Wijnberg FA (2009) Preanalytical stability of 25(OH)-vitamin D3 in human blood or serum at room temperature: solid as a rock. Clin Chem 55: 1584–1585. doi:10.1373/clinchem.2008.117366 PMID:19541868
14. Hosmer DW Jr, Lemeshow S (1989) The multiple logistic regression model. Applied logistic regression. 1 ed. New York: John Wiley & Sons. pp. 25–37.
15. McGeechan K, Macaskill P, Irwig L, Liew G, Wong TY (2008) Assessing new biomarkers and predictive models for use in clinical practice: a clinician's guide. Arch Intern Med 168: 2304–2310. doi:10.1001/ archinte.168.21.2304PMID:19029492
16. Hanley JA, McNeil BJ (1983) A method of comparing the areas under receive operating characteristic curves derived from the same cases. Radiology 148: 839–843. PMID:6878708
17. DeLong ER, DeLong DM, Clarke-Pearson DL (1988) Comparing the areas under two or more correlat-ed receiver operating characteristic curves: a nonparametric approach. Biometrics 44: 837–845. PMID:3203132
18. Cook NR (2007) Use and misuse of the receiver operating characteristic curve in risk prediction. Circu-lation 115: 928–935. PMID:17309939
19. Pencina MJ, D' Agostino RB S, D' Agostino RB J, Vasan RS (2008) Evaluating the added predictive ability of a new marker: From area under the ROC curve to reclassification and beyond. Stat Med 27: 157–172. PMID:17569110
20. Durrleman S, Simon R (1989) Flexible regression models with cubic splines. Stat Med 8: 551–561. PMID:2657958
21. Herndon JE 2nd, Harrell FE Jr (1995) The restricted cubic spline as baseline hazard in the proportional hazards model with step function time-dependent covariables. Stat Med 14: 2119–2129. PMID:8552891
22. Govindarajulu US, Spiegelman D, Thurston SW, Ganguli B, Eisen EA (2007) Comparing smoothing tech-niques in Cox models for exposure-response relationships. Stat Med 26: 3735–3752. PMID:17538974
23. Dobnig H, Pilz S, Scharnagl H, Renner W, Seelhorst U, Wellnitz B, et al. (2008) Independent associa-tion of low serum 25-hydroxyvitamin d and 1,25-dihydroxyvitamin d levels with all-cause and cardiovas-cular mortality. Arch Intern Med 168: 1340–1349. doi:10.1001/archinte.168.12.1340PMID:18574092
24. Schierbeck LL, Rejnmark L, Tofteng CL, Stilgren L, Eiken P, Mosekilde L, et al. (2012) Vitamin D defi-ciency in postmenopausal, healthy women predicts increased cardiovascular events: a 16-year follow-up study. Eur J Endocrinol 167: 553–560. doi:10.1530/EJE-12-0283PMID:22875588
25. Zhao G, Ford ES, Li C, Croft JB (2012) Serum 25-hydroxyvitamin D levels and all-cause and cardiovas-cular disease mortality among US adults with hypertension: the NHANES linked mortality study. J Hypertens 30: 284–289. doi:10.1097/HJH.0b013e32834e1f0aPMID:22179077
26. Rohrmann S, Braun J, Bopp M, Faeh D, Swiss National C (2013) Inverse association between circulat-ing vitamin D and mortality—Dependent on sex and cause of death? Nutr Metab Cardiovasc Dis.
27. Muscogiuri G, Sorice GP, Ajjan R, Mezza T, Pilz S, Prioletta A, et al. (2012) Can vitamin D deficiency cause diabetes and cardiovascular diseases? Present evidence and future perspectives. Nutr Metab Cardiovasc Dis 22: 81–87. doi:10.1016/j.numecd.2011.11.001PMID:22265795
28. Riek AE, Oh J, Bernal-Mizrachi C (2010) Vitamin D regulates macrophage cholesterol metabolism in di-abetes. J Steroid Biochem Mol Biol 121: 430–433. doi:10.1016/j.jsbmb.2010.03.018PMID:20338238
29. Lee JH, O'Keefe JH, Bell D, Hensrud DD, Holick MF (2008) Vitamin D deficiency an important, com-mon, and easily treatable cardiovascular risk factor? J Am Coll Cardiol 52: 1949–1956. doi:10.1016/j. jacc.2008.08.050PMID:19055985
30. Li YC, Kong J, Wei M, Chen ZF, Liu SQ, Cao LP (2002) 1,25-Dihydroxyvitamin D(3) is a negative endo-crine regulator of the renin-angiotensin system. J Clin Invest 110: 229–238. PMID:12122115
31. Lee MS, Li HL, Hung TH, Chang HY, Yang FL, Wahlqvist ML (2008) Vitamin D intake and its food sources in Taiwanese. Asia Pac J Clin Nutr 17: 397–407. PMID:18818159
33. Brandenburg VM, Vervloet MG, Marx N (2012) The role of vitamin D in cardiovascular disease: from present evidence to future perspectives. Atherosclerosis 225: 253–263. doi:10.1016/j.atherosclerosis. 2012.08.005PMID:22921424
34. Judd SE, Nanes MS, Ziegler TR, Wilson PW, Tangpricha V (2008) Optimal vitamin D status attenuates the age-associated increase in systolic blood pressure in white Americans: results from the third Na-tional Health and Nutrition Examination Survey. Am J Clin Nutr 87: 136–141. PMID:18175747
35. Nimptsch K, Platz EA, Willett WC, Giovannucci E (2012) Association between plasma 25-OH vitamin D and testosterone levels in men. Clin Endocrinol (Oxf) 77: 106–112. doi:10.1111/j.1365-2265.2012. 04332.xPMID:22220644
36. Tsai KS, Hsu SH, Cheng JP, Yang RS (1997) Vitamin D stores of urban women in Taipei: effect on bone density and bone turnover, and seasonal variation. Bone 20: 371–374. PMID:9108358
37. Norman AW (2008) A vitamin D nutritional cornucopia: new insights concerning the serum 25-hydroxyvitamin D status of the US population. Am J Clin Nutr 88: 1455–1456. doi:10.3945/ajcn.2008.27049PMID: 19064502
38. Hollis BW, Wagner CL (2005) Normal serum vitamin D levels. N Engl J Med 352: 515–516; author reply 515–516. PMID:15689597
39. Chien KL, Hsu HC, Su TC, Chang WT, Chen PC, Sung FC, et al. (2012) Constructing a point-based prediction model for the risk of coronary artery disease in a Chinese community: A report from a cohort study in Taiwan. Int J Cardiol 157: 263–268. doi:10.1016/j.ijcard.2012.03.017PMID:22503568