USE OF GROWTH ANALYSIS TO EVALUATE GENETIC MECHANISMS
AFFECTING ACHENE YIELD FORMATION OF SUNFLOWER
A NÖVEKEDÉSANALÍZIS MÓDSZERÉNEK ALKALMAZÁSA A
NAPRAFORGÓ KASZATTERMÉSÉT BEFOLYÁSOLÓ GENETIKAI HATÁSOK
VIZSGÁLATÁBAN
CSIKÁSZ
1*T., ALFÖLDI
2Z., JÓZSA
2S., TREITZ
1M.
ÖSSZEFOGLALÁS
A kutatások során ötven napraforgó genotípus kaszattermés szárazanyag-felhalmozását (DMA) vizsgáltuk a növekedésanalízis funkcionális (függvények illesztésével kapott modellezés) módszerével, a Kaposvári Egyetem Takarmánytermesztési Kutató Intézetének bicsérdi kísérleti telepén, szántóföldi körülmények között. A függvény-illesztéseket az lnY= P0 + P1*X + P2*X2 egyenlet (Hunt-formula) alapján végeztük. Az illesztett
függvények alapján meghatároztuk a kaszattermés maximális értékét (Ymax), az abszolút növekedési sebesség átlagos (AGRavg) és maximális (AGRmax) értékét, az abszolút növekedési sebesség legnagyobb értékének az idõpontját (Xagrmax), és a relatív növekedési sebesség átlagos értékét (RGRavg) a kísérleti hibridekre ismétlésenként. A hibridek között észlelhetõ, valamint a hibridek között a különbözõ mintavételi idõpontokban kimutatott szignifikáns különbségek arra utalnak, hogy a napraforgó kaszattermésének szárazanyag-felhalmozását a genotípus alapvetõen befolyásolja. A legszorosabb összefüggést az Ymax és AGRmax értékek között mértük.
KULCSSZAVAK: napraforgó, szárazanyag, növekedés analízis
ABSTRACT
The main objective of this study was to investigate the process of dry matter accumulation (DMA) in achenes during the grain-filling period of fifty sunflower genotypes by using the functional method of growth analysis in a field trial at Bicsérd, Hungary. The Hunt-formula of lnY= P0 + P1*X + P2*X2 was fitted to data.
Maximum yield (Ymax), the average of the absolute growth rate (AGRavg), maximum growth rate (AGRmax), date of the maximum growth rate (Xagrmax), and the average of the relative growth rate (RGRavg) were calculated from growth curves for hybrids and replications. Significant differences among hybrids and their interaction with sampling dates indicate hybrid differences in the intensity of DMA accumulation. The strongest correlation was observed between the parameters of Ymax and AGRmax.
DETAILED ABSTRACT
Achene yield as a phenotypic character of sunflower hybrids is the result of the interaction of the genotype and the environment. The evaluations of the basic processes involved in yield formation are of great importance. The main objective of this study was to investigate the process of dry matter accumulation (DMA) in achenes during the grain filling period of diverse sunflower genotypes by using the functional method of growth analysis. Fifty hybrids were planted in a field trial at Bicsérd Experimental Station, Research Institute of Forage Crops, University of Kaposvár, Hungary. Modeling the temporal changes the second-order polynomial of lnY= P0 + P1*X + P2*X2 employed earlier was used to fit to data of averages and replications of hybrids.
INTRODUCTION
The effective selection of sunflower genotypes with high productivity potential is a considerable process of hybrid breeding. It is increasingly difficult to produce hybrids that overyield genotypes used in the production systems. Achene yield as a phenotypic trait is the result of the interaction between the genetic structure and the environment. As it is known, the effects of the environmental factors have increased relatively, and the yield level differences among the hybrids can be observed only in the particular production environment [4]. The interaction between the genotype and the environment may have a forceful influence also on the grain filling process [7]. Methods of hybrid breeding exploiting heterosis can be used effectively for diploid cross breeding species with their evolutionary predestination. Non-additive gene interactions can be exploited during the hybrid breeding process utilizing heterosis to achieve yield surplus. Most breeders, however, try to relate quantitative traits to genes inherited additively, since their effects are better predictable and they may assure reasonable backgrounds for parent selection
[8].The question arose whether there is a reasonable chance to find significant additive genetic control for a quantitative trait like yield formation for a typical heterosis-species like sunflower. For investigating this, a research project for evaluating the basic processes of yield formation has been introduced. Increments of achene yield were characterized by measuring the achene dry matter content of samples of individual plants taken on consecutive sampling dates. The functional method of plant growth analysis [5,1] was employed to describe and model the temporal process of yield formation.
MATERIALS AND METHODS
The processes of dry matter accumulation (DMA) in achenes of fifty sunflower hybrids with different genetic constitutions were investigated in a field trial carried out at the Bicsérd Experimental Station, Research Institute of Forage Crops, University of Kaposvár, in 2000. Hybrids were planted in randomized block design using 4 replications without any fertilization. Plot sizes were 25.2 m2, and plant density was 50000 . ha-1. Soil type was
plots were protected against pathogens and pests by three fungicide and insecticide treatments.
Samples consisting of achenes of 3 plants per plots were taken at eleven occassions at 7-day intervals from the end of flowering until ripening. After hand threshing and drying the samples the dry matter content was determined. Data were processed and evaluated by analysis of variance (ANOVA). Modeling the temporal changes the second-order polynomial of lnY= P0 + P1*X + P2*X2[6] was used
to fit to data, where X denotes the period (in 6-day units) passed since the end of flowering and Y denotes the DMA value (g . 3 plants-1) at time X. This method has earlier been adapted successfully for sunflower [2,3] (Csikász, 1998a; 1998b). The values of maximum yield estimated in the sampling interval (Ymax) were determined from fitted curves. By using the Hunt-formula, the genotype-specific parameters of DMA equations (P0,P1 and P2) were
obtained for both the averages of the replications and also for single replications making estimation of the influence of genotypes on different characteristics possible. The correctness of fitting was determined by the method of ortogonal polinomials.
The curves of absolute (AGR) and relative (RGR) growth rates were derived from DMA equations by differentiation [5], after which the three characteristics were computed for hybrids and replications using the following formulas:
- average increase in DMA during the sampling period (in dry matter . week-1):
( ) ( ) ( )
16[
Y 6 Y 0]
AGRavg = −
( ) (
1
6
[
exp
P
0+
6
P
1+
36
P
2)
−
exp
( )
P
0]
,
=
- maximum increase in DMA (in dry matter . week-1):
(
2
2)
exp
(
0 124
20
,
5
)
,
max
=
sqrt
−
P
⋅
P
−
P
P
−
AGR
- time of maximal speed of growth (in 6-day units after the end of flowering):
(
)
[
12
2]
(
2
2)
max
P
sqrt
P
P
X
AGR=
−
−
−
Data were subjected to ANOVA.For describing associations of characteristics correlation analyses
were completed among the calculated parameters and the Pearson product-movement correlation ‘r’ was determined. Finally, genotypes were classified
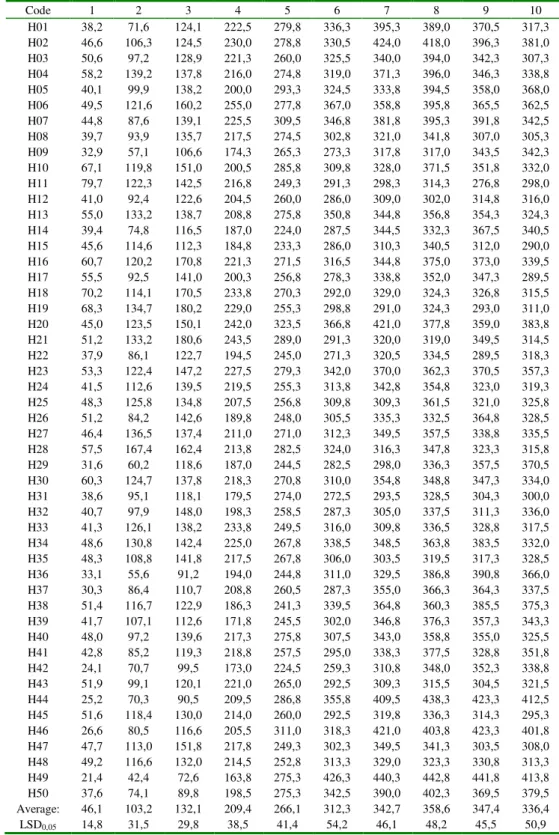
Table 1: Average achene yield of sunflower genotypes in different sampling dates (g . 3 plants-1)
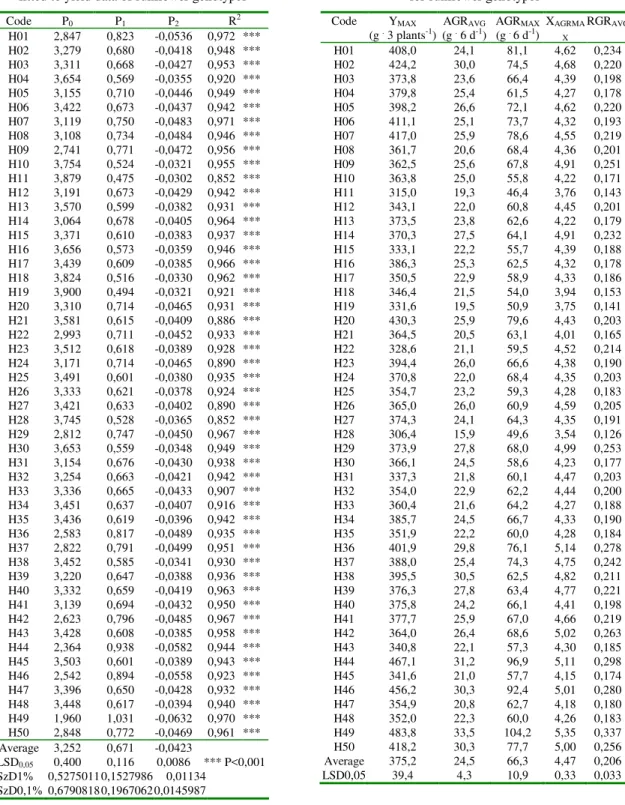
Table 3: Parameters and R2 values of curves fitted to yield data of sunflower genotypes
Code P0 P1 P2 R2
H01 2,847 0,823 -0,0536 0,972 *** H02 3,279 0,680 -0,0418 0,948 *** H03 3,311 0,668 -0,0427 0,953 *** H04 3,654 0,569 -0,0355 0,920 *** H05 3,155 0,710 -0,0446 0,949 *** H06 3,422 0,673 -0,0437 0,942 *** H07 3,119 0,750 -0,0483 0,971 *** H08 3,108 0,734 -0,0484 0,946 *** H09 2,741 0,771 -0,0472 0,956 *** H10 3,754 0,524 -0,0321 0,955 *** H11 3,879 0,475 -0,0302 0,852 *** H12 3,191 0,673 -0,0429 0,942 *** H13 3,570 0,599 -0,0382 0,931 *** H14 3,064 0,678 -0,0405 0,964 *** H15 3,371 0,610 -0,0383 0,937 *** H16 3,656 0,573 -0,0359 0,946 *** H17 3,439 0,609 -0,0385 0,966 *** H18 3,824 0,516 -0,0330 0,962 *** H19 3,900 0,494 -0,0321 0,921 *** H20 3,310 0,714 -0,0465 0,931 *** H21 3,581 0,615 -0,0409 0,886 *** H22 2,993 0,711 -0,0452 0,933 *** H23 3,512 0,618 -0,0389 0,928 *** H24 3,171 0,714 -0,0465 0,890 *** H25 3,491 0,601 -0,0380 0,935 *** H26 3,333 0,621 -0,0378 0,924 *** H27 3,421 0,633 -0,0402 0,890 *** H28 3,745 0,528 -0,0365 0,852 *** H29 2,812 0,747 -0,0450 0,967 *** H30 3,653 0,559 -0,0348 0,949 *** H31 3,154 0,676 -0,0430 0,938 *** H32 3,254 0,663 -0,0421 0,942 *** H33 3,336 0,665 -0,0433 0,907 *** H34 3,451 0,637 -0,0407 0,916 *** H35 3,436 0,619 -0,0396 0,942 *** H36 2,583 0,817 -0,0489 0,935 *** H37 2,822 0,791 -0,0499 0,951 *** H38 3,452 0,585 -0,0341 0,930 *** H39 3,220 0,647 -0,0388 0,936 *** H40 3,332 0,659 -0,0419 0,963 *** H41 3,139 0,694 -0,0432 0,950 *** H42 2,623 0,796 -0,0485 0,967 *** H43 3,428 0,608 -0,0385 0,958 *** H44 2,364 0,938 -0,0582 0,944 *** H45 3,503 0,601 -0,0389 0,943 *** H46 2,542 0,894 -0,0558 0,923 *** H47 3,396 0,650 -0,0428 0,932 *** H48 3,448 0,617 -0,0394 0,940 *** H49 1,960 1,031 -0,0632 0,970 *** H50 2,848 0,772 -0,0469 0,961 *** Average 3,252 0,671 -0,0423
LSD0,05 0,400 0,116 0,0086 *** P<0,001
SzD1% 0,5275011 0,1527986 0,01134 SzD0,1% 0,6790818 0,1967062 0,0145987
Table 4: Average values of calculated parameters for sunflower genotypes
Code YMAX
(g . 3 plants-1) AGRAVG
(g . 6 d-1)
AGRMAX
(g . 6 d-1) XAGRMA
X
RGRAVG
H01 408,0 24,1 81,1 4,62 0,234
H02 424,2 30,0 74,5 4,68 0,220
H03 373,8 23,6 66,4 4,39 0,198
H04 379,8 25,4 61,5 4,27 0,178
H05 398,2 26,6 72,1 4,62 0,220
H06 411,1 25,1 73,7 4,32 0,193
H07 417,0 25,9 78,6 4,55 0,219
H08 361,7 20,6 68,4 4,36 0,201
H09 362,5 25,6 67,8 4,91 0,251
H10 363,8 25,0 55,8 4,22 0,171
H11 315,0 19,3 46,4 3,76 0,143
H12 343,1 22,0 60,8 4,45 0,201
H13 373,5 23,8 62,6 4,22 0,179
H14 370,3 27,5 64,1 4,91 0,232
H15 333,1 22,2 55,7 4,39 0,188
H16 386,3 25,3 62,5 4,32 0,178
H17 350,5 22,9 58,9 4,33 0,186
H18 346,4 21,5 54,0 3,94 0,153
H19 331,6 19,5 50,9 3,75 0,141
H20 430,3 25,9 79,6 4,43 0,203
H21 364,5 20,5 63,1 4,01 0,165
H22 328,6 21,1 59,5 4,52 0,214
H23 394,4 26,0 66,6 4,38 0,190
H24 370,8 22,0 68,4 4,35 0,203
H25 354,7 23,2 59,3 4,28 0,183
H26 365,0 26,0 60,9 4,59 0,205
H27 374,3 24,1 64,3 4,35 0,191
H28 306,4 15,9 49,6 3,54 0,126
H29 373,9 27,8 68,0 4,99 0,253
H30 366,1 24,5 58,6 4,23 0,177
H31 337,3 21,8 60,1 4,47 0,203
H32 354,0 22,9 62,2 4,44 0,200
H33 360,4 21,6 64,2 4,27 0,188
H34 385,7 24,5 66,7 4,33 0,190
H35 351,9 22,2 60,0 4,28 0,184
H36 401,9 29,8 76,1 5,14 0,278
H37 388,0 25,4 74,3 4,75 0,242
H38 395,5 30,5 62,5 4,82 0,211
H39 376,3 27,8 63,4 4,77 0,221
H40 375,8 24,2 66,1 4,41 0,198
H41 377,7 25,9 67,0 4,66 0,219
H42 364,0 26,4 68,6 5,02 0,263
H43 340,8 22,1 57,3 4,30 0,185
H44 467,1 31,2 96,9 5,11 0,298
H45 341,6 21,0 57,7 4,15 0,174
H46 456,2 30,3 92,4 5,01 0,280
H47 354,9 20,8 62,7 4,18 0,180
H48 352,0 22,3 60,0 4,26 0,183
H49 483,8 33,5 104,2 5,35 0,337
H50 418,2 30,3 77,7 5,00 0,256
Average 375,2 24,5 66,3 4,47 0,206
RESULTS AND DISCUSSION
Table 1 shows the average DMA content of the different sunflower experimental hybrids in different sampling dates. Achene yield level achieved its maximum value in sampling dates 7 or 8 for most of the hybrids. However, there were some genotypes like that of code number H11 which peaked earlier
in sampling date 6. Analysis of variance (ANOVA) showed considerable differences among DMA of diverse genotypes, sampling dates, and their interaction was proved also to be significant (LSD0,05
= 43,6) indicating hybrid differences in the intensity of achene dry matter accumulation (Table 2).
Table 2. Table of analysis of variance (ANOVA) for data of achene dry matter content Components SS df MS F P-value F critical
Sample 23988114 9 2665346 2687,39 0 1,89 Columns 477716 49 9749 9,83 3,41E-61 1,36 Interaction 1002532 441 2273 2,29 2,64E-31 1,13
Within 1487696 1500 992 Total 26956058 1999
The Hunt-formula fitted properly to experimental data of all hybrids, the R2 values varied between 0,972 and 0,852 (P<0,001), and ANOVA proved the significant effects of the genotypes on the changes of the parameters (Table 3).
Using the appropriate mathematical formulas, parameters of YMAX, AGRAVG, AGRMAX, XAGRMAX,
and RGRAVG were computed for hybrids and
replications (Table 4). Significant differences among hybrids were recorded for each parameter evaluated. Correlation analyses of calculated indices showed
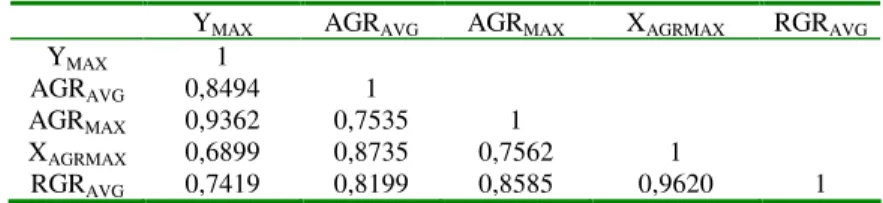
in Table 5 revealed the strongest correlation between Ymax and AGRmax (r = 0,936). It indicates that the intensity of DMA is determined about 86 percent by AGRMAX. Verifying this, AGRMAX data were
analyzed by ANOVA. Based on LSD(0,05) values hybrids were classified into three groups of showing low level (7,67-11,03 gram dry matter . week-1), medium level (11,04-12,97 gram dry matter . week
-1
), and high level (13,0-15,43 gram matter . week-1 ) of AGRMAX values. These results suggest that
sunflower hybrids with intensive dry matter accumulation can be determined.
Table 5: Correlation analysis of calculated parameters
YMAX AGRAVG AGRMAX XAGRMAX RGRAVG
YMAX 1
AGRAVG 0,8494 1
AGRMAX 0,9362 0,7535 1
XAGRMAX 0,6899 0,8735 0,7562 1
RGRAVG 0,7419 0,8199 0,8585 0,9620 1
r (kritikus, p=0,001) = 0,4648
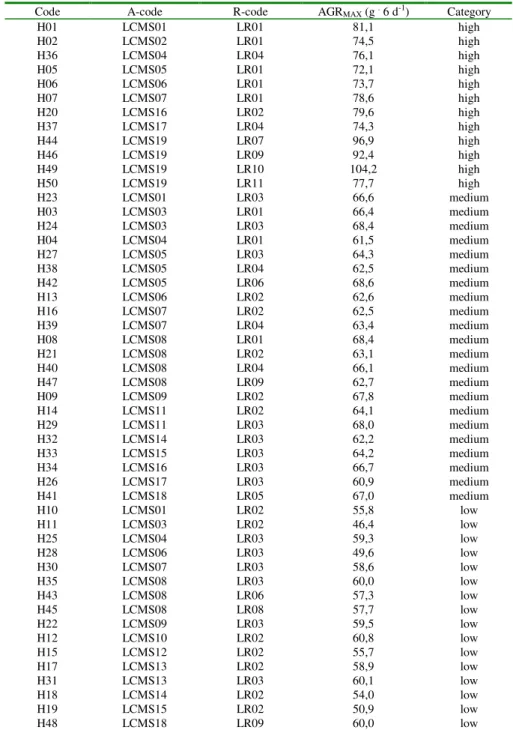
Based on the average of the AGRMAX values and the
significant differences genotypes were classified into three groups of the following characteristic features:
- high AGRMAX (AGRMAX > average AGRMAX +
0,5*LSD0,05)
- average AGRMAX (hybrids not belonging to
categories number 1 and 3)
- low AGRMAX (AGRMAX < average AGRMAX -
0,5*LSD0,05)
Finally, hybrids were grouped based on the above categories and parental lines (Table 6), the fifty hybrids falling into the categories as follows: 12 were of „high”, 22 belonged to „medium”, and 16 were of „low” categories, respectively. There was significant difference revealed between the AGRMAX
LCMS05, LR01 and LR04 can be found both in Groups 1 and 2. The inbred lines coded LCMS08 and LR03 are represented only in Groups 2 and 3. It is worth noting that the parental lines of LCMS19 and LR01 proved to be superior even when crossing to parental lines with lower performance.
Figures 1 and 2 demonstrate the Y and AGR curves of six respective genotypes, three having high, whereas the other three having low AGRMAX values.
Genotypes with different intensity of DMA accumulation can be distinguished visually, as well.
Table 6: AGRMAX categories for hybrids and for parental lines
Code A-code R-code AGRMAX (g . 6 d-1) Category
H01 LCMS01 LR01 81,1 high
H02 LCMS02 LR01 74,5 high
H36 LCMS04 LR04 76,1 high
H05 LCMS05 LR01 72,1 high
H06 LCMS06 LR01 73,7 high
H07 LCMS07 LR01 78,6 high
H20 LCMS16 LR02 79,6 high
H37 LCMS17 LR04 74,3 high
H44 LCMS19 LR07 96,9 high
H46 LCMS19 LR09 92,4 high
H49 LCMS19 LR10 104,2 high
H50 LCMS19 LR11 77,7 high
H23 LCMS01 LR03 66,6 medium
H03 LCMS03 LR01 66,4 medium
H24 LCMS03 LR03 68,4 medium
H04 LCMS04 LR01 61,5 medium
H27 LCMS05 LR03 64,3 medium
H38 LCMS05 LR04 62,5 medium
H42 LCMS05 LR06 68,6 medium
H13 LCMS06 LR02 62,6 medium
H16 LCMS07 LR02 62,5 medium
H39 LCMS07 LR04 63,4 medium
H08 LCMS08 LR01 68,4 medium
H21 LCMS08 LR02 63,1 medium
H40 LCMS08 LR04 66,1 medium
H47 LCMS08 LR09 62,7 medium
H09 LCMS09 LR02 67,8 medium
H14 LCMS11 LR02 64,1 medium
H29 LCMS11 LR03 68,0 medium
H32 LCMS14 LR03 62,2 medium
H33 LCMS15 LR03 64,2 medium
H34 LCMS16 LR03 66,7 medium
H26 LCMS17 LR03 60,9 medium
H41 LCMS18 LR05 67,0 medium
H10 LCMS01 LR02 55,8 low
H11 LCMS03 LR02 46,4 low
H25 LCMS04 LR03 59,3 low
H28 LCMS06 LR03 49,6 low
H30 LCMS07 LR03 58,6 low
H35 LCMS08 LR03 60,0 low
H43 LCMS08 LR06 57,3 low
H45 LCMS08 LR08 57,7 low
H22 LCMS09 LR03 59,5 low
H12 LCMS10 LR02 60,8 low
H15 LCMS12 LR02 55,7 low
H17 LCMS13 LR02 58,9 low
H31 LCMS13 LR03 60,1 low
H18 LCMS14 LR02 54,0 low
H19 LCMS15 LR02 50,9 low
Results of this experiment indicate additive genetic control of traits determining DMA accumulation, which, however, should further be investigated and proved in future trials.
ACKNOWLEDGEMENT
The authors are grateful for the Hungarian Ministry of Education for the financial support (research grant of FKFP-0477/2000).
Figure 1: Curves characterizing the dynamics of dry matter accumulation of sunflower hybrids
0,0 50,0 100,0 150,0 200,0 250,0 300,0 350,0 400,0 450,0
1 2 3 4 5 6 7 8 9 10
Sampling dates Dr y m a tt er of ac h en e yie ld ( g
. 3 p
lan ts ) H02 H05 H07 H12 H19 H31
Figure 2: Curves of Absolute Growth Rates of sunflower hybrids of Figure 1.
-80 -60 -40 -20 0 20 40 60 80 100
1 2 3 4 5 6 7 8 9 10
Sampling dates A b so lu te G r ow th R a te (g
. 6 d
ays ) H02 H05 H07 H12 H19 H31 REFERENCES
[1] Berzsenyi, Z. 2000. Növekedésanalízis a növénytermesztésben (Growth Analysis in Plant Production). Egyetemi jegyzet (PhD course outline, in Hungarian). University of Veszprém, Georgikon Faculty of Agriculture, Keszthely, Hungary.
[3] Csikász, T. 1998b. Comparative analysis of achene dry matter accumulation of twelve sunflower genotypes. EUCARPIA, International Symposium on Breeding of Protein and Oil Crops, Pontevedra, Spain. pp.155-156.
[4] Gardner, F.P., R.B. Pearce, and R.L. Mitchell. 1985. Physiology of Crop Plants. Iowa State University Press, Ames.
[5] Hunt, R. 1982. Plant Growth Curves: The Functional Approach to Plant Growth Analysis. Edward Arnold Publ., London.
[6] Hunt, R. and I.T. Parsons. 1974. A computer program for deriving growth-functions in plant growth analysis. J.Appl.Ecol., 11:297-307.
[7] Tollenaar, M., L.M. Dwyer, and D.W. Stewart. 1992. Ear and kernel formation in maize hybrids representing three decades of grain yield improvement in Ontario. Crop Sci., 432-438.
[8] Wilson, D. 1984. Identifying and exploiting genetic variation in the physiological components of production. Ann.Appl.Biol., 104:527-536.
Tamás Csikász, [email protected], Mónika Treitz,
University of Kaposvár, Research Institute for Forage Crops, Iregszemcse, Hungary, Phone: 36)-74 481 127,
Telefax: (36)-73-481 253, Zoltán Alföldi,
Sándor Józsa,