GROWTH AND YIELD OF PAPAYA UNDER IRRIGATION
Frederico Terra de Almeida1*; Salassier Bernardo2; Elias Fernandes de Sousa2; Sérgio Lúcio David Marin3; Sidney Grippa2
1
UENF/CCT - Lab. de Engenharia Civil. 2
UENF/CCTA - Lab. de Engenharia Agrícola , Av. Alberto Lamego, 2000 - 28013-600 - Campos dos Goytacazes, RJ - Brasil.
3
UENF/CCTA - Lab. de Fitotecnia.
*Corresponding author <fredterr@uenf.br>
ABSTRACT: Thermal units or degree day systems can both be used to quantify relationships between plants and air temperature. The Northern Fluminense region holds no tradition for irrigated papaya (Carica papaya L.) cropping and, because of the need for irrigation, it is important knowing its growth and development characteristics under these conditions. This study aimed to determine the relationship between growth rate of papaya plants and degree days, and its effect on crop productivity, under different irrigation levels. An experiment was set up with the cultivar “Improved Sunrise Soil 72/12”, in a randomized blocks design, with seven irrigation water depths and three repetitions; crop growth and yield parameters were evaluated. There were significant correlations between water depths and degree days. Polynomial models of 2nd
and 3rd
order appropriately fitted the relationships degree day versus plant height, stem diameter, crown diameter and number of emitted leaves, for each water depth. Growth parameters related to degree days and to the applied treatments are indicative of yield potential. The total water depth that promoted the greatest fruit yield was 2,937 mm.
Key words: irrigation management, development, papaya, productivity
CRESCIMENTO E PRODUÇÃO DO MAMOEIRO SOB IRRIGAÇÃO
RESUMO: Entre os métodos de quantificar as relações entre as plantas e a temperatura do ar, estão os sistemas de unidades térmicas ou graus-dia. Sendo a região Norte Fluminense sem tradição no cultivo da cultura de mamão (Carica papaya L.) e devido a necessidade de irrigação, é importante que se conheça o comportamento de seu crescimento e desenvolvimento sob estas condições. O objetivo deste trabalho foi estudar o crescimento do mamoeiro em relação a graus-dia e seu efeito na produção, sob diferentes níveis de irrigação nesta região. Montou-se um experimento com a cultivar ‘Improved Sunrise Solo 72/12’, em um delineamento em blocos casualizados, com sete lâminas de irrigação e três repetições, procurando-se avaliar os parâmetros de crescimento e de produção. Houve interação significativa entre lâminas de irrigação e graus-dia. Modelos polinomiais de 2a e 3a ordem ajustaram significativamente a relação graus-dia X altura de plantas, diâmetro de caule, diâmetro de copa e número de folhas emitidas, para cada lâmina de irrigação. Os parâmetros de crescimento relacionados a graus-dia e aos tratamentos aplicados são indicativos de potencial de produção. A lâmina total de água que promoveu a maior produção de frutos foi de 2.937 mm.
Palavras-chave: manejo de irrigação, desenvolvimento, mamão, produtividade
INTRODUCTION
Various assumptions concern the its origin of the papaya tree (Carica papaya L.), considered to be origi-nated somewhere in Tropical America (Medina, 1989). As a crop that thrives in typically tropical climates, it has been spread through several regions in the world, and in Brazil every state has regions where this plant finds fa-vorable conditions for development. The most suitable regions for papaya cropping present tropical or subtropi-cal climates, with ideal temperatures ranging on 22 and 26ºC (25ºC, optium) adequate relative humidity (60 to 85%), high precipitation, and fertile, well-drained soils (Siqueira & Botrel, 1986; Medina, 1989; Oliveira et al., 1994).
However, among the main climatic factors which condition the establishment of papaya plantations, tem-perature seems to be one of the best indicators, because of its influence on crop growth and development. In warmer regions, papaya trees grow faster, and their fruits present better quality than in cooler regions (Siqueira & Botrel, 1986; Medina, 1989; Oliveira et al., 1994). In re-gions where temperatures drops below 15°C, usually from the end of fall through the beginning of spring, papaya trees have their growth paralyzed, no flowering occurs and fruit maturation is delayed, not to mention that most leaves are shed, leaving the fruits exposed to sunburns (Marin et al., 1995).
non-tradi-tional location. This is the case of the Northern Fluminense Region (NF), which was favorable edaphic-climatic and logistic conditions for papaya cropping. However, the lack of data on papaya growth and devel-opment, added to the fact of a possible interaction be-tween climate and irrigation, needed in the region, might make the adequate conduction of this crop a difficult task. Growth, flowering and nutritional status may af-fect the yield of papaya plantations, and the growth-lim-iting factors either influence the production of flowers or fruits or do not allow adequate nutritional supply and, therefore, must be optimized, with water being the main factor. Silva (1999) found the highest growth and devel-opment rates for papaya trees with 120% replacements of ETo, also obtaining the highest yield potential for this condition. The lowest yields were verified for replace-ments of 40 and 60% of ETo, at two-day irrigation inter-vals.
Silva (1999) applying 5 water replacement rates (from 0 to 120% of the ETo), at three frequencies (2, 3 and 5 days), observed that the behavior of papaya yield relative to the applied depths was linear, and that increas-ing yield was significant in most of the replacement rates. However, he did not verify a decrease in yield with the increases in water depth, presuming that not enough wa-ter was supplied to meet the crop yield potential.
Awada et al. (1979) verified, together with higher growth rates, a greater productivity for replacements of 129% ETo, considering that 5 water depths were applied weekly (from 33 to 162% ETo), and observing yield de-creases at 162% of the ETo. The best water replacement rate, or the rate that provides the highest yields, is around 130% of the ETo (Silva, 1999 and Awada et al., 1979). Notwithstanding, Srinivas (1996) only observed a signifi-cant effect on yield increase for daily replacements of up to 60% of the ETo, increasing from this point forty, but without significance.
The measurement of crop growth allows the de-termination of the flowering season, the plant height at which harvest is no longer viable, the gain in leaf area that, in general, results in higher yields, the peak produc-tion seasons, etc., thus displaying the producproduc-tion condi-tions representative of a region. The duration of each veg-etative stage varies with species and climatic conditions. Several climatic elements condition the development of agricultural species, with thermal and water conditions being the two environmental parameters that affect crop establishment and development the most. In irrigated crops, thermal conditions are the most important, since their water requirements are met by irrigation (Mota, 1986).
Defining thermal units system or degree days is among the attempts made to quantify the relations be-tween plants and air temperature is which represents this interaction by the accumulation of daily mean
tempera-tures of the air above a value that is considered a baseline for the crop, a certain phenological stage being attained when the plant accumulates a given amount of thermal units, and the involved time is disregarded (Wang, 1960). Historically, the studies of climate-plant interactions be-gan with R.A.F. Réaumur, in 1735, with the construction of the thermometric scale and the suggestion that “the summation of mean temperatures, for a plant development stage, is constant for each plant species”, (Kish, l967). This temperature summation came to be known as Réaumur’s phenology constant. It was only in 1834 that Boussingault suggested the utilization of the “product of mean temperatures, above sixdegrees centigrade and the period under consideration”, according to Robertson (l968). Such product was called Degree Days - DD.
The concept of degree days, also called thermal units, presumes there is a baseline temperature, below which the plant does not develop, and if it does, it hap-pens on a very reduced scale. It also presumes a linear relationship between temperature increases and plant de-velopment. Each plant species or cultivar has its own baseline temperature, and its value may vary with plant age. Several formulations or models have been suggested for the computation of degree days that are necessary for the plant to attain a given stage of its development cycle, such as: Lyndsey & Newman (l956), Holmes & Robertson (l959), Arnold (l960), Brown (l969), Ometto (l981).
Since the NF region is not a traditional papaya cropping zone and needs supplementary irrigation, knowl-edge on plant growth and development behaviors under these conditions are quite important. Thus, the objective of this work was to study the growth of ‘Improved Sun-rise Soil 72/12’ papaya trees with regard to degree days and its effect on yield, under different irrigation levels.
MATERIAL AND METHODS
The experiment was carried out from Oct/10/ 1998, when transplanting to the field ocurried, to Dec/ 07/1999, at Campos dos Goytacazes, RJ, Brazil (11m above sea level, 21º45’15”S, 41º19’28”W).
The soil of the area is a fluvial-origin Cambisol, with low fertility, shallow, with moderate to imperfect drainage (Sondotécnica, 1983), and physical-hydric char-acteristics are in Table 1. Monthly climatic data, such as mean, maximum and minimum temperatures, reference evapotranspiration (estimated by a Class A Pan) and pre-cipitation during the experimental period were measured by an automatic weather station placed next to the ex-periment. The papaya cultivar was ‘Improved Sunrise Soil 72/12’, planted at a spacing of 3.6 x 2.0 x 2.0 m.
by water flow meters installed in each treatment, and the hydraulic dimensioning was calculated so as to uniformize the flow in all self-compensating micro-sprin-klers.
Treatments, were arranged as randomized blocks, establishing a total of 21 plots, with each plot having five usable plants (n = 3). For the variables plant height, stem diameter, crown diameter and no. of emitted leaves, a split-plot-in-time scheme was considered.
For crop establishment, seeds were initially sown in small bags (Jun/06/1998), and 66 days after germina-tion, were transplanted to the field. During thirty days af-ter transplanting, all treatments received the same appli-cation of water, so they would establish a homogenous field. From this point forth, water depths were differen-tiated. With irrigations performed on Mondays, Wednes-days and FriWednes-days, the application of water for each plot had its volume determined as a function of the water bal-ance between precipitation and the accumulated reference evapotranspiration, of the number of plants per micro-sprinkler (four plants), of the row spacing between plants, of the percentage of wetted area for the crop (70%) and of the coefficient related to the treatments (water depths). The initial fertilization was based on soil analy-sis and the monthly fertilization was performed accord-ing to a recommendation for high productivities (Marin et al., 1995). The management of weeds, pests and dis-eases were carried out systematically by crop inspections and applications of chemicals as needed. Thinning was performed when plants were in full bloom (November, 1998), leaving a single plant per pit, when the evalua-tion of the papaya growth was initiated.
Measurements of plant parameters were per-formed as follows: for plant height, measurements were taken from the plant base at the soil up to the height of the position of the last emitted leaf, and the number of emitted leaves between the interval of each measurement, performed on Dec/02/98, Jan/03/99, Feb/02/99, Mar/04/ 99, Apr/10/99, May/10/99, Jun/10/99, Jul/08/99 and Aug/ 09/99. For stem diameter, a caliper rule was utilized, set at 20 cm the soil surface; measurements were performed on Dec/03/98, Jan/04/99, Mar/22/99, Apr/13/99, May/11/ 99, Jun/11/99, Jul/10/99 and Aug/14/99. With respect to crown diameter, measurements were made in two direc-tions, relative to the planting row, transversal and
longi-tudinal, performed on Dec/03/98, Jan/04/99, Feb/05/99, Mar/05/99, Apr/14/99, May/13/99, Jun/10/99, Jul/10/99 and Aug/14/99.
To quantify the relation between temperature and plant growth in papaya trees in the NF Region, the tem-perature accumulation on the above dates was determined for the parameters relative to the sowing date, according to methodology proposed by Lyndsey & Newman (l956), Holmes & Robertson (l959), Arnold (l960), Brown (l969) and Ometto (l981). The daily mean temperatures were uti-lized for calculating degree days, and the residual method was utilized, through the equation:GD = Tmed – Tb; where, GD – degree days, ºC; Tmed – mean temperature on the day, ºC; and Tb – baseline temperature for the crop, 15ºC, according to Marin et al. (1995).
Considering the yield of the first harvest, i.e., the yield corresponding to the flowers emitted for a six-month period, totaling a period of 16 months of observations from planting, measurements were made of the number of fruits per plant and the weight of each fruit, and pro-ductivity was determined for each plot and, consequently, the mean productivity was determined for each treatment, establishing a relationship between yield and the observed growth. The variables thus obtained were submitted to regression analysis, and the model coefficients were tested up to 5% probability by t test.
RESULTS AND DISCUSSION
Climatic data obtained during the experiment (Figure 1) confirm the potentiality of the NF region for papaya planting with regard to temperature, since the mean, maximum and minimum temperature values lie within the recommended range (Siqueira and Botrel, 1986; Medina, 1989; Oliveira et al., 1994). The minimum temperature, only in the months from June through Au-gust, occurs at values lower than the baseline tempera-ture, leading to a stop in plant growth and development. However, this fact usually occurs in most regions where this crop is planted.
Figure 1 - Climatic data obtained during the experiment period.
C lima tic D a ta
0 5 10 15 20 25 30 35 Jun/98Aug /98 Oct/ 98 Dec/ 98
Feb/98Apr/9 8 Jun/99Aug /99 Oct/ 99 Dec/ 99 Months 0 50 100 150 200 250
Rainfall ETo Tmed Tmax Tmin
T e m perat ure (° C) R a in fa ll e E to ( mm)
Table 1 - Physico-hydric characteristics of the soil of the experiment area. h t p e D y r t e m o l u n a r
G Water content
c i f i c e p S t h g i e w d n a
S Silt Clay Field y t i c a p a c g n i t l i W t n i o p m
c ---- gkg-1---- ----- %vol. ----- gcm-3
0 2
-0 72 5 23 13.5 6.8 1.56
0 4 -0
With respect to the water balance, a smaller oc-currence of precipitation could also be observed relative to the reference evapotranspiration in 12 out of the 16 months of the experiment or, better yet, three months a year, a fact that further confirms the need for supplemen-tary irrigation of the crop. Variation of plant height was observed with respect to water depths, to thermal units (degree days) and also to the interaction between these two, and regression equations were estimated for papaya tree height relative to degree days with regression coef-ficients significant at 5%, by the t test (Figure 2).
Distinct behavior can be visualized in growth of plant height among the various treatments, given the in-teraction between degree days and treatments, and this can be best identified by the curve estimated for T1, which only received water via precipitation. This fact demonstrates the importance of water replacement for the crop, so as to allow its adequate growth and, therefore, result in high yield.
Another situation that should be emphasized is the growth shown by T5 (160% ETo), which had the tall-est plant height during the entire period, differing slightly from the value found by Awada et al. (1979), 129% ETo, probably due because of differences in the coefficients adopted for the irrigation systems, or to different efficien-cies of those systems. If this growth can so on continu-ally, plants submitted to this treatment will reach a height that is unviable for harvest much sooner than plants un-der the other treatments. The fitted curves show a gradual reduction in plant growth with increasing thermal units, a fact also verified by Silva (1999) and cited by Awada (1961).
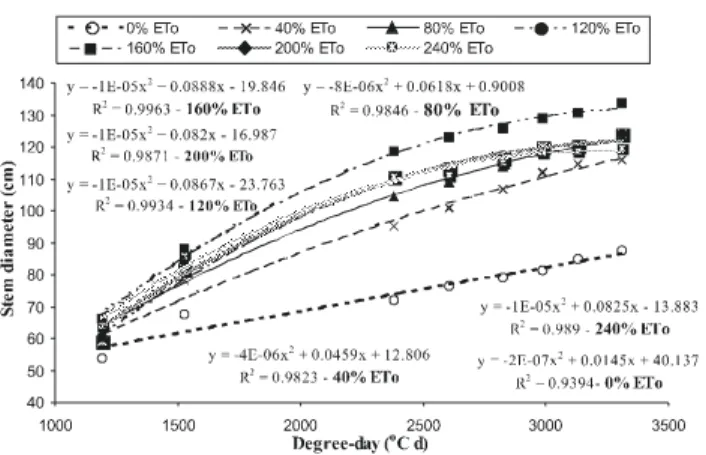
Similarly to the behavior of plant height, there was also variation in stem diameter relative to the water depths, with regard to thermal units and to the interac-tion between these two, and regression equainterac-tions were estimated for stem diameter of the papaya trees relative to degree days for each treatment, with coefficients sig-nificant at 5%, by the t test (Figure 3). With respect to this parameter a greater difference can be noticed between its behavior relative to degree days in the applied
treat-ments, more remarkably in T1 and T2 with smaller growth, and in T5 with greater growth. A decrease in growth occurs around the value of 2,380°C d (beginning of March), for most treatments. This situation was also found by Silva (1999), in Linhares-ES, with a nearby value of 2,300°C d, thus confirming the importance of determining growth parameters as a function of degree days, which is supposed to be independent of location and planting season, but dependent of temperature accumu-lation.
Because of the similarity between the behavior of plant height and crown diameter, greater responses were obtained for T5 which were also found by Awada et al. (1979), for a replacement of 129% ETo, a differ-ence that can possibly be explained by the factors previ-ously mentioned. Variation was detected for mean crown diameter with regard to thermal units, for all irrigation treatments, and their interactions. The respective regres-sion equations were estimated, and the coefficients for those equations were significant at the 5% probability level, by the t test (Figure 4).
The growth of crown diameter was influenced not only by water availability, but also by temperature. This
Figure 3 - Estimate of stem diameter growth in relation to degree days, for each irrigation treatment.
Figure 2 - Estimate of plant height growth in relation to degree days, for each irrigation treatment.
becomes evident when the differences between the treat-ment without irrigation (T1) and those with irrigation (T2 to T7) are visualized. The first treatment presents little growth, or even a decrease in thermal units from 1,500 to 2,000°C d, corresponding to spells of dry and hot weather (“veranicos”) in January and February 1999, a period of high temperatures, while the other treatments presented greater growth, but less marked in T2, which received the shallowest water depth. Stabilization and then a reduction in crown diameter occurred near ther-mal units of 2,500°C d for all treatments, a fact that re-lates to the beginning of the winter, with the occurrence of low temperatures.
In spite of the differences in the fitted curves found by Silva (1999) due to the different seasons in which the analyses were performed, the same behavior for crown diameter was verified in this experiment, in which stabilization and then a decrease in growth were verified starting during winter, and growth was resumed at the beginning of the summer, being more or less dis-tinct as a function of the smaller or greater application of water depths, respectively.
Even though the difference was small, T5 had the greatest crown diameters, during the entire evaluation period, having practically the same thermal units as T3, in the vicinity of 3,000°C d. Thus, in general papaya trees tend to reduce their crown diameters with time; however, the values verified in this work seem to be related to the lack of soil water (T1), which was also verified by Aiyelaagbe et al. (1986), and to the low winter tempera-tures influencing all evaluated treatments, a condition also found by Silva (1999). No other reductions were detected. Variations in the number of emitted leaves were obtained during the evaluated period in relation to ther-mal units, in all irrigation treatments and their interac-tions; the respective regression equations were estimated, and the coefficients were significant at 5%, by the t test (Figure 5). The estimated regressions did not present suf-ficiently high coefficients of determination, demonstrat-ing that they do little to explain the data obtained, de-spite the observed significance. This could probably be related to the fact that in studies conducted by Aiyelaagbe et al. (1986) and Awada et al. (1979), while studying wa-ter stress in papaya trees, found that the no. of leaves of plants submitted to water stress decreases only due to leaf abcission and not because of the number of emitted leaves, since the numbers of nodes in the plants were the same, and only the distance between nodes was differ-ent, under the different moisture regimes.
However, in the present work, when leaf emis-sion is analyzed under ranges of water application, small differences can be observed in leaf emission between T3, T4 and T5 and between T6 and T7, but with differences in emissions between the sets of treatments. With regard
to treatments with low application of water (T1 and T2), the difference in the emission of leaves is large both be-tween them and bebe-tween the sets in the other ranges of treatments, thus demonstrating that there are differences in the emission of leaves as a function of the water depth, and no inference on leaf abscission can be made over the fact that the total number of leaves present in the plant in each period was not evaluated.
Based on the yield data obtained during a 16-month period, for each applied treatment (Table 2), varia-tions were observed relative to the different water depths, or total water depths. The respective regression equations were estimated, and the coefficients for those equations were significant at 5%, by the t test (Table 2).
The growth parameters evaluated in the treat-ments give an indication of yield potential, i.e., each ir-rigation water depth applied corresponds to a certain growth relative to degree days and, in general, the in-crease in this growth corresponds to an inin-crease in yield.
Figure 5 - Estimate of the no. of emitted leaves between each period in relation to degree days, for each irrigation treatment.
Table 2 - Summary of yield data: applied treatment (Trat), treatment as percentage of evapotranspiration (ETo), irrigation water depth applied (LI), total water depth applied - irrigation + precipitation (LT), and mean productivity obtained (Prod).
*Regression equation fitted for productivity: y = -0.00002.x2 +
0.09809.x - 88.12 - R2 = 0.92 - with 1% probability significance for
the coefficients, by t test.
) o T E ( t a r
T LI LT Prod*
% --- mm--- tha-1
) 0 ( 1
T 80 1,268 7.4
) 0 4 ( 2
T 504 1,692 26.7
) 0 8 ( 3
T 886 2,074 48.3
) 0 2 1 ( 4
T 1,292 2,480 45.1
) 0 6 1 ( 5
T 1,749 2,937 53.0
) 0 0 2 ( 6
T 2,185 3,373 41.2
) 0 4 2 ( 7
Received November 13, 2001 Accepted April 18, 2003 These relationships between growth and obtained yields
can be visualized when growth data are compared to yield data; an increase in values can be perceived for most growth parameters up to T5, dropping in T6 and T7 (Fig-ures 2, 3, 4 and 5), which occurs in the same way with yield data (Table 2). The greatest values for parameters plant height and stem diameter corresponded to the great-est productivity, when an irrigation water depth of 160% Eto was applied. The same was also verified by Srinivas (1996), but with a water replacement of 120% ETo, prob-ably because of the adoption of different coefficients re-lated to water replacement, or to different efficiencies in the irrigation systems. Several authors have verified that increases in growth parameters correspond to yield in-creases; however, they did not find values greater than those verified in this work, as well as a decrease in growth and yield after a certain amount of water was applied, since they did not apply water at depths great enough to ensure this (Aiyelaagbe et al., 1986; Awada, 1961; Awada et al., 1979; Silva, 1999; Srinivas, 1996).
Since the evaluated growth parameters are pos-sibly indicative of yield potentials, the evaluation of such parameters alone will be sufficient to determine suitable irrigation management conditions for papaya cropping in the NF Region and, as a consequence, to produce high yield. In conclusion, the possible creation of tools to al-low growth estimation and therefore yield estimation as a function of climatic conditions deserves additional in-vestigation.
ACKNOWLEDGEMENTS
To FENORTE for granting the scholarship, and UENF for the support. Thanks are also due to Profs. S. Bernando and E.F. de Sousa for the guidance and sup-port, and Technicians Sérgio L.D. Marin and Sidney Grippa for unvoluable help.
REFERENCES
AIYELAAGBE, I.O.O.; FAWUSI, M.O.A.; BABALOLA, O. Growth, development and yield of pawpaw (Carica papaya L.) homestead selection in response to soil moisture stress. Plant and Soil, v.93, p.427-435, 1986.
ARNOLD, C.Y. Maximum-minimum temperatures as a basis for computing heat units. Procedures of American Society Horticulture Science, v.76, p. 682 - 692, 1960.
AWADA, M. Soil moisture tension in relation to fruit types of papaya plants.
Hawaii Farm Science, v.10, p.7-8, 1961.
AWADA, I.P.; SUEHISA, R.H.; PADGETT, M.M. Effects of drip irrigation and fertilization on vegetative growth, fruit yield, and mineral composition of the petioles and fruits of papaya. Honolulu: Agricultural Experiment Station, University of Hawaii, 1979. 20p. (Boletim Técnico, 103)
BROWN, D. M. Heat units for corn in southern Ontario. Department of Agriculture and Food, Toronto, Ontario Information Leaflet, p.111-131, 1969.
HOLMES, R.M.; ROBERTSON, G.W. Heat units and crop growth.
Canadian Defense Agriculture Publicatio,. p.1042-1050, 1959. KISH, A.J. Forecasting maturity date of snap beans in South Carolina U. S.
New York, Department Commerce Technology, v.20, p.1-7, 1967. LYNDSEY, A.A.; NEWMAN, J.E. Use of official weather data in spring
time-temperature analysis of an Indiana phenological record. Ecology, v.37, p.812-823, 1956.
MARIN, S.L.D.; GOMES, J.A.; SALGADO, J.S.; MARTINS, D.S.; FULLIN, E.A. Recomendações para a cultura do mamoeiro dos grupos Solo e Formosa no Estado do Espírito Santo. 4.ed. Vitória: EMCAPA, 1995. 57p. (Circular Técnica, 3)
MEDINA, J.C. Cultura. In: INSTITUTO DE TECNOLOGIA DE ALIMENTOS. Mamão. 2.ed. Campinas: ITAL, 1989. p.1-178. (Série Frutas Tropicais, 7)
MOTA, F. S. Meteorologia agrícola. 7. ed. São Paulo: Nobel, 1986. 376p. OMETTO, José C. Bioclimatologia vegetal. São Paulo: Ed. Agronômica
Ceres, 1981. 425 p.
OLIVEIRA, A.M.G.; FARIAS, A.R.N.; SANTOS FILHO, H.P.; OLIVEIRA, J.R.P.; DANTAS, J.L.L.; SANTOS, L.B. dos; OLIVEIRA, M. de A.; SILVA, M.J.; ALMEIDA, O.A. de; NICKEL, O.; MEDINA, V.M.; CORDEIRO, Z.J.M. Mamão para exportação: aspectos técnicos de produção. Brasília: EMBRAPA, SPI, 1994. 52p. (Série Publicações Técnicas FRUPEX, 9).
ROBERTSON, G. W. A biometeorological time scale for a cereal crop involving day and night temperatures and photoperiod. International Journal of Biometeorology, v.3, p.191-223, 1968.
SILVA, J.G.F.da. Efeitos de diferentes lâminas e freqüências de irrigação sobre o desenvolvimento e a produtividade do mamoeiro (Carica Papaya L.) Viçosa: UFV, 1999. 90p. (Tese - Doutorado)
SIQUEIRA, D.L. de; BOTREL, N. Clima e solo para a cultura do mamoeiro.
Informe Agropecuário, v.134, p.8-9, 1986.
SONDOTÉCNICA. Estudos de Levantamentos Pedológicos. In: TAVARES, P. E. M.; FEGUNDES, E. A. Projeto de irrigação e drenagem da cana-de-açúcar na região norte Fluminense. Piracicaba: IAA, 1983. v.1. SRINIVAS, K. Plant water relations, yield, and water use of papaya (Carica
papaya L.) at different evaporation-replenishment rates under drip irrigation. Tropical Agriculture, v.73, p.264-269, 1996.
WANG, J.Y. A critique of the heat unit approach to plant response studies.