Fiabilitate si Durabilitate - Fiability & Durability no 2(8)/ 2011 Editura “Academica Brâncuşi” , Târgu Jiu, ISSN 1844 – 640X 31
THE USED ALGORITHMS DESCRIPTION IN DEVELOPING
COMPUTER PROGRAMS OF CERTAIN MORPHOLOGICAL
ESTIMATORS OF THE NON-EUCLIDIAN FORMS
dr.ing. Delicia ARSENE, ing. George ARSENE,
dr.ing.Claudia BORDA, dr.ing. Marinela MARINESCU, dr.ing. Larisa BUTU, dr.ing.Delia GARLEANU, dr.ing. Gabriel GARLEANU,
“Politehnica” University of Bucharest
Abstract: The aim of this paper is to introduce a computerized calculation program of the fractal dimension.The
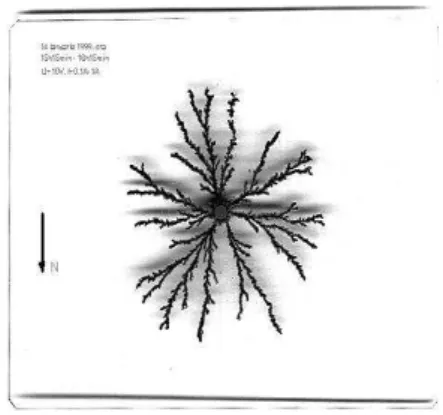
fractal dimension is an estimator attached to the non-euclidian forms which presents a fractal character.The article presents the increases branched copper produced by electrolytic deposition from solution of CuSO4.
Keywords: Fractal physics, morphological estimators, image analysis.
1. Introduction
The authors have proposed a complex algorithm evaluation forms that occur in technological processes. Currently, for these forms there are not used but associative judgments which do not worth any comparison value in a concrete classification. The estimators that are introduced are those specific to the physics of fractal. Their calculation was made by a computer program developed in Borland Pascal programming language. The paper deals only with processing and image acquisition, the actual calculation of fractal estimators will be presented in another article. In the figure there are exemplified, just as information, also the values obtained in the analysis of a branched structure.
2. Experimental context
An experimental stand was manufactured in order to obtain the ramified clusters. It was made a copper dendrite analysis. The image was acquired by scanning at 300dpi esolution and size of 640x480 pixels, a pixel size being considered satisfactory to perform investigations. The gray level above a certain threshold was considered to define the cluster edge. The cluster edges are sufficiently accurate and the results of the dimensions calculations do not depend in a defining measure on the size threshold.
Fiabilitate si Durabilitate - Fiability & Durability no 2(8)/ 2011 Editura “Academica Brâncuşi” , Târgu Jiu, ISSN 1844 – 640X 32
As we know, one of the essential characteristics of fractal objects is that they manage to pack in a relatively small zone very high perimeters, in case of two-dimensional structures, or in relatively small volumes large areas for 3D structures. If we look at 2D and to define the terms "relatively small" and "relatively large" we say that the Euclidean perimeter which delineate a surface area increases theoretically unlimited when it is a fractal object, depending on the unit size that measured it. So we can say that if:
l 0 then ; p and A ct.
where: l is the length unit which made the perimeter measurement; p – the fractal object perimeter; A – the fractal object area.
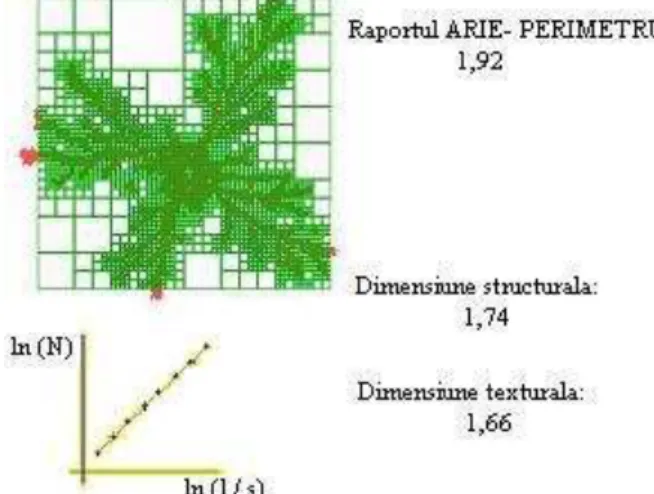
These unlike the Euclidean figures where the perimeter size does not depend on the length unit of which the measurement is made. So we thought appropriate to introduce the area-perimeter relation, we can give us a measure of the complexity of object edges, a measure of the packing degree; that's why we will call it, the packing dimension. We call the packing dimension the perimeter log slope graph function of log area length unit which we measure it. Both the generated articles by iterative functions and for the natural objects (the Cu electrolytic depositions) is measured with perimeter different lengths. It plots log (Perimeter) / log (measurement unit) and the obtained graph slope is calculated by the interpolation function. This is the packing dimension. It characterizes the subject from the global point of view. The script works with the Matlab program.
For the electrodeposition clusters we used the scanned images with the 300 dpi density and the 640 x 480 pixels resolution, with four levels of the measurement unit. With the same length unit we investigated also the single-scaled snowflakes, two-scaled and DLA aggregates. The program course is divided into four parts: 1) Binarization ; 2) Filtration
(purification); 3) Thinning; 4) “Box-counting” calculation method of D4 dimension.
We present below the mechanic image processing steps implemented in the software engineer.Binarization: - manual determined threshold level; - automatic fixed threshold level; - dynamic threshold level . Purification : - expansion and syncopation; - expansion and syncopation in the labeled regions order;- regions extraction on surface basis;- regions selection specifically connected;- the logic operation between two binary images.
3. General specific issues to computer imaging processing
During computer imaging processing aims at an image transformation into another image or at obtaining of certain information about an image, obviously in a smaller amount less the image contains.
An image is transformed by sampling and quantization into a two-dimensional discrete numerical sequence. The image sample wears in the special literature the name of "pixel" its value indicating - for a black and white image - a gray level. The gray level is a luminance image measure at that point. Luminance is encoded by a nonnegative number, gj, where: j {
Fiabilitate si Durabilitate - Fiability & Durability no 2(8)/ 2011 Editura “Academica Brâncuşi” , Târgu Jiu, ISSN 1844 – 640X 33
These distortions reveal certain image characteristics to their observation by a human operator or by the automatic extraction of features.
The processes known as image segmentation denominations, image description, image features extraction, follow image processing in a more simple one, discarded of the information "ballast". The aim is to extract some image segments to measure certain properties - area, length, curvature - and also its description for the purpose of classification or automatic recognition.
3.1. Data structure in a discretized image
A set of S pixels of an image are i-connected (where i = 4 or i = 8) if the ()pS and Vq S and there is a pixels sequence in i-connectivity, pj S, so that p0 = pn = p so pn = q
and pj-1 and pj are i-connected. The sequence {pj} is a i-connected path. The path length is
n.
In the figure 2 the S set is composed from the shaded region. It is octa-connected, but it isn't tetra-connected, because between p and q there are only octa-connected roads (such a road is shown in the figure.
Fig. 2. The "n" length of a road in a octa-connected lot .
The image blurring affects the contours reducing their slope. The blurring is modeled by a convolution, therefore an integration operation which acts as a low pass filter, reducing high frequencies and "deleting" the contours accordingly. It follows that for contouring should be used the emphasizing the high frequencies to operators of differentiation operators. Since sharp edges which can be emphasized can have any direction, the direction operator should be isotropic (rotation invariant).
If the noise affecting the image acts as a periodic structure consisting of fine elements which overlap the image that can be used for processing in global transforms area. Noise like "salt and pepper" may be removed by a simple method based on comparing the pixel gray level with the average gray level of its octa-connected neighbors. Threshold detection considers the pixels grey level, level which is compared with a threshold . The
comparison result is the criterion after which the pixel is qualified as part from S or from its complementary, S . The threshold detection choice is an important issue for successful segmentation.
3.2. The filtration operation
Fiabilitate si Durabilitate - Fiability & Durability no 2(8)/ 2011 Editura “Academica Brâncuşi” , Târgu Jiu, ISSN 1844 – 640X 34
This noise type is shown below:
127 129 133 122 145 129 121 120 125
The squares are pixels, and the numbers contained in them represent the color code (shades of gray). It is noted that the central point is totally different from the surrounding points sequence. The filtering operation involves the application of some matrix masks 3 x 3 from the next form: where x = 1 ... 10 and represents the share point average.
In fact each point (pixel) is mediated by its neighbors as follows: all pixels values are added in the matrix of 3 x 3 the matrix multiplications and then is divided by the weights sum. For the above examples, where the share central point (intermediate) is 2, results the new value of this item is:
N=(127+129+133+122+121+120+129+2*145):10=130
So, the above example will become:
123 129 133
122 130 129
121 120 135
This filtering is very useful because from experience I found that for images with small breaks in the continuity limit through this filtering, the missing in continuity disappear. At the end of the extraction limit, it must be continuous for the lack of a single pixel would introduce gross errors in measurements.
At the end of this filtering operation it is required wrapping option of the desired area from the image that is intended to be analyzed.
3.3. The grain boundary extraction
Through this operation from the original image, which was presented in 256 colors, you get a bimounted picture. This image should contain the object limit, but on this line will be other noises like black spots and the and scattered points, etc. This operation principle is that the grain limit, having a certain range of hues, it should be detected from the image. Under this principle, things may seem to be simple only because the different reasons (visual effects camera, different lighting on the sample surface, etc.) can happen that in an area the object limit nuance is the same as a segment hue of another image area. With this in mind, based on image, many limit detection variations are possible: - manual threshold;- automatic threshold ;- dynamic threshold ;- the derivatives method ;- manual identification from the histogram (for very good images).
Fiabilitate si Durabilitate - Fiability & Durability no 2(8)/ 2011 Editura “Academica Brâncuşi” , Târgu Jiu, ISSN 1844 – 640X 35
This operation is very useful because they have brightness variations.
The derivative method uses the following principle, namely: the transition from the grain boundary at the limit area takes place a sudden drop of the algebraic values of the pixels nuances and of the variation of over a derivative certain amount at the respective point. So the differences of each point from its neighbors are calculated and then the points that have greater differences than an average value, it is considered limit points. This detection method is useful for metallographic structures in which the grain limit is considered the transition area between a dominant color and another dominant color.
The manual identification from the histogram is only used if in the histogram appears clearly the nuances area of the grain boundary as the Gauss bell. With two mobile cursors this area is identified and the binarization is performed on this criterion. It appears that not only the grain limit is extracted but it appears that other components are seen as a limit. These will be further processed.
3.8. Expansion and contraction
The expansion is the operation in which each boundary point which has at least one outside neighbour (in the grain). It is added to it a number of four or eight points around. Through this is obtained what is called four neighbours expansion, in cross, or expansion on eight neighbours. Contraction is nothing but a grain expansion operation at the expense of limit. These two operations are used only both in the sequence expansion, contraction, because otherwise the structure topology is deteriorated.
Expansion and contraction can be done also with other masks in addition to those listed here. These operations are useful for "filling" of the various discontinuities caused by noise. For example, a limit stops and the space between the two ends is of two pixels. By expansion each pixel from the end lies with a further one and so the two ends are connected. The contraction operation does not interrupt this zone limit.
We stressed earlier that the grain limit, after extraction and subsequent processing, appears as a band that has a certain thickness, and the limit is considered as having the minimum thickness allowed by the image resolution. This requires the grain limit thinning without breaking it. For this purpose we have developed several thinning algorithms and further on I will present one of them.
The algorithm works on the interior grain expansion idea at the expense of the limit. This occurs successively for each grain separately. At each step is "peeling" only one pixels row from the limit, this for a grain should not particularly grow at the expense of its neighbours. An algorithm for a grain is used, the algorithm which is repeated for each grain. This works on the idea of browsing and inserting pixels which belong to the limit, pixels that have at least one connection to the grain tested. Then all these pixels being tested in terms of breaking the grain limit connectivity and will be removed those pixels that satisfy this condition.Thus obtained the limit, if it is desired and is necessary, the limits reconstruction can be done manually or automatically.
As we can note from the image, this algorithm keeps those limits which are not connected to the grain limits net than through a point or even through no one.
3.10. Limits reconstruction
Fiabilitate si Durabilitate - Fiability & Durability no 2(8)/ 2011 Editura “Academica Brâncuşi” , Târgu Jiu, ISSN 1844 – 640X 36
The automatic reconstruction operation searches on the image the points which have only one neighbour, these being end points from the limit and depending on the line direction of which it belongs is looking for another point of the same class with it. This search is done only on a few pixels away and if it finds a point, the two will be joined by a line.
With this operation end, the limit is determined and is automatically saved in the memory from this moment it can be applied the quantitative analysis methods.
Fig. 3. Illustration of image analysis for the box-counting algorithm.
4.Conclusions
Presented program brings new elements in the assessment of complex technological forms, it is easy to use and is intended to be a handy tool for the technologist engineer.
Original elements in the acquisition and image analysis: designing a language program in Borland Pascal 7.0 for the implementation of the fractal dimension calculation Dq method "box-counting"; designing an algorithm for image thinning limit; the implementation of a procedure for image thinning limit; the development of an expansion and contraction
procedure of the grain limit; the development of a procedure for scanning the image with the exploration line for the linear analysis method; the development of a filtering image
procedure.
Section on methodology for calculating the fractal estimators will be presented in a future paper.
References
[1]. Arsene Delicia, Stabilitatea Formei si interpretarea acesteia prin fizica fractala, PhD Thesis, Bucuresti, 1999.
[2] D. Arsene, Introducere in cunoasterea fractalilor. Ed. Printech, Bucuresti 2004
[3] D. Arsene, C. Borda, Ghe. Arsene, Fractalitatea-Dimensiune universala. Ed. Printech, 2008
[4]. Funakubo, N., Fractal Based analysis and Interpolation of 3D Natural Shapes, Comput Vision, Graf. And Image Process., Vol.46, pp.284-302,1989.