www.atmos-chem-phys.net/13/3393/2013/ doi:10.5194/acp-13-3393-2013
© Author(s) 2013. CC Attribution 3.0 License.
Atmospheric
Chemistry
and Physics
Geoscientiic
Geoscientiic
Geoscientiic
Geoscientiic
Temperature-dependent accumulation mode particle and cloud
nuclei concentrations from biogenic sources during WACS 2010
L. Ahlm1,*, K. M. Shakya1,**, L. M. Russell1, J. C. Schroder2, J. P. S. Wong3, S. J. Sjostedt4,***, K. L. Hayden4, J. Liggio4, J. J. B. Wentzell4, H. A. Wiebe4, C. Mihele4, W. R. Leaitch4, and A. M. Macdonald4
1Scripps Institution of Oceanography, University of California, San Diego, La Jolla, California, USA 2Department of Chemistry, University of British Columbia, Vancouver, BC, Canada
3Department of Chemistry, University of Toronto, Toronto, Ontario, Canada 4Science and Technology Branch, Environment Canada, Toronto, Ontario, Canada *now at: Department of Applied Environmental Science, Stockholm University, Sweden
**now at: Division of Environmental Health, Department of Public Health, School of Public Health and Health Sciences, University of Massachusetts, Amherst, Massachusetts, USA
***now at: Department of Chemistry and Biochemistry, Georgia Institute of Technology, Atlanta, Georgia, USA
Correspondence to:L. M. Russell ([email protected])
Received: 12 October 2012 – Published in Atmos. Chem. Phys. Discuss.: 24 October 2012 Revised: 12 February 2013 – Accepted: 8 March 2013 – Published: 25 March 2013
Abstract.Submicron aerosol particles collected simultane-ously at the mountain peak (2182 m a.s.l.) and at a forested mid-mountain site (1300 m a.s.l.) on Whistler Mountain, British Columbia, Canada, during June and July 2010 were analyzed by Fourier transform infrared (FTIR) spectroscopy for quantification of organic functional groups. Positive ma-trix factorization (PMF) was applied to the FTIR spectra. Three PMF factors associated with (1) combustion, (2) bio-genics, and (3) vegetative detritus were identified at both sites. The biogenic factor was correlated with both temper-ature and several volatile organic compounds (VOCs). The combustion factor dominated the submicron particle mass during the beginning of the campaign, when the tempera-ture was lower and advection was from the Vancouver area, but as the temperature started to rise in early July, the bio-genic factor came to dominate as a result of increased emis-sions of biogenic VOCs, and thereby increased formation of secondary organic aerosol (SOA). On average, the biogenic factor represented 69 % and 49 % of the submicron organic particle mass at Whistler Peak and at the mid-mountain site, respectively. The lower fraction at the mid-mountain site was a result of more vegetative detritus there, and also higher in-fluence from local combustion sources.
The biogenic factor was strongly correlated (r∼0.9) to number concentration of particles with diameter (Dp) >
100 nm, whereas the combustion factor was better corre-lated to number concentration of particles withDp<100 nm (r∼0.4). The number concentration of cloud condensation nuclei (CCN) was correlated (r∼0.7) to the biogenic fac-tor for supersaturations (S) of 0.2 % or higher, which indi-cates that particle condensational growth from biogenic va-pors was an important factor in controlling the CCN concen-tration for clouds whereS≥0.2 %. Both the number concen-tration of particles withDp>100 nm and numbers of CCN for S≥0.2 % were correlated to temperature. Considering the biogenic influence, these results indicate that temperature was a primary factor controlling these CCN concentrations at 0.2 % supersaturation.
1 Introduction
uncertainties remain concerning the formation of secondary organic aerosol (SOA) from oxidation products of volatile or-ganic compounds (VOCs) (e.g., Hallquist et al., 2009). Glob-ally, emissions of biogenic VOCs (BVOCs) are estimated to be an order of magnitude larger than anthropogenic VOCs (Goldstein and Galbally, 2007), and oxidation of BVOCs yields a large biogenic contribution to SOA, estimated to be in the range of 12–70 Tg yr−1 (Hallquist et al., 2009). The SOA concentration has been predicted to increase by over 100 % until the year 2100 (Tsigaridis and Kanakidou, 2007) due to future expansion of boreal and temperate forests, and thereby increasing BVOC emissions.
The forested regions surrounding Whistler, British Columbia, Canada, present a large source of biogenic aerosols and trace gases that have previously been the cen-ter for biogenic particle studies (Schwartz et al., 2010; Leaitch et al., 2011; Takahama et al., 2011). Schwartz et al. (2010) quantified organic aerosol functional groups at a mid-mountain site at Whistler Mountain in May and June 2008 using Fourier transform infrared (FTIR) spectroscopy. By applying positive matrix factorization (PMF) to FTIR spectra and investigating correlations between factors and tracers, they estimated that 65 % of the organic mass was from biogenic sources, and the remaining fraction from com-bustion sources. Takahama et al. (2011) performed similar measurements at Whistler Mountain in 2009, and in addition to biogenic and combustion aerosols also observed biomass burning particles. Leaitch et al. (2011) found an exponen-tial increase in the submicron organic aerosol mass concen-tration, with increasing temperature consistent with modeled emissions of BVOCs as a function of temperature.
The Whistler Aerosol and Cloud Study (WACS) 2010, a large measurement campaign with focus on aerosols and clouds at Whistler Mountain, was carried out in June and July 2010. Macdonald et al. (2013) give an overview of the cam-paign, and found that organic compounds largely dominated the aerosol throughout most of the campaign. In this study we focus on the organic aerosol during WACS 2010, and in-vestigate the sources responsible for the organic aerosol mass during four periods with different meteorological conditions and advection from different areas. In addition, we investi-gate the sources or processes that control the particle number concentration. Finally, we explore links between the organic aerosol and CCN concentrations, and the sources and pro-cesses that controlled the CCN population during this cam-paign. Unlike previous campaigns at Whistler, we use aerosol and gas-phase data sampled simultaneously at two different sites at different altitudes on Whistler Mountain in order to investigate local sources, formation and transport of organic aerosols.
2 Sites and methods
2.1 Field sites
The measurements in this study were performed simulta-neously at two sites on Whistler Mountain: Whistler Peak (WHI), at an altitude of 2182 m a.s.l.; and Raven’s Nest (WRN), a mid-mountain site at 1300 m a.s.l. Raven’s Nest is located near halfway between Whistler Village (650 m a.s.l.) and WHI.
WHI is approximately 400 m above the tree line. Raven’s Nest is surrounded by forest composed mostly of coniferous trees such as fir, hemlock and cedar. These sites may also be influenced from biomass burning aerosols in the sum-mer, but during WACS 2010 such an influence was present only during the last three days of the study. Vancouver is the closest large city to Whistler, located approximately 100 km to the south. The two sites employed in this study are de-scribed more extensively in Macdonald et al. (2013), Pierce et al. (2012), and Wong et al. (2011).
2.2 Experimental
2.2.1 Filter sampling and analysis
Submicron particles were collected on 37 mm teflon filters (Teflo, Pall Inc., Ann Arbor, MI) at both Raven’s Nest and Whistler Peak. At Raven’s Nest the filters were sampled from 21 June to 28 July. All filters at Raven’s Nest were sampled for 24 h, and were changed at 09:00 local time (LT) every morning. The sampling setup included two filters sampled simultaneously, one with a diffusion dryer located upstream of the holder. In this manner dried and nondried aerosol was sampled simultaneously.
At Whistler Peak, filters were sampled from 19 June to 28 July. The mean sampling times were three days for the period 19 June–2 July and 24 h from 2 July–28 July. The filters were changed at 09:00 LT. The sampler did not include a dryer at Whistler Peak. Filters were housed in a refrigerator at ca. 5◦
C during sampling to reduce volatilization of organic compounds.
At both sites a duplicate back filter was located behind each sampling filter to provide a measurement for adsorp-tion during sampling and contaminaadsorp-tion during handling and storage. After sampling, the filters were kept frozen to pre-vent volatilization of the aerosol.
by the teflon filter itself. An algorithm described by Russell et al. (2009) was used to provide baselining, peak fitting, and error estimation. The dried and nondried filter samples from Raven’s Nest had close to identical functional group concentrations resulting from the FTIR analysis. Therefore, throughout this paper only the nondried filters from Raven’s Nest will be included in the discussion for a more direct com-parison with those at Whistler Peak where no dryer was in-volved in the filter sampling.
Organosulfate groups were investigated by a method de-scribed by Russell et al. (2009), where filter samples are rinsed with hexane to separate organosulfate groups from bisulfate and carbonate since these compounds all have ab-sorbance peaks at 876 cm−1. However, none of the filters had organosulfate concentrations above detection limit after rins-ing.
Most of the filter samples, from both Whistler Peak and Raven’s Nest, were also analyzed with X-ray fluorescence (XRF) which provides elemental composition of the aerosol, including all elements heavier than Na (Maria et al., 2003). The XRF analysis was conducted by Chester LabNet (Tigard, Oregon).
2.2.2 Spectromicroscopy
Particles were also collected on silicon nitride windows (Si3N4, Silson Ltd.), and were later analyzed by scanning transmission X-ray microscopy with near-edge X-ray ab-sorption fine structure (STXM-NEXAFS) spectroscopy at the Advanced Light Source (ALS) at Lawrence Berkeley Na-tional Laboratories (Beamline 5.3.2). Particles were analyzed for carbon K-edge by scanning at energy levels between 278 and 320 eV (Kilcoyne et al., 2003). Spectra from ALS were processed using algorithms developed by Takahama et al. (2010), and using aXis software (Hitchcock, 2000). These measurements and the described analysis provide informa-tion of single particle organic funcinforma-tional groups of carbon containing particles as well as their size and morphology (Takahama et al., 2007).
2.2.3 Complementary measurements
The nonrefractory chemical components of the submicron aerosol particles were measured using aerosol mass spec-trometry at both Whistler Peak and Raven’s Nest. An Aero-dyne Compact Time-of-Flight aerosol mass spectrometer (C-ToF-AMS) (Drewnick et al., 2005) was used at Whistler Peak, and a High-Resolution Time-of-Flight aerosol mass spectrometer (HR-ToF-AMS) (DeCarlo et al., 2006) was used at Raven’s Nest.
Particle number size distributions were measured with TSI Scanning Mobility Particle Sizers (SMPS). An SMPS (3081L column and 3775 CPC) was used at Whistler Peak for particles in the 14–600 nm diameter interval, and at Raven’s Nest for particles in the 16–700 nm diameter interval.
Number concentrations in the 0.65–20 µm diameter inter-val were measured with a TSI Aerodynamic Particle Sizer (APS) at Raven’s Nest. At Whistler Peak, number concen-trations in the 0.25–32 µm diameter interval were measured with an optical particle counter (OPC).
Numbers concentrations of CCN at different supersatu-rations (S), in the range 0.07–1.0 %, were measured with a CCN counter from Droplet Measurement Technologies, Inc. (DMT-200 CCN counter) (Roberts et al., 2003).
Black carbon (BC) number concentrations with a mass equivalent diameter interval of 90–270 nm were measured at each site with a Single Particle Soot Photometer (SP2), from Droplet Measurement Technologies, Inc.
Mixing ratios of several VOCs were measured using proton transfer reaction mass spectrometry (PTR-MS). A quadrupole PTR-MS was used at Whistler Peak, and a time-of-flight PTR-MS (PTR-ToF-MS) was used at Raven’s Nest. Measurements of NO and NO2 were conducted at both Whistler Peak and Raven’s Nest using a chemiluminescence-based NO/NOxinstrument (Thermo Scientific Model 42C-TL) with a photolytic converter specific for NO2 detection. In addition, meteorological measurements of parameters in-cluding temperature, relative humidity, and wind speed were made at both sites.
3 Results and discussion
3.1 Time series
Most measurements in this study were performed during the time period of the WACS 2010 campaign, 20 June to 28 July 2010. During this period organics contributed on aver-age 89 % at Whistler Mountain and 74 % at Raven’s Nest to the submicron particle mass sampled by the AMS. The cor-responding contribution from sulfate was only 7 % and 19 %, respectively, at the two sites, and the contributions from am-monium and nitrate were below 5 % at both sites.
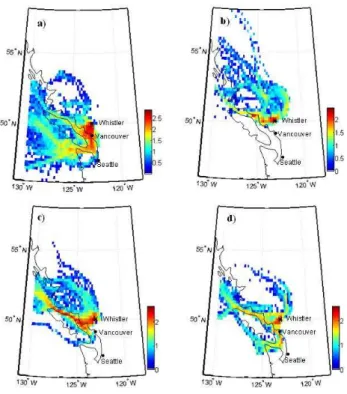
Fig. 1.HYSPLIT back trajectory (72 h) analysis for trajectories ini-tiated at Whistler, with meteorological data sets from the Eta Data Assimilation System (EDAS) for(a)period 1,(b)period 2,(c) pe-riod 3, and(d)period 4. The color scale indicates log10of the num-ber of trajectories that have passed through a certain grid cell. The grid cells are 0.2 degrees wide in both latitudinal and longitudinal direction. For every day, 24 back trajectories have been calculated with an interval of one hour between each trajectory.
concentrations in the filters sampled at Raven’s Nest (Fig. 2g) the concentrations of the submicron dust elements Al, Si, Ca, and Fe were relatively low during this period compared to the later periods. Also, concentrations of coarse-mode particle number concentrations were low during period 1 (Fig. 2h), indicating low dust concentrations for particles larger than 1 µm.
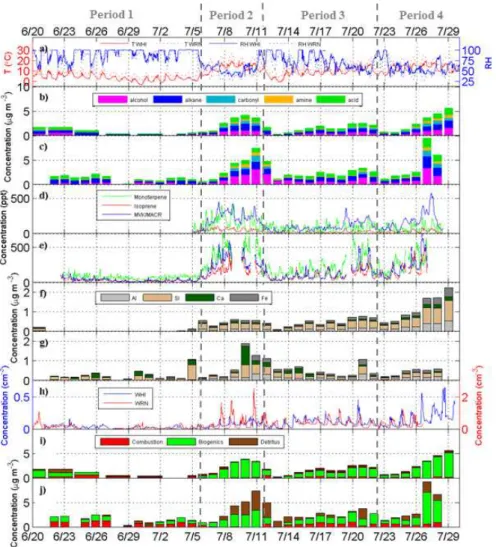
Period 2 (5–11 July) was initiated by rapidly increasing temperature (Fig. 2a), which was followed by increased con-centrations of the biogenic tracers monoterpene, isoprene, methyl vinyl ketone/methacrolein (MVK/MACR) (Fig. 2d– e), accompanied by increasing concentrations of organic aerosols (Fig. 2b–c). (The PTR-MS cannot resolve MVK from MACR, so MVK/MACR denotes the sum of the two). Organic aerosol concentrations, as quantified by the FTIR analysis, reached almost 8 µg m−3 at Raven’s Nest and 4 µg m−3 at Whistler Peak on 10–11 July. The average FTIR organic concentrations during period 2 were 3.7 and 2.4 µg m−3at Raven’s Nest and Whistler Peak, respectively. At Raven’s Nest the alcohol groups were at very high lev-els (Fig. 2c), reaching 3.1 µg m−3 on 10 July. At Whistler Peak, the alcohol concentration reached a maximum of only
1.1 µg m−3during period 2. The alkane and carboxylic acid groups had rather similar concentrations at the two sites. Unlike period 1, period 2 had significant concentrations of nonacid carbonyl, reaching a maximum of 1.2 µg m−3 at Raven’s Nest, and 0.7 µg m−3 at Whistler Peak. Advection was during this period initially from the northerly areas, changing to easterly later during the period (Fig. 1b). The areas to the north and east of Whistler have relatively few anthropogenic sources. The skies were mostly clear with oc-casionally a few scattered cumulus based several hundred meters above the Whistler Peak site. That observation to-gether with relatively strong diurnal variations in meteoro-logical parameters such as temperature and relative humid-ity at Whistler Peak indicates that the mixed layer grew well above the peak of the mountain in daytime. The snow rapidly melted at Raven’s Nest during period 2, and the warm and dry conditions contributed to higher concentrations of XRF dust elements (Fig. 2g) and coarse-mode particles (Fig. 2h). Snow, however, remained at Whistler Peak, where concen-trations of dust were considerably lower (Fig. 2f), consis-tent with the observation of dust generated near Raven’s Nest from mountain bikes and occasional vehicles.
Period 3, covering 12–22 July, was significantly warmer than period 1, but cooler than period 2 (Fig. 2a). Concentra-tions of monoterpenes, isoprene, MVK/MACR, and organic aerosols were lower than during period 2 (Fig. 2b–e). How-ever, as the temperature slowly increased throughout this pe-riod, the VOC and organic aerosol concentrations also slowly increased to reach a maximum on 21–22 July. During period 3 the organic aerosol was again dominated by alkane and carboxylic acid groups, similar to period 1, and the nonacid carbonyl concentrations were lower than those observed dur-ing period 2 at the two sites. The alcohol group fraction at Raven’s Nest was significantly lower than during period 2, with the exception of 21–22 July, when the alcohol concen-tration reached 1.5 µg m−3. At Raven’s Nest, the elemental concentrations of dust tracers (Fig. 2g) were lower than dur-ing period 2. However, at Whistler Peak, where the ground was still snow covered, concentrations of dust (Fig. 2f) were rather similar to those observed during period 2. There were very clear diurnal variations in VOC concentrations during this period, particularly at Raven’s Nest (Fig. 2e). These vari-ations were partly a result of upslope flows from the warmer valley in daytime and downslope flows from the colder, higher altitudes at night (Macdonald et al., 2013). Apart from the very start of this period, when there was temporarily in-creased cloudiness, period 3 was dominated by clear skies or scattered cumulus with bases well above the Whistler Peak site. Back trajectories indicate a more pronounced westerly component in the advection compared to period 1 and 2. There might also have been some influence from Vancouver in the south.
Fig. 2.Time series of temperature (T) and relative humidity (RH)(a), FTIR organic functional groups at WHI(b)and WRN(c), PTR-MS VOCs at WHI(d)and WRN(e), XRF dust elements at WHI(f)and WRN(g), coarse particle number concentrations(h), and PMF factors at WHI(i)and WRN(j).
of monoterpene, isoprene, MVK/MACR (Fig. 2d–e), and other VOCs were again accompanied by increasing concen-trations of organic aerosols (Fig. 2b–e). During period 4, the organic aerosol again had significant contributions from al-cohol and nonacid carbonyl groups, similar to period 2.
Unlike period 2, period 4 had some significant influence of biomass burning, among other things indicated by ele-vated acetonitrile and BC concentrations, from regional fires to the north (Macdonald et al., 2013). Dust concentrations in-creased significantly at the Whistler Peak site during period 4 (Fig. 2f), probably as a result of most of the snow having melted at the peak and generally higher winds at WHI.
3.2 PMF analysis, sources of organic aerosols for each period at Raven’s Nest and the peak
Positive matrix factorization (PMF) (Paatero and Tapper, 1994) has been applied previously to FTIR spectra to
Raven’s Nest against (c) numbers of factors used, and (d) fpeak
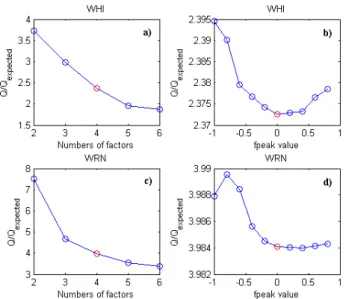
Fig. 3.Q/Qexpectedfor Whistler Peak against(a)numbers of
fac-tors used, and (b) fpeak values for 4 factors. Q/Qexpected for
Raven’s Nest against(c)numbers of factors used, and(d)fpeak val-ues for 4 factors. The red circles show the chosen factor solution.
to each other at Whistler Peak (r=0.31) and mildly corre-lated at Raven’s Nest (r=0.51) and also had very similar spectra, which differed only in the relative amount of alco-hol (organic hydroxyl) group absorbance (between 3000 and 3500 cm−1). Because these factors are also correlated to sim-ilar tracer compounds, the separation was not sufficiently ro-bust for either site, so we have combined them into a single factor.
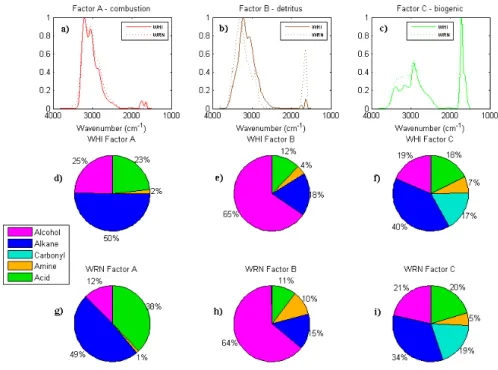
Figure 4 shows the factor solutions chosen for Whistler Peak and Raven’s Nest. Each factor at Raven’s Nest has a parallel factor at Whistler Peak with a rather similar spec-trum (Fig. 4a–c). Factor A (Fig. 4a) has the strong and char-acteristic ammonium absorbance with broad double peaks in the 2800–3400 cm−1 region that is observed for the anthro-pogenic combustion factors (Gilardoni et al., 2007; Hawkins et al., 2010; Takahama et al., 2011). A large fraction of fac-tor A is comprised of alkane groups, 50 % at Whistler Peak (Fig. 4d) and 49 % at Raven’s Nest (Fig. 4g); contributions from nonacid carbonyl and amine groups are low. Factor A was correlated to XRF sulfur with an r coefficient of 0.77 at Whistler Peak (Table 1a), and 0.47 at Raven’s Nest (Ta-ble 1b), which indicates that this factor is associated with fossil fuel combustion. Factor A was also correlated to NOx at Raven’s Nest (r=0.74) (Table 1b). At Whistler Peak the correlation to NOx is much weaker (Table 1a), suggesting that the combustion factor had a higher contribution from lo-cal combustion at Raven’s Nest than at Whistler Peak, and a higher contribution from long-range transport at Whistler Peak than at Raven’s Nest. Factor A is not correlated to any of the VOCs in Table 1, indicating low influence from bio-genic VOCs (and acetonitrile) both at Whistler Peak and at
Raven’s Nest. We will refer to factor A as a “combustion fac-tor”.
Factor B (Fig. 4b) is strongly dominated by alcohol groups, 65 % at Whistler Peak (Fig. 4e), and 64 % at Raven’s Nest (Fig. 4h). This factor has the lowest contribution from alkane groups of all the factors. The contribution from amine groups to factor B is slightly higher at Raven’s Nest (10 %) than at Whistler Peak (4 %), seen also in the absorbance at 3400 cm−1in Fig. 4b, but apart from that the factor spectra are similar at the two sites. At Raven’s Nest, factor B showed high correlation to XRF dust elements such as Fe, Al, Mg, and Mn (Table 1b). Factor B was likely associated with veg-etative detritus (e.g., Rogge et al., 1993; Hildemann et al., 1996), which may be coemitted with dust. The large fraction of alcohol groups in this factor is consistent with carbohy-drate elements in plant materials (Bianchi et al., 1993). Liu et al. (2012) applied PMF to FTIR submicron organic aerosol spectra sampled in Bakersfield, CA, and found that one factor rich in alcohol (71 %) was correlated to the dust elements Si, Al, and Ca. They associated that PMF factor with vegetative detritus that was resuspended with dust particles.
The hypothesis that factor B is associated with vegetative detritus is strengthened by the fact that factor B was cor-related to phosphorus at both Raven’s Nest (Table 1b) and Whistler Peak (Table 1a). Phosphorus is present in fluids cir-culating in plants and is an element associated with primary organic particles (Artaxo and Hansson, 1995; Artaxo et al., 1998). Factor B showed much lower correlation to the dust elements Fe, Al, Mg, and Mn at Whistler Peak (Table 1a) than at Raven’s Nest (Table 1b). This can be explained by the fact that there is little vegetation and generally little bio-genic material on the ground around the Whistler Peak site, compared to the areas around Raven’s Nest. Therefore, local emission of dust at Whistler Peak did not result in any coe-mission of vegetative detritus. Hence, most of the vegetative detritus associated with factor B was likely transported to the peak site from lower altitudes. Factor B will be referred to as a “detritus factor”.
Fig. 4.PMF factor spectra for factors A–C for WHI (solid lines) and WRN (dotted lines)(a–c). Contributions from the different organic functional groups to factors 1–4 at WHI(d–f)and WRN(g–i).
Table 1a.rcoefficients between the three PMF factors and tracers at Whistler Peak. All elements, gases, and parameters in the first column have been averaged over the same time intervals as the filters were sampled over (∼24 h), making up 31 points. The numbers within the brackets represent 90 % confidence intervals calculated using the effective data size estimated from the first-order autocorrelation of each parameter (Mudelsee et al., 2010, algorithm 7.1).
WHI Factor A Factor B Factor C
NOx 0.26 (−0.08, 0.55) −0.12 (−0.44, 0.23) 0.43 (0.18, 0.63) S 0.77 (0.59, 0.88) 0.22 (−0.08, 0.48) 0.07 (−0.34, 0.46) Fe 0.06 (−0.30, 0.40) 0.17 (−0.19, 0.45) 0.85 (0.60, 0.95) Al 0.05 (−0.31, 0.40) 0.17 (−0.15, 0.45) 0.83 (0.55, 0.94) Mg 0.13 (−0.23, 0.46) 0.18 (−0.13, 0.46) 0.75 (0.41, 0.90) Mn 0.04 (−0.32, 0.39) 0.12 (−0.19, 0.41) 0.82 (0.53, 0.94) P −0.08 (−0.34, 0.19) 0.81 (0.70, 0.89) −0.09 (−0.35, 0.18) Monoterpenes −0.46 (−0.69,−0.16) −0.09 (−0.37, 0.21) 0.39 (0.13, 0.60) Isoprenes −0.57 (−0.75, -0.30) −0.21 (−0.48, 0.08) 0.42 (0.16, 0.62) MVK/MACR −0.47 (−0.68,−0.19) −0.19 (−0.45, 0.10) 0.77 (0.64, 0.86) Acetone −0.11 (−0.42, 0.22) −0.19 (−0.46, 0.11) 0.98 (0.96, 0.99) Methanol −0.24 (−0.52, 0.09) −0.13 (−0.41, 0.17) 0.94 (0.90, 0.97) Formic acid −0.24 (−0.52, 0.09) −0.20 (−0.47, 0.10) 0.96 (0.94, 0.98) Acetic acid/glycoaldehyde −0.11 (−0.41, 0.22) −0.35 (−0.58,−0.07) 0.89 (0.82, 0.94) Acetonitrile −0.16 (−0.44, 0.14) −0.28 (−0.52, 0) 0.42 (0.18, 0.62) Temperature −0.34 (−0.60, 0) 0.09 (−0.24, 0.41) 0.73 (0.57, 0.84)
Guenther et al., 1993). The combined factor C will be re-ferred to as a “biogenic factor”. However, it cannot be ex-cluded that the biogenic factor had some potential influence from biomass burning during the last days of the campaign, when there were some high peaks in acetonitrile concen-tration and smoke associated with regional fires was visible (Macdonald et al., 2013).
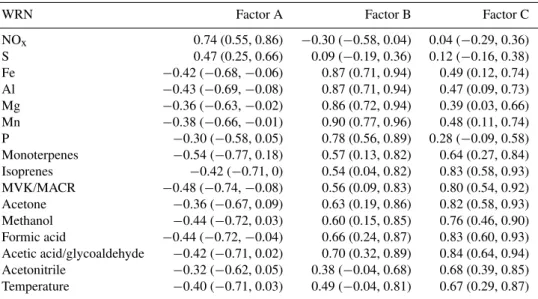
Table 1b.rcoefficients between the three PMF factors and tracers at Raven’s Nest. All elements, gases, and parameters in the first column have been averaged over the same time intervals as the filters were sampled over∼24 h, making up 36 points. The numbers within the brackets represent 90 % confidence intervals (see Table 1a).
WRN Factor A Factor B Factor C
NOx 0.74 (0.55, 0.86) −0.30 (−0.58, 0.04) 0.04 (−0.29, 0.36) S 0.47 (0.25, 0.66) 0.09 (−0.19, 0.36) 0.12 (−0.16, 0.38) Fe −0.42 (−0.68,−0.06) 0.87 (0.71, 0.94) 0.49 (0.12, 0.74) Al −0.43 (−0.69,−0.08) 0.87 (0.71, 0.94) 0.47 (0.09, 0.73) Mg −0.36 (−0.63,−0.02) 0.86 (0.72, 0.94) 0.39 (0.03, 0.66) Mn −0.38 (−0.66,−0.01) 0.90 (0.77, 0.96) 0.48 (0.11, 0.74) P −0.30 (−0.58, 0.05) 0.78 (0.56, 0.89) 0.28 (−0.09, 0.58) Monoterpenes −0.54 (−0.77, 0.18) 0.57 (0.13, 0.82) 0.64 (0.27, 0.84) Isoprenes −0.42 (−0.71, 0) 0.54 (0.04, 0.82) 0.83 (0.58, 0.93) MVK/MACR −0.48 (−0.74,−0.08) 0.56 (0.09, 0.83) 0.80 (0.54, 0.92) Acetone −0.36 (−0.67, 0.09) 0.63 (0.19, 0.86) 0.82 (0.58, 0.93) Methanol −0.44 (−0.72, 0.03) 0.60 (0.15, 0.85) 0.76 (0.46, 0.90) Formic acid −0.44 (−0.72,−0.04) 0.66 (0.24, 0.87) 0.83 (0.60, 0.93) Acetic acid/glycoaldehyde −0.42 (−0.71, 0.02) 0.70 (0.32, 0.89) 0.84 (0.64, 0.94) Acetonitrile −0.32 (−0.62, 0.05) 0.38 (−0.04, 0.68) 0.68 (0.39, 0.85) Temperature −0.40 (−0.71, 0.03) 0.49 (−0.04, 0.81) 0.67 (0.29, 0.87)
functional group composition of the detritus factor strongly differ from the compositions of factor C (Fig. 4).
The contribution from each of the three final factors during the campaign can be seen in the time series in Fig. 2i–j for Whistler Peak and Raven’s Nest, respectively. The sum of the PMF factors for each sample closely matches the sum of the organic functional groups seen in Fig. 2b–c for both sites. In general, the combustion factor concentration was higher at Raven’s Nest than at the Whistler Peak site. This might again indicate that a significant fraction of the anthropogenic impact on the organic aerosol at Raven’s Nest was from lo-cal sources, such as activities on the mountain or at Whistler Village in the valley.
Figure 5 shows the average contribution from each of the three PMF factors at the two sites during the whole cam-paign, and for the four subperiods discussed in Sect. 3.1. Over the range of the whole campaign, the biogenic factor dominated the submicron organic aerosol mass at both sites. During the cold and humid period 1, the combustion factor dominated at Raven’s Nest. At Whistler Peak, on the other hand, the combustion factor made up the same fraction as the biogenic factor (Fig. 5). However, both the combustion factor and the biogenic factor were considerably lower at Whistler Peak than at Raven’s Nest in concentration (Fig. 2i–j). The contribution from the detritus factor was low at Raven’s Nest during period 1. The higher fraction of detritus at Whistler Peak is probably irrelevant since most of the detritus during period 1 comes from one single filter (Fig. 2i) sampled on 21–24 June (since the FTIR time resolution was low in the beginning of the campaign at the peak site).
During the warm and dry period 2, the contribution from the biogenic factor increased at both sites (Fig. 5), in
partic-ular at the Whistler Peak site, where it strongly dominated (83 %). The detritus fraction at Raven’s Nest was consider-ably higher during period 2 as a result of the very dry con-ditions during this period. The detritus factor made a much lower contribution at Whistler Peak than at Raven’s Nest. Pe-riod 3 had higher influence from combustion than what was the case during period 2, but the biogenic factor still domi-nated at both sites. In period 4 the influence from combustion was lower than during period 3, and the dominance from the biogenic factor was large, likely then with some significant impact from biomass burning.
3.3 Single particle analysis using STXM-NEXAFS
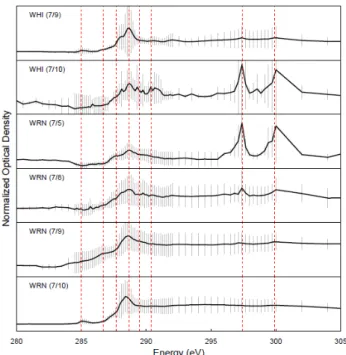
In total, 47 particles were analyzed using STXM-NEXAFS. Two samples were from the Whistler Peak site and four from Raven’s Nest (Table 2). All samples were collected in the daytime during the warm and dry period 2, when the influ-ence from biogenic sources was high and the influinflu-ence from combustion sources was at a minimum according to the PMF factor contributions in Fig. 5. Most of the sampled particles were in the size range of 1–5 µm diameter.
Fig. 5.Contributions from each PMF factor to the organic aerosol mass at WHI and WRN for the whole campaign, and for the four subperiods. The indicated concentration above each pie chart repre-sents the average organic concentration for the specific period and site.
Table 2.Description of STXM samples.
Site Date Sampling time No. of particles WHI 9 July 14:10–15:28 4
WHI 10 July 14:52–16:02 10 WRN 5 July 14:00–15:00 3 WRN 8 July 12:42–13:20 17 WRN 9 July 11:59–12:30 10 WRN 10 July 12:23–12:53 3
and ketonic groups made a lower contribution compared to other functional groups.
At Whistler Peak during summer 2009, Takahama et al. (2011) observed large contributions from ketonic car-bonyl, and alkene/aromatic groups indicating that the se-lected particles examined were tarballs observed in biomass burning episodes. However, during period 2 in this study, bio-genic sources dominated and the acetonitrile concentrations stayed low, indicating low influence from biomass burning. Many of the single particles at both sites in Whistler had sim-ilar spectral features to SOA generated inside a smog cham-ber fromα-pinene (with or without isoprene), but none of the single particles collected at Whistler were similar to the SOA formed from 1,2,4-trimethylbenzene, an SOA precur-sor emitted from combustion sources (Shakya et al., 2013). These results corroborate with the large biogenic source for period 2 (Fig. 5) obtained from the PMF analysis and the contrast from previous study during 2009.
Based on cluster analyses (Takahama et al., 2007) of single particles analyzed by STXM-NEXAFS, Schwartz et al. (2010) found that a majority of their spectra were of parti-cle types “secondary” and “other” at Whistler during summer 2008. The cluster analyses in this study also gave the result that most particles were of the type “SOA”, and more so at
Fig. 6.The black solid lines represent the average of spectra of the particles from a specific sample. Gray vertical lines represent the standard deviation. Red dotted lines show the locations of the func-tional groups: 285 eV for alkene, 286.7 eV for ketonic carbonyl, 287.7 eV for alkyl, 288.7 eV for carboxylic carbonyl, 289.5 eV for alcohol, 290.4 eV for carbonate, and 297.4 and 299.9 eV for K ab-sorptions.
Fig. 7.An example of a particle with strong absorption in the COOH region (288.7 eV). The left plot shows the representative absorbance image at 288.85 eV, and the right plot shows the average absorbance spectrum.
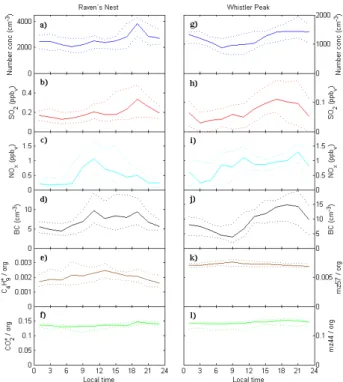
3.4 Links between particle number concentration, CCN and the PMF factors
In Sects. 3.1–3.2, the focus was on the organic mass and sources responsible for the organic mass. In this section the focus will also be on the origins of the particle and CCN number concentrations as well as their associations. In par-ticular, during period 3 (13–22 July), there were strong diur-nal variations in VOC concentrations (Fig. 2d–e) and aerosol concentrations (Fig. 2h). Figure 8 shows median diurnal cy-cles of concentrations of total particle number, SO2, NOx, and BC during period 3 at the two sites. In addition, me-dian diurnal cycles of the ratios of the nonoxygenated AMS ion fragment C4H+9 and the oxygenated ion fragment CO+2 to total organic aerosol concentration at Raven’s Nest can be seen in Fig. 8. The AMS mass spectral peakm/z57 contains the ion peaks C4H+
9 and C3H5O
+, andm/z44 contains the ion peaks CO+2 and C2H4O+
. Since the ion fragments of a certainm/z measured by the C-ToF-AMS used at Whistler Peak cannot be separated, we have instead included the me-dian diurnal cycles of the ratios of m/z 57 andm/z 44 to total organic aerosol concentration for the Whistler Peak site in Fig. 8. All times mentioned here represent local time with daylight saving included. Sunrise occurred around 05:00 in the morning.
At Raven’s Nest there was a very pronounced peak in NOx around 10:00 (Fig. 8c). This was likely a combined result of emissions from overnight and morning traffic in Whistler and the growing mixed layer reaching the altitude of Raven’s Nest. At the same time, the particle number (Fig. 8a) and BC (Fig. 8d) concentrations also exhibited small peaks. For the C4H+
9-ratio (Fig. 8e), there is a slight and broad increase during the daytime visible at least in the third quartile, with broad similarity to the BC pattern. The CO+2-ratio (Fig. 8f) stayed more constant during the day. Due to the morning correlation of particle number with NOxand BC at Raven’s Nest, the slight peak in particle number concentration around 10:00 was likely due to primary aerosol particles emitted from local sources. Corresponding morning peaks were less evident at the Whistler Peak site (Fig. 8g, i, j, and k), likely because the mixed layer in general reached the level of the mountain peak in the afternoon when the layer had been more diluted during growth.
In the evening, between 18:00 and 20:00, the particle num-ber concentration at Raven’s Nest (Fig. 8a) had a second more pronounced peak. That was about the same time as the particle number concentration peaked at Whistler Peak (Fig. 8g). The BC concentration at Raven’s Nest (Fig. 8d) also experienced a second maximum in the evening, similar to the particle number concentration. On this evening the BC peak was very pronounced at the Whistler Peak site as well (Fig. 8j). The fact that particle number and BC peaked at the same time in the evening at the two sites suggests that this peak was at least partly a result of anthropogenic sources. Also, SO2experienced a maximum in the evening (Fig. 8b
, and BC at Raven’s Nest (a to total organic concentration at Raven’s Nest (e
Fig. 8.Median diurnal cycles 13–22 July of total integrated SMPS particle number concentration, SO2, NOx, and BC at Raven’s Nest
(a–d), and Whistler Peak(g–j). The ratios of C4H+9 and CO+2 to total organic concentration at Raven’s Nest(e–f), and the ratios of m/z57 andm/z44 to total organic concentration at Whistler Peak
(k–l). Dotted lines represent 25 and 75 percentiles, respectively.
and h). The back trajectories in Fig. 1c suggest that the day-time increase in SO2 may partly be a result of westerly air transport from a sulfur smelter source that is located at the coast.
The average total particle number concentrations over the whole campaign were 2290 and 1210 cm−3at Raven’s Nest and Whistler Peak, respectively. Table 3 shows median par-ticle number concentrations for each of the four periods sep-arately at the two sites. During period 1 the median num-ber concentration at Raven’s Nest was almost a factor of three higher than the corresponding concentration at Whistler Peak. This relative difference between the two sites was larger during period 1 than during the other three periods, likely as a result of occasional decoupling between the some-times existing cloud layer at Whistler Peak with the boundary layer during period 1.
Table 3.Median concentrations of the integrated total particle number from the SMPS and BC from the SP2 during each period for the two sites.
Site Period 1 Period 2 Period 3 Period 4 Total number concentration (cm−3) WHI 690 1500 1210 1570
WRN 1980 2180 2540 2620 SP2 number concentration (cm−3) WHI 5.75 7.85 8.68 25.3
WRN 7.05 3.57 6.39 7.78
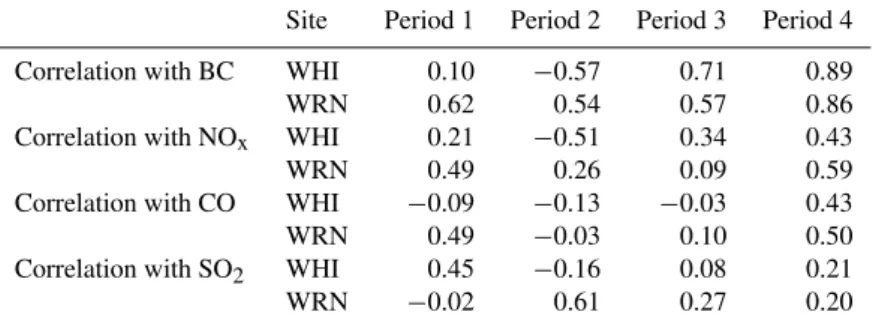
Table 4.Correlation coefficients between the integrated total particle number concentration from the SMPS with BC, NOx, and CO during
each period for the two sites. The correlations are calculated for 24 h averages of each parameter.
Site Period 1 Period 2 Period 3 Period 4 Correlation with BC WHI 0.10 −0.57 0.71 0.89 WRN 0.62 0.54 0.57 0.86 Correlation with NOx WHI 0.21 −0.51 0.34 0.43 WRN 0.49 0.26 0.09 0.59 Correlation with CO WHI −0.09 −0.13 −0.03 0.43 WRN 0.49 −0.03 0.10 0.50 Correlation with SO2 WHI 0.45 −0.16 0.08 0.21
WRN −0.02 0.61 0.27 0.20
particularly between 28 June and 5 July. However, the peaks in number concentration during the evenings on 24 June and 26 June (Fig. 9b) and growth from small sizes (Fig. 9a) could be results of nucleation events since NOx(Fig. 9b) andN100 (Fig. 9c) remained low during these two growth events. There is no correlation between particle number and SO2 during period 1 at Raven’s Nest (Table 4). However,r coefficients between total particle number and NOx, BC, and CO are in the range 0.49–0.62 for Raven’s Nest (Table 4) suggesting a significant contribution to the particle numbers from an-thropogenic sources during period 1. At Whistler Peak there are no such corresponding correlations, which again suggest that the Whistler Peak site was at times decoupled from the boundary layer during period 1.
Period 2 started with two very clear nucleation events on 5 July and 6 July (Fig. 9a), which have been described in detail by Pierce et al. (2012). Period 2 had the lowest NOx con-centration (Fig. 9b) and the lowest PMF combustion factor concentration (Fig. 9d) of all the periods. Ther coefficients between number concentration and NOx, BC, and CO, are in general low or negative at both Raven’s Nest and Whistler Peak during period 2 (Table 4), indicating low contribution from primary emissions. Hence, it appears that new particle formation largely dominated the particle number concentra-tion during period 2. Total particle number concentraconcentra-tions are moderately correlated to SO2(r=0.62) at Raven’s Nest dur-ing period 2, but there is no such correlation at Whistler Peak, which could indicate that nucleation preferably occurred at lower altitudes.
BC number concentrations were higher during period 3 than during period 2 (Table 3). Furthermore, ther
coeffi-cients between particle number and BC are also higher dur-ing period 3 than durdur-ing period 2 (Table 4). High peaks in both number concentration and NOxcan be seen around mid-night between 11 and 12 July (Fig. 9b), suggesting a plume of primary particles at that time. Ther coefficient between particle number and SO2is lower during period 3 than dur-ing period 2 at Raven’s Nest, suggestdur-ing that new particle formation from gas-phase oxidation of SO2contributed less during period 3 than during period 2.
Period 4 started with a very clear nucleation event in the afternoon of 22 July (Fig. 9a). There was a rapid increase in particle number and a simultaneous drop in NOx concen-tration during this event (Fig. 9b), and at the same time the number of accumulation mode particles remained low. De-spite this nucleation event, period 4 has the highest correla-tions between particle number and BC, CO, and NOx, all in the range 0.43–0.89 (Table 4), indicating significant contri-butions from anthropogenic sources and/or biomass burning to the aerosol particle population; the higher BC concentra-tions during period 4 (Table 3) suggest a biomass burning contribution. This hypothesis is supported by observed large peaks in acetonitrile during the same time period.
Time series at Raven’s Nest of (a) SMPS particle number size distribution (the color
Fig. 9.Time series at Raven’s Nest of (a)SMPS particle num-ber size distribution (the color indicates dN/dlog10Dp [cm−3]),
(b) SMPS total integrated particle number concentration (blue) and NOxconcentration (black), and(c)N100(blue) andN16−100
(red), and(d)the PMF combustion factor (red) and biogenic factor (green).
by ultrafine particles since fossil fuel combustion also emits particles that are larger than 100 nm (e.g., Kittelson, 1998).
Whereas N16−100 follows the combustion factor in Fig. 9c–d relatively well as discussed above, N100 follows the concentration of the PMF biogenic factor. The associatedr coefficient for correlation betweenN100and the biogenic fac-tor is 0.88 and 0.83 at Raven’s Nest and Whistler Peak, re-spectively. There are no such clear correlations betweenN100 and the combustion factor (r= −0.01 andr= −0.15) or the detritus factor (r=0.56 andr= −0.05) at the two sites, re-spectively. Since the biogenic factor was largely dominated by biogenic SOA throughout most of the campaign, except possibly during the last days of period 4 (Sect. 3.2), the high correlation between the biogenic factor and N100 suggests that the concentration of particles larger than 100 nm was controlled to a large extent by particle condensational growth from biogenic vapors. Hence, although combustion sources contributed toN16−100,N100depended critically on biogenic SOA in this study.
Many studies (e.g., Kapustin et al., 2006; Clarke and Ka-pustin, 2010) suggest the number concentration of particles withDp>100 nm as a surrogate for the CCN concentration. Here we consider the scope of that assumption for a bio-genic event. The correlation between the CCN concentration and the biogenic factor in general increased with increasing supersaturation (Table 5). ForS=0.2 ther coefficient was 0.69, and for higher supersaturations the correlation was even stronger. Thus, the CCN number concentration was strongly related to the biogenic factor.
Temperature may influence the concentration of particles larger than 100 nm by increasing the emission of BVOCs. Figure 10a and b show the concentrations of particles larger
Table 5.Correlation coefficients between 24 h averages of the bio-genic PMF factor and CCN number concentration at Raven’s Nest for different supersaturations (S). The numbers within the brackets represent 90 % confidence intervals.
rcoefficient S=0.1 0.35 (0.04, 0.60) S=0.2 0.69 (0.42, 0.85) S=0.3 0.78 (0.57, 0.89) S=0.5 0.76 (0.56, 0.88)
than 100 nm as functions of local temperature at the two sites for the entire study. N100 is strongly correlated to ambient temperature at both sites, which indicates that temperature was an important factor for N100 at both sites. Figure 10c and d show the corresponding relations for numbers of CCN for S=0.2 % (Fig. 10c) and for S=0.3 % (Fig. 10d) at Raven’s Nest. The correlation coefficient was similar for S=0.5 % (r=0.63). For S=0.1 % there was no correla-tion (r=0.06) between the number of CCN and tempera-ture. The relations and correlations in Fig. 10 are calculated from 24 h averages of temperature and CCN and particle con-centrations, in order to minimize the impact of anabatic and katabatic flows on the correlations. If the correlations instead would have been calculated over a shorter time interval, e.g., one hour, part of the correlation could be a result of anabatic flows bringing warm air with high CCN concentration from the valley in daytime up to the mountain sites, and the oppo-site occurring at nighttime.
Raven’s Nest CCN at Raven’s Nest at a supersaturation
>100nm at Raven’s Nest (e)
Fig. 10.Temperature dependency for numbers of particles withDp>100 nm at Raven’s Nest(a)and Whistler Peak(b)for numbers of CCN
at Raven’s Nest at a supersaturation of 0.2 %(c)and 0.3 %(d), and the relation between concentrations of CCN at a supersaturation of 0.2 % and particles withDp>100 nm at Raven’s Nest(e). Each point represents a 24 h average. The red curves represent linear fits according to
the given equation in each plot.
4 Summary and conclusions
PMF has been applied to FTIR spectra in order to investigate and quantify sources of submicron organic aerosols at Whistler Peak (2182 m a.s.l.) and Raven’s Nest (1300 m a.s.l.) during the WACS 2010 campaign at Whistler Mountain, British Columbia. Here the key results and main conclusions are presented:
– The factors that could be identified at the two sites are (1) a combustion factor, (2) a biogenic factor, and (3) a vegetative detritus factor.
– The combustion factor dominated the organic aerosol mass at both sites during the early part of the campaign, which was characterized by low temperatures and ad-vection from the Vancouver area. However, as the tem-perature started to rise in early July, the biogenic factor increased as a result of increased emissions of BVOCs, and came to be the largest factor throughout the rest of the campaign.
– The largest difference between the two sites in terms of organic aerosol composition was the much higher con-centration of alcohol functional groups at Raven’s Nest than at Whistler Peak during the dry mid-part of the campaign. These alcohol groups were likely associated with local emissions of vegetative detritus. The lower fraction of detritus at Whistler Peak was a result of a snow-covered surface at the peak of the mountain, and also little vegetation up there.
– On average over the whole campaign, the biogenic fac-tor represented 69 % and 49 %, the combustion facfac-tor represented 14 % and 23 %, and the detritus factor rep-resented 17 % and 27 % at Whistler Peak and Raven’s Nest, respectively. The larger fraction of combustion at Raven’s Nest compared to Whistler Peak was likely a result of some local pollution from Whistler Village in the valley.
The biogenic factor was correlated to temperature and to several VOCs. The number concentration of particles with Dp>100 nm was strongly correlated to the biogenic factor (and to temperature), whereas the number concentration of particles smaller than 100 nm was better correlated to the combustion factor. CCN measurements from Raven’s Nest showed that the CCN concentration was correlated to tem-perature and to the biogenic factor for supersaturations equal to or larger than 0.2 %. This is an indication that temperature and biogenic SOA formation exerted a large control on the CCN population for supersaturations equal to or larger than 0.2 % during this study.
Acknowledgements. Environment Canada funded the Whistler
Aerosol and Cloud Study 2010 through the Clean Air Regulatory Agenda (CARA). Funding was provided through Environment Canada’s Grants and Contribution program. Cooperation and support from Whistler-Blackcomb and Juniper Buller is gratefully acknowledged. We would also like to thank D. J. Cziczo for providing CCN data.
References
Artaxo, P. and Hansson H. -C.: Size distribution of biogenic aerosol particles from the Amazon Basin, Atmos. Environ., 29, 393–402, 1995.
Artaxo, P., Fernandes, E. T., Martins, J. V., Yamasoe, M. A., Hobbs, P. V., Maenhaut, W., Longo, K. M., and Castanho, A.: Large-scale aerosol source apportionment in Amazonia, J. Geophys., Res., 103, 31837–31847, 1998.
Bianchi, G., Gamba, A., Limiroli, R., Pozzi, N., Elster, R., Salamini, F., and Bartels, D.: The unusual sugar composition in leaves of the resurrection plant myrothamnus-flabellifolia, Physiologia Plantarum, 87, 223–226, 1993.
Clarke, A. and Kapustin, V.: Hemispheric aerosol vertical profiles: Anthropogenic impacts on optical depth and cloud nuclei, Sci-ence, 329, 1488–1492, 2010.
DeCarlo, P. F., Kimmel, J. R., Trimborn, A., Northway, M. J., Jayne, J. T., Aiken, A. C., Gonin, M., Fuhrer, K., Horvath, T., Docherty, K. S., Worsnop, D. R., and Jimenez, J. L.: Field-Deployable, High-Resolution, Time-of-flight Aerosol Mass Spectrometer, Anal. Chem., 78, 8281–8289, 2006.
Drewnick, F., Hings, S. S., DeCarlo, P., Jayne, J. T., Gonin, M., Fuhrer, K., Weimer, S., Jimenez, J. L., Demerjian, K. L., Bor-rmann, S., and Worsnop, D. R.: A New Time-of-Flight Aerosol Mass Spectrometer (ToF-AMS)-Instrument Description and First Field Deployment, Aerosol Sci. Tecnol., 39, 637–658, 2005. Frossard, A. A., Shaw, P. M., Russell, L. M., Kroll, J. H.,
Cana-gratna, M. R., Worsnop, D. R., Quinn, P. K., and Bates, T. S.: Springtime Arctic haze contributions of submicron organic par-ticles from European and Asian combustion sources, J. Geophys. Res., 116, D05205, doi:10.1029/2010JD015178, 2011.
Gilardoni, S., Russell, L. M., Sorooshian, A., Flagan, R. C., Se-infeld, J. H., Bates, T. S., Quinn, P. K., Allan, J. D., Williams, B., Goldstein, A. H., Onasch, T. B., and Worsnop, D. R.: Re-gional variations of organic functional groups in aerosol par-ticles on four U.S. east coast platforms during the Interna-tional Consortium for Atmospheric Research on Transport and Transformation 2004 campaign, J. Geophys. Res., 112, D10S27, doi:10.1029/2006JD007737, 2007.
Goldstein, A. H. and Galbally, I. E.: Known and unexplored organic constituents in the earth’s atmosphere, Environ. Sci. Technol., 41, 1514–1521, 2007.
Guenther, A., Zimmerman, P. R., Harley, P. C., Russell, K. M., and Fall, R.: Isoprene and monoterpene emission rate variability: Model evaluations and sensitivity analyses, J. Geophys. Res., 98, 12609–12617, doi:10.1029/93JD00527, 1993.
Hallquist, M., Wenger, J. C., Baltensperger, U., Rudich, Y., Simp-son, D., Claeys, M., Dommen, J., Donahue, N. M., George, C., Goldstein, A. H., Hamilton, J. F., Herrmann, H., Hoff-mann, T., Iinuma, Y., Jang, M., Jenkin, M. E., Jimenez, J. L., Kiendler-Scharr, A., Maenhaut, W., McFiggans, G., Mentel, Th. F., Monod, A., Pr´evˆot, A. S. H., Seinfeld, J. H., Surratt, J. D., Szmigielski, R., and Wildt, J.: The formation, properties and im-pact of secondary organic aerosol: current and emerging issues, Atmos. Chem. Phys., 9, 5155–5236, doi:10.5194/acp-9-5155-2009, 2009.
Hawkins, L. N. and Russell, L. M.: Oxidation of ketone groups in transported biomass burning aerosol from the 2008 North-ern California Lightning Series fires, Atmos. Environ., 44, 4142– 4154, 2010.
Hawkins, L. N., Russell, L. M., Covert, D. S., Quinn, P. K., and Bates, T. S.: Carboxylic acids, and sulfates, and organosulfates in processed continental organic aerosol over the southeast Pa-cific Ocean during VOCALS-Rex 2008, J. Geophys. Res., 115, D13201, doi:10.1029/2009JD013276, 2010.
Hildemann, L. M., Rogge, W. F., Cass, G. R., Mazurek, M. A., and Simoneit, B. R. T.: Contribution of primary aerosol emis-sions from vegetation-derived sources to fine particle concen-trations in Los Angeles, J. Geophys. Res., 101, 19541–19549, doi:10.1029/95JD02136, 1996.
Hitchcock, A.: aXis 2000, available at: http://unicorn.mcmaster.ca/ aXis2000.html, last access: March 2013.
Jimenez, J. L., Canagaratna, M. R., Donahue, N. M., Prevot, A. S. H., Zhang, Q., Kroll, J. H., DeCarlo, P. F., Allan, J. D., Coe, H., Ng, N. L., Aiken, A. C., Docherty, K. S., Ulbrich, I. M., Grieshop, A. P., Robinson, A. L., Duplissy, J., Smith, J. D., Wil-son, K. R., Lanz, V. A., Hueglin, C., Sun. Y. L., Tian, J., Laak-sonen, A., Raatikainen, T., Rautiainen, J., Vaattovaara, P., Ehn, M., Kulmala, M., Tomlinson, J. M., Collins, D. R., Cubison, M. J., Dunlea, E. J., Huffman, J. A., Onasch, T. B., Alfarra, M. R., Williams, P. I., Bower, K., Kondo, Y., Schneider, J., Drewnick, F., Borrmann, S., Weimer, S., Demerjian, K., Salcedo, D., Cot-trell, L., Griffin, R., Takami, A., Miyoshi, T., Hatakeyama, S., Shimono, A., Sun, J. Y., Zhang, Y. M., Dzepina, K., Kimmel, J. R., Sueper, D., Jayne, J. T., Herndon, S. C., Trimiborn. A. M., Williams, L. R., Wood, E. C., Middlebrook, A. M., Kolb, C. E., Baltensperger, U., and Wornsop, D. R. : Evolution of Organic Aerosols in the Atmosphere, Science, 326, 1525–1529, 2009. Kapustin, V. N., Clarke, A. D., Schinozuka, Y., Howell, S.,
Brekhovskikh, V., Nakajima, T., and Higurashi, A.: On the determination of a cloud condensation nuclei from satellite: Challenges and possibilities, J. Geophys. Res., 111, D04202, doi:10.1029/2004JD005527, 2006.
Kilcoyne, A. L. D., Tyliszczak, T., Steele, W. F., Fakra, S., Hitch-cock, P., Franck, K., Anderson, E., Harteneck, B., Rightor, E. G., Mitchell, G. E., Hitchcock, A. P., Yang, L., Warwick, T., and Ade, H.: Interferometer controlled scanning transmission X-ray microscopes at the advanced light source, J. Synchroton Rad. 10, 125–136, 2003.
Kittelson, D. B.: Engines and nanoparticles: A review, J. Aerosol Sci., 29, 575–588, 1998.
Leaitch, W. R., Macdonald, A. M., Brickell, P. C., Liggio, J., Sjost-edt, S. J., Vlasenko, A., Bottenheim, J. W., Huang, L., Li, S.-M., Liu, P. S. K., Toom-Sauntry, D., Hayden, K. A., Sharma, S., Schantz, N. C., Wiebe, H. A., Zhang, W., Abbatt, J. P. D., Slowik, J. G., Chang, R. Y.-W., Russell, L. M., Schwartz, R. E., Takahama, S., Jayne, J. T., and Ng, N. L.: Temperature response of the submicron organic aerosol from temperate forests, Atmos. Environ., 45, 6696–6704, 2011.
Liu, S., Day, D. A., Shields, J. E., and Russell, L. M.: Ozone-driven daytime formation of secondary organic aerosol containing car-boxylic acid groups and alkane groups, Atmos. Chem. Phys., 11, 8321–8341, doi:10.5194/acp-11-8321-2011, 2011.
doi:10.1029/2012JD018170, 2012.
Macdonald, A. M., Leaitch, W. R., Abbat, J. P. D., Ahlm L., Al-Basheer, W., Betram, A. K., Buller, J., Campuzano-Jost, P., Chan, E., Corbin, J., Cziczo, D. J., Elford, A., Hayden, K. L., Herckes, P., Lee, A. K. Y., Li, S. –M., Liggio, J., Liu, P. S. K., Mihele, C., Noone, K. J., Pierce, J. R., Russell, L. M., Toom-Sauntry, D., Schroder, J., Sharma, S., Sheppard, A., Sjostedt, S. J., Slowik, J. G., Strawbridge, K., Stupple, G., Vlasenko, A., Wainwright, C. D., Wang, Y., Wentzell, J., Allan Wiebe, H., and Wong, J. P. S.: Overview of WACS 2010: Biogenic Aerosol Formation, Moun-tain Flows and CCN, Atmos. Chem. Phys. Discuss., in prepara-tion, 2013.
Maria, S. F., Russell, L. M., Turpin, B. J., Porcja, R. J., Cam-pos, T. L., Weber, R. J., and Huebert, B. J.: Source signatures of carbon monoxide and organic functional groups in Asian Pacific Regional Aerosol Characterization Experiment (ACE-Asia) submicron aerosol types, J. Geophys. Res., 108, 8637, doi:10.1029/2003JD003703, 2003.
Mudelsee, M.: Climate Time Series Analysis, vol. 42 of Atmo-spheric and Oceanographic Sciences Library, Springer, Heidel-berg, 2010.
Paatero, P. and Tapper, U.: Positive Matrix Factorization: A non-negative factor model with optimal utilization of er-ror estimates of data values, Environmetrics, 5, 111–126, doi:10.1002/env.3170050203, 1994.
Pierce, J. R., Leaitch, W. R., Liggio, J., Westervelt, D. M., Wain-wright, C. D., Abbatt, J. P. D., Ahlm, L., Al-Basheer, W., Cz-iczo, D. J., Hayden, K. L., Lee, A. K. Y., Li, S.-M., Rus-sell, L. M., Sjostedt, S. J., Strawbridge, K. B., Travis, M., Vlasenko, A., Wentzell, J. J. B., Wiebe, H. A., Wong, J. P. S., and Macdonald, A. M.: Nucleation and condensational growth to CCN sizes during a sustained pristine biogenic SOA event in a forested mountain valley, Atmos. Chem. Phys., 12, 3147–3163, doi:10.5194/acp-12-3147-2012, 2012.
Roberts, G. C., Nenes, A., Seinfeld, J. H., and Andreae, M. O.: Impact of biomass burning on cloud properties in the Amazon Basin, J. Geophys. Res., 108, 4062, doi:10.1029/2001JD000985, 2003.
Rogge, W. F., Hildemann, L. M., Mazurek, M. A., Cass, G. R., and Simoneit, B. R. T.: Sources of fine organic aerosol. 4. Particulate abrasion products from leaf surfaces of urban plants, Environ. Sci. Technol., 27, 2700–2711, 1993.
Russell, L. M., Takahama, S., Liu, S., Hawkins, L. N., Covert, D. S., Quinn, P. K., and Bates, T. S.: Oxygenated fraction and mass of organic aerosol from direct emission and atmo-spheric processing measured on the R/V Ronald Brown dur-ing TEXAQS/GoMACCS 2006, J. Geophys. Res., 114, D00F05, doi:10.1029/2008JD011275, 2009.
Schwartz, R. E., Russell, L. M., Sjostedt, S. J., Vlasenko, A., Slowik, J. G., Abbatt, J. P. D., Macdonald, A. M., Li, S. M., Lig-gio, J., Toom-Sauntry, D., and Leaitch, W. R.: Biogenic oxidized organic functional groups in aerosol particles from a mountain forest site and their similarities to laboratory chamber products, Atmos. Chem. Phys., 10, 5075–5088, doi:10.5194/acp-10-5075-2010, 2010.
Shakya, K. M., Liu, S., Takahama, S., Russell, L. M., Keutsch, F. N., Galloway, M. M., Shilling, J.E., Hiranuma, N., Song, C., Kim, H., Paulson, S.E., Pfaffenberger, L., Barmet, P., Slowik, J., Pre-vot, A. S. H., Dommen, J., and Baltensperger, U.: Similarities in STXM-NEXAFS spectra of atmospheric particles and secondary organic aerosol generated from glyoxal, α-pinene, isoprene, 1,2,4-trimethylbenzene, and d-limonene, Aerosol Sci. Technol., 47, 543–555, doi:10.1080/02786826.2013.772950, 2013. Takahama, S., Gilardoni, S., Russell, L. M., and Kilcoyne, A. L.
D.: Classification of multiple types of organic carbon compo-sition in atmospheric particles by scanning transmission X-ray microscopy analysis, Atmos. Environ., 41, 9435–9451, 2007. Takahama, S., Liu, S., and Russell, L. M.: Coatings and
clus-ters of carboxylic acids in carbon-containing atmospheric par-ticles from spectromicroscopy and their implications for cloud-nucleating and optical properties, J. Geophys. Res., 115, D01202, doi:10.1029/2009JD012622, 2010.
Takahama, S., Schwartz, R. E., Russell, L. M., MacDonald, A. M., Sharma, S., and Leaitch, W. R.: Organic functional groups in aerosol particles from burning and non-burning forest emissions at a high-elevation mountain site, 11, 6367–6386, 2011. Tsigaridis, K. and Kanakidou, M.: Secondary organic aerosol
im-portance in the future atmosphere, Atmos. Environ., 41, 4682– 4692, 2007.
Ulbrich, I. M., Canagaratna, M. R., Zhang, Q., Worsnop, D. R., and Jimenez, J. L.: Interpretation of organic components from Posi-tive Matrix Factorization of aerosol mass spectrometric data, At-mos. Chem. Phys., 9, 2891–2918, doi:10.5194/acp-9-2891-2009, 2009.
![Fig. 9. Time series at Raven’s Nest of (a) SMPS particle num- num-ber size distribution (the color indicates dN/dlog 10 D p [cm −3 ]), (b) SMPS total integrated particle number concentration (blue) and NO x concentration (black), and (c) N 100 (blue) and N](https://thumb-eu.123doks.com/thumbv2/123dok_br/18369143.355087/12.892.80.424.98.350/particle-distribution-indicates-integrated-particle-number-concentration-concentration.webp)