Modelling of Non-Linear Pilot Disinfection Water System: A Bond Graph
Approach
Naoufel ZITOUNI 1*, Ridha ANDOULSI 2*, Anis SELAMI 2, Abdelkader MAMI 3, and
Hssen ABDENNASSEUR 4
1
Laboratory of Photovoltaic and the Semiconductors in CRTEn, BP95 Hammam lif 2050, Tunisia
2
Research Unit: Networks and Machines Electric in INSAT, Tunisia
3
Laboratory of automatic and control systems, Tunisia
4
Laboratory of Water and the Environment in CRTE, Tunisia
E-mails (*): [email protected], [email protected]; *Corresponding authors
Abstract
The ultraviolet (UV) irradiations are used to solve the bacteriological problem
of the drinking water quality. A discharge-gas lamp is used to produce this
type of irradiation. The UV lamp is fed by photovoltaic (PV) energy via
electronic ballast composed by an inverter, a transformer and resonant circuit
(RLC). The aim of this work is to give a useful global model of the system. In
particular, we introduce the complicated UV lamp model and the water
disinfection kinetics, where the radiant energy flux emitted by the
discharge-gas lamp and the arc voltage are a complex functions of the current and time.
This system is intended to be mainly used in rural zones, the photovoltaic
modules as source of energy is an adequate solution. To optimise the power
transfer from the PV array to ballast and UV lamp, a Maximum Power Point
Tracking (MPPT) device may be located between PV array and the loads. In
this paper, we developed a bond-graph model which gives the water quality
from UV flow, gas type, pressure, lamp current and geometrical characteristic.
Finally reliable simulations are established and compared with experimental
Photovoltaic; MPPT; Ballast; A discharge-gas lamp; Disinfection water.
Introduction
The reuse of wastewater after adequate treatment constitutes a potential water resource
which could be of great interest to several sectors, especially in countries suffering from a
deficiency in water resource. Ultraviolet light has been shown to be very effective for the
disinfection of drinking water and wastewater. The vast majority of existing UV disinfection
systems employs low-pressure mercury arc lamps as their source of radiation. These lamps,
which emit roughly 85% of their output power at a wavelength of 253.7 nm, have been shown
to be highly effective for inducing photo biochemical changes in nucleic acids and proteins,
without inducing significant photochemical changes in other constituents in treated water [1].
The UV lamp is fed by electronic ballast composed by an inverter, a transformer and resonant
circuit (RLC). The irradiation of water by a lethal dose allowed the accumulation of DNA
photoproducts and the blockage of vital mechanisms of prosperity and viability of micro
organisms such as DNA replication and RNA transcription, which ultimately result in
reproductive of micro organisms’ inactivation.
Known that the determination of UV dose (the UV light dose is defined as UV
intensity multiplied by time: duration of exposition water to UV irradiations) is one of
interesting parameters allowing the accomplishment of optimal water disinfection [1-3]. A
better control of a water quality can be achieved by developing a robust mathematical model.
However modelling the disinfection kinetics is a difficult task due to the complexity of the
treatment process. The complex physical, biological and chemical processes involved in
wastewater treatment process exhibit non linear behaviours which are difficult to describe.
The UV lamp presents also a complicated model, indeed the radiant energy flux emitted by
the discharge-gas lamp and the arc voltage are a complex functions of the current and time
[4,5]. In fact, they depend on the lamp geometrical characteristics, gas type and pressure. We
carried out a thorough study in order to found useful ballast, UV lump model and the water
disinfection kinetics. Where [2] develops G-model of a discharge lamp, [4] use resistive
approximation with three deviation from the linear model. In [5] the cubic approximation
model and [6] develop a model with tangential approximation.
In this work we develop a mathematical model of the water treatment phenomenon
deduces water quality (N/N0) starting from UV flow and the various electric and mechanics
quantities (dimension of engine UV).
Material and Method
The Schematic model and photo of the UV water disinfection system is shown in the
figure 1.
Figure 1. Schematic model and photo of the UV water disinfection system
The UV water disinfection system fed by a photovoltaic generator, object of our study,
it consists of two tanks. A DC motor- pump ensures the circulation of water between the two
tanks through UV engine. This latter, consists of a quartz sheath and a gas-discharge lamp
low pressure. This type of lamp produce an irradiation wavelength of 265 nm induce a
chemical reaction on the ARN and the AND of the micro-organism involving their
deactivation.
Bond Graph Modelling of the UV Water Disinfection System
Modelling of water disinfection kinetics - The UV lamp model
All electric discharge lamps convert electrical energy into the light by transforming
electrical energy into the kinetic energy of moving electrons, which in turn is converted into
electromagnetic radiation as a result of some kind of collision process with atoms of gas
(vapours) or their mixture.
UV lamp
PV panel
DC AC
Solar radiation
water to be treated
treated water
Some moving electrons make such energetic impacts on atoms that the atoms internal
state changes (inelastic collisions). These changes can be of two types: excitations or
ionization.
Many models are based on the current-voltage characteristics of the discharge at high
frequencies (> 20 Khz). They try to find some function that describe relation between voltage,
current and power.
÷ Model with tangential approximation [6]:
⎟ ⎟ ⎠ ⎞ ⎜ ⎜ ⎝ ⎛ = ) P ( B i g tan ). Plamp ( A ) p , i ( u lamp p lamp p lamp lamp
lamp (1)
where Ap(Plamp) and Bp(Plamp) are power functions that represent the steady state lamp
behaviour. They are defined as polynomial functions where coefficients are determined from
experimental data.
÷ Model use cubic approximation [7]:
3 lamp lamp
lamp Ai Bi
u = + (2)
where A, B are constants.
÷ Model use resistive approximation with three deviation from the linear model [10] (the
dependence of the voltage-current characteristic on the lamp’s power level, the non
linearity of the voltage-current curve at given operating condition and the time domain
response of the lamp to a change in excitation). For a small power range is proposed
equivalent resistance: s rms s eq R I U
R = − (3)
where Us and Rs are lamp’s constant obtained from experimental data and Im is the current
through the lamp.
÷ G- model of a discharge lamp [2, 3, 8]:
They describe a discharge conductance by a differential equation of the first order:
∑
= − = n 1 k k k 2 G b i a dt dG (4)where coefficients a, bk can be determined experimentally from the voltage-current
characteristics or from physical evaluation is possible when n is 2 or 3. In this case have
coefficients physical meaning.
GU R U
i= = (5)
where i is current through discharge, U is discharge voltage, R is resistivity and G is the
electric conductivity of the discharge.
The polynomial model can be used with n=2 with good results. The constants a, b1,
and b2 would have physical meaning in this case. The model developed by [3,7] has the
following form:
) t ( g b ) t ( g b ai dt
dg 2
2 1
2+ +
= (6)
The lamp voltage and the lamp conductance are obtained when the differential
equation corresponding to the model is solved. The input current provided by the electronic
ballast i(t), is known.
There are several alternatives of UV lamp modelling, we retain the G-model. It can be
seen that the polynomial model also fits slightly better than the exponential model at high
frequency [9].
Starting of the Lamp
A gas-discharge lamp needs a sufficient voltage for starting. This lamp uses ballast able to
create a high frequency voltage and an increase in the voltage value for a short time on the UV
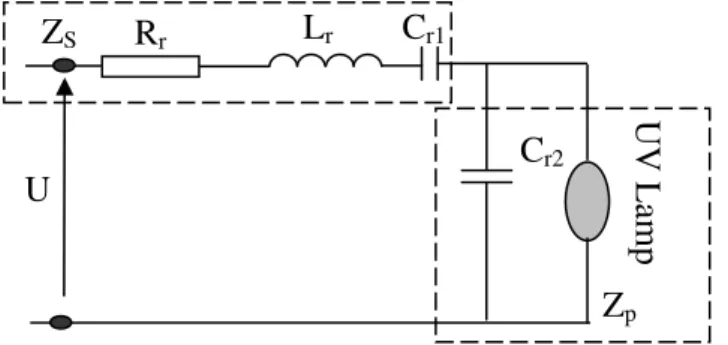
lamp. This over voltage is obtained by a resonant circuit (RLC). The voltage delivered by
converter DC/AC, feed a transformer towards a resonant system formed by a resistance Rr in
series with an inductance Lr and two capacity Cr1 and Cr2 (Figure 2 ). The receiver is a
gas-discharge lamp (UV) which is compared to infinite impedance before starting and low value
impedance after starting.
Figure 2. Electric schema of UV lamp coupled to the ballast
UV Lamp
Cr2
Cr1
Lr
Rr
ZS
Zp
Modelling of Water Disinfection Kinetics
The absorption of UV radiations is directly related to the molecule structure and
particularly to the organic groupings operating. The law describing this phenomenon is given
by Beer Lambert expression [1]:
Kd e 1 E E
Kd
0
− −
= (7)
where: E = lamp intensity (μw/cm2); E0 = Initial intensity (μw/cm2); d = Thickness of the
fluid or optical way (cm); K = Absorption coefficient (cm-1) which is often given or
identified.
The light bactericidal effectiveness is related to the exposure amount. The UV dose
radiation (D) in a point r of engine, is the product of the radiation intensity (illumination) in
this point (Er) and the contact time in the engine (tc):
Dr = Er tc (8)
with: Dr =UV dose at the point r (mW·s·cm-2); Er = Intensity UV at the point r (mW·s·cm-2); tc
= contact time in second.
The Specific energy necessary to the total or partial destruction of the
micro-organisms is function of the physical-chemical composition of treated water and the germs
sensitivity. A modelling study has been carried out under conditions well controlled on a
laboratory photo engine and stocks of Pseudomonas aeruginosa. This study shows that the
inactivation kinetics of these bacteria corresponds well to the modified model of Chick
Watson [1]:
c
1Et
K
0 Ae N
N = −
(9)
with: N = number of micro-organisms; N0 = initial number of micro-organisms; K1 =
coefficient translating the potent capacity disinfecting which depends on the type on
micro-organisms; A = initial abatement of the germ number.
The parameters A and K1 are given from experiments.
The radiant energy flux, emitted by a discharge-gas lamp, depends on the geometrical
characteristics of the lamp, the gas type, the pressure, temperature. This dependence makes
difficult the development of the general model characterizing the variation of emitted flux or
the arc voltage according to the arc current and time. The relations obtained in this field are
In literature, it is shown that between 50 % and 60 % of the power consumed by an
UV discharge-gas lamp low pressure is transformed into UV ray [1, 2]:
F0 = βP (10)
where F0 = the luminous flow emitted by the lamp; P = power consumed by the lamp.
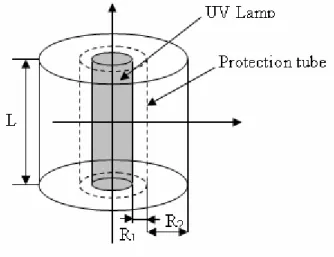
Influence of the Flow Rate and Illumination on the Water Disinfection
The illumination measured very close to the lamp surface corresponds to the greatest
value in the reactor. In a mono lamp reactor, the lamp protected by a quartz tube is placed in
the axis of engine. The general diagram of water disinfection engine is given by the Figure 2.
Figure 2. Schema of the UV reactor
In this study we consider that all the fluids molecules cross the following reactor with
parallel trajectories and at the same speed. In this laminar flow there is neither mixture nor
dispersion, all the particles have even time of residence equal to the average residence
hydraulic time. The average amount deposited in the reactor is defined as being the
relationship between the total energy deposited in the engine volume per second and the
volume of fluid which crosses the entire reactor per second. The illumination varies according
to the equation (11):
rL
π
2 F R
R R k 1
E 0
2 2 1
r ⎟⎟
⎠ ⎞ ⎜⎜
⎝
⎛ − +
= (11)
The speed in any point of the engine vr is equal to the speed in the centre of the reactor
v0 (vr = v0), under these conditions the fraction of the flow subjected to illumination is
modelled by equation (12):
rdr π 2 ) R R ( π 1 Q 2 1 2 2 r − = (12)
Therefore the average value of the balanced illumination of the luminous flows is
written in the following form:
∫
− − = 2 1 R R 0 2 2 1 2 2 _ rdr π 2 rL π 2 F ) R r k 1 ( ) R R ( π 1E (13)
According to the equation above, we can connect the ratio of water disinfection
according to the flow rate Q, luminous flow F0 and consequently the operating ballast
frequency. This relation permits also to improve the results of water disinfection either on the
flow rate or on luminous flow according to a data base. This relation can be summarized in
the equation system (14):
⎪ ⎪ ⎩ ⎪⎪ ⎨ ⎧ − + = = − ) R 2 1 R R 1 ( L π UI β E Ae N N 2 1 2 _ ) Q / L ( E K 0 _ 1 (14)
Results and discussion
Bond Graph Modelling of the UV Water Disinfection Reactor
The ultraviolet irradiation presents a particular solution for the disinfection of water. A
gas-discharge lamp necessities a sufficient tension for starting. This lamp uses ballast able to
create a high frequency tension and an increase in the voltage value for a short time on the
UV lamp. The power supply of the lamp (ballast) is an inverter followed by a transformer that
transforms the tension 24V provided by the battery into high frequency sinusoidal tension.
This one feeds a serial RLC resonant circuit to increase the voltage of the UV lamp. Before
the starting up of the discharge-gas lamp, the lamp has infinite impedance. After the starting
up, this impedance becomes low [10,11]. The BG model of the UV system is given by Figure
The BG model of the inverter required a raise in the simulation time; to simplify the
model and to decrease the time of simulation we use the average BG method. When the BG
model of the inverter is established, the remainder of the circuit is easily deduced.
Figure 3. Bond graph model of the UV system
0 0.5 1 1.5 2 2.5 3 3.5 4 4.5 5
x 10-4
-500 -400 -300 -200 -100 0 100 200 300 400 500
Time (s)
UL
u
v
(V
)
Figure 4. Simulation of the bond-graph model of the ballast output voltage (lr =0.16mA, Cr1 =0.31μF,Cr2 =2.8μF a=200,b1 =80,b2 =15)
Simulation shows (Fig. 4) that the ballast transforms the voltage 24V provided by the
battery into high frequency tension and an increase in the voltage value for a short time on the
UV lamp.Once the lamp is started, the voltage on its terminals decreases allowing a nominal
Bond-Graph Modelling of the Photovoltaic Source
The UV lamp is fed by photovoltaic source. The PV generator has a non-linear
current-voltage (I-V) characteristic. To simulate (I-V) characteristic, we use the bond-graph
model corresponding to the simplified equivalent circuit of PV generator represented in figure
5 [12-14].
a b
Figure 5. Equivalent scheme of simplified PV array model (a) and its Bond graph model (b)
In order to test the theoretical model, we had compared the experimental (I-V)
characteristic of the PV array to the corresponded of BG simulated one. The two curves are
shown in Figure 6.
0 5 10 15 20 25 30 35 40
0 2 4 6 8 10 12 14 16 18
Panel voltage Up(V) Panel current Ip(A)
0 5 10 15 20 25 30 35 40
0 2 4 6 8 10 12 14
16 Ip(A) Experimental characteristic I=f(V)
Vp (V)
Figure 6. Simulated (Is e 7A
2 .
7 −
= ,VT =2.6V ,Iph =15A) (a) and experimental (b) (I-V)
characteristic of the PV array.
The Bond-Graph Modelling of DC/DC Converter
The DC/DC Converter Model
When the PV generator is directly connected to the load, the system will operate at the
intersection of the (I-V) curve and load line, which can be far from the maximum power point
Therefore the coupling between the ballast + UV lamp and the PV module is implemented via
a Maximum Power Point Tracking controller to operate the PV system at its maximum output
power for any temperature and solar radiation level. The tracking algorithm control of the
MPPT is developed in another work [15].
The converter consists of power components and control circuit. A control algorithm
permits to assure maximum output power. We will use the buck converter for the MPPT
controllers used in this case. These controllers are used to minimize the error between the
operating power and their reference (corresponding to the maximum power).The equivalent
scheme of DC/DC converter is presented in Fig. 7.
V1 V2
I1 I2
Figure 7. Scheme of the buck converter
The Bond-Graph Modelling of DC/DC Converter
This method supposes the ideal switches and gives indirectly the average models
appropriate to the various static inverters which lead to deduce easily the bond-graph model.
For the case of the buck converter, the average values of electric parameter are given by
equation (14) and (15) [14, 15].
∫
∫
+ == T
T
ρ 1 2
ρ
0 1
1 i (t).dt δI
T 1 dt ). t ( i T
1
I (14)
1 δ
0
T
T
δ 2
2
2 v (t).dt δV
T 1 dt ). t ( v T 1
V =
∫
+∫
= (15)There are five steps used to construct the averaged bond graph model, it is detailed in
[13]. The averaged bond graph model of a buck converter developed in [16] is illustrated in
MTF V1
I1
V2
I2
δ
Figure 8. The bond-graph model of buck converter
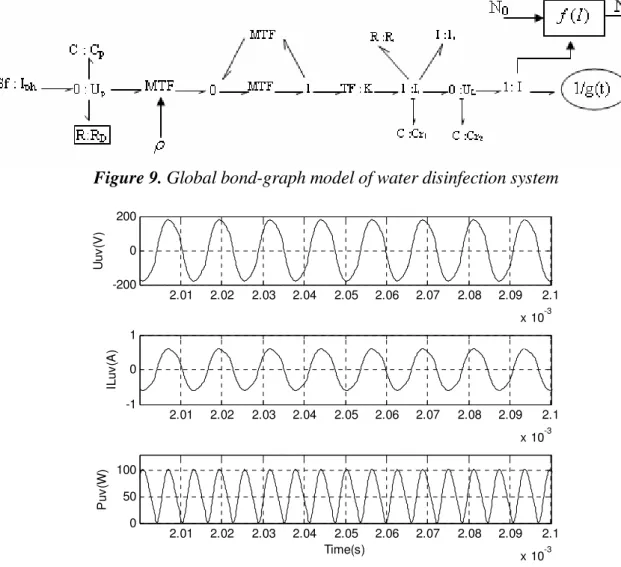
The complete BG model of the system is obtained by associating the models
developed previously. The global model is represented by the Figure 9.
After elaborating the global BG model of treatment water system, a thorough study
can be done. Indeed, from this model, we can simulate the lamp current, voltage and power as
well as the response in bacteriological attack according to UV dose radiation. These
simulations are shown, respectively, in Figure 10 and Figure 13.The experimental results are
represented by Figure 11, 12 and 13.
Figure 9. Global bond-graph model of water disinfection system
2.01 2.02 2.03 2.04 2.05 2.06 2.07 2.08 2.09 2.1
x 10-3 -200
0 200
Uu
v
(V
)
2.01 2.02 2.03 2.04 2.05 2.06 2.07 2.08 2.09 2.1
x 10-3 -1
0 1
ILuv
(A
)
2.01 2.02 2.03 2.04 2.05 2.06 2.07 2.08 2.09 2.1
x 10-3 0
50 100
Time(s)
Pu
v
(W
)
1 >
2 >
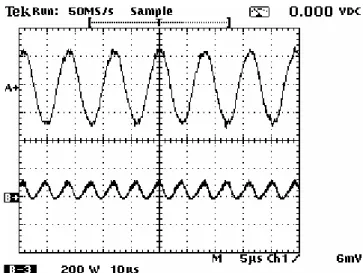
Figure 11. I-lamp (curve 1; 1A/Div -10μs/Div), U-lamp (curve 2; 200V/Div-10μs/Div)) f = 64KHz
Figure 12. I-lamp (curve 1; 0.5A/Div -10μs/Div), P-lamp (curve 2; 200W/Div-10μs/Div
According to simulations the lamp current and voltage have a high frequency
sinusoidal form. The power presents a double alternation form since it is equal to the product
of the lamp voltage and the current. It is noticed that the power frequency is doubled. In order
to test the theoretical model, we had compared the simulation, corresponding to BG model
established, to the experimental result the curves are shown in the following figure. The
starting voltage and waveforms of the UV lamp are shown in figure.4, where we observe that
the peak voltage is approximately 400V. The UV lamp steady-state voltage and current
waveforms, with the inverter operating at 100 Khzare shown in figure.8, where the UV lamp
voltage effective value is approximately equal to 180V, current effective value approximately
model and the obtained simulations, we belonged to experimental measurements of the UV
lamp voltage, current and power. The curves obtained are identical to simulations.
We can say that the experimental results confirm the elaborated simulations for the
lamp current, voltage, pressure and bacteriologic attack response. The complete model
obtained represented the operation of the pilot unit water treatment starting from generator
statement until the quality of water translated by expression N/N0. One being based with
bacteriological analyses, we can act on the quality of water from the model obtained in spite
of the complexity of the phenomenon of water treatment.
Conclusion
This study proposes a treated water system by UV irradiation using discharge-gas
lamp, ballast and photovoltaic generator. In this paper, at first step, the model of UV
discharge-gas lamp (height frequency) is developed. In the second step, we developed the
water disinfection kinetics. We proposed a unified approach of modelling based on graphic
technique known as bond-graph. This technique is systematic and has a sufficient flexibility
to be able to introduce various components into the system. In the developed model we
connected the parameters which act on the water treatment phenomenon (water disinfection)
by UV irradiation, such as the UV lamp illumination, the consumed lamp current, dimensions
of the quartz sheath.
For the developed BG models, we represented the simulation results carried out in the
20.Sim environments. In simulations, we showed different phenomenon which governs the
system operation such as the nonlinear (I-V) characteristic, the operation of the ballast and
UV reactor, the response in bacteriological attack according to UV dose radiation (the water
disinfection kinetics. To validate the models carried out we have to compare simulations
obtained with the experimental results. A control strategy of the system can be implemented
in order to improve the quality of water.
References
UV disinfection of treated waste water in a large-scale pilot plant and inactivation of
selected bacteria in a laboratory UV device, Bioresource Technology 2000, 74(2),
141-150.
2. Zissis G., Damelincourt J.J., Modelling discharge lamps for electronic circuit designers:
A review of the existing methods. Plasma Science, 2002. ICOPS 2002. IEEE Conference
Record - Abstracts. The 29th IEEE International Conference on 2002; DOI:
10.1109/PLASMA.2002.1030646.
3. Rossat-Mignod P., Rojat G., Joubert Ch., Zassis J., Constraints generated by fluorescents
lamps on the electrical network, Industry Applications Conference, 2002. 37th IAS
Annual Meeting, 2002, 1, p. 355-362.
4. Ben-Yaakov S., Shavatsas M., Glozman S., Statics and dynamics of fluorescent lamps
operating at high frequency: modeling and simulation, Applied Power Electronics
Conference and Exposition, 1999. APEC '99. Fourteenth Annual, 1999, 1, p. 467-472.
5. Ribarich T.J., Ribarich J.J., A new high-frequency fluorescent lamp model, Industry
Applications Conference, 1998. Thirty-Third IAS Annual Meeting. The 1998 IEEE 1998,
3, p. 2094-2098.
6. Gervi M., Fortes E.C., Seidel A.R., Bisogno F.E., do Prado R.N., Fluorescent lamp model
employing tangent approximation, Power Electronics Specialists Conference, PESC 2002,
IEEE 33rd Annual, 2001, 1, p. 187-191.
7. Zheng S., Conductance Calculation - Molecular Flow, Long Tube of Circular Cross
Section. GEM TN-93-382 (USDE document, 5p.). 1993.
8. Zitouni N., Andoulsi R., Sellami A., Mami A., Hssen A., Sliding mode control for non
linear water treatment system, Systems Signals and Devices (SSD), 2010 7th International
Multi-Conference on 2010; doi: 10.1109/SSD.2010.5585546.
9. Viejo C.B., Anton J.C.A., Robles A., Martin F.F., Viera J.C., Bhosle S., Zissis G.,
Comparison between Different Discharge Lamp Models Based on Lamp Dynamic
Conductance, Industry Applications, IEEE Transactions, 2011, 47(4), p. 1983-1991.
10.Jui P.Y., Horng C.H., Design and testing of a separate type lighting system using solar
energy and cold-cathode fluorescent lamps, Applied Energy, 2007, 84(1), p. 99-115.
11.Felix G.R., Lifetime evaluation of DC-supplied electronic ballast with fluorescent lamps
system with battery storage to a wind gust, Energy Conversion, IEEE Transactions 1997,
12(1), p. 73-78.
13.Sukamongkol Y., Chungpaibulpatona S., Ongsakul W., A simulation model for predicting
the performance of a solar photovoltaic system with alternating current loads, Renewable
Energy, 2002, 27(2), p. 237-258.
14.Andoulsi R., Mami A., Dauphin-Tanguy G., Annabi M., Bond graph modelling and
dynamic study of a photovoltaic system using MPPT buck-boost converter. Systems, Man
and Cybernetics, 2002 IEEE International Conference on 2002, 3, doi:
10.1109/ICSMC.2002.1176036.
15.Zitouni N., Andoulsi R., Sellemi A., Mami A., Hssen A., A new Bond Graph Model of a
Water Disinfection System Based on UV Lamp Feed by Photovoltaic Source: Simulation
and Experimental Results, Journal of Automation & Systems Engineering, 2011, 5(2), p.
79-95.
16.Mezghanni D., Andoulsi R., Mami A., Dauphin-Tanguy G., Bond graph modelling of a
photovoltaic system feeding an induction motor-pump, Simulation Modelling Practice and