Simulation of generalized hybrid model for solar and wind power
generation
Vankadara Sampath kumar*, Dr. A. Srinivasa rao**
*(M. Tech, Department of electrical and electronics engineering, GITAM University, Visakhapatnam, INDIA) **(Professor, Department of electrical and electronics engineering, GITAM University, Visakhapatnam, INDIA)
ABSTRACT
Due to urbanization, globalization and industrialization the demand for energy is rapidly increasing allows the world and India is not an exception. Out of all energies electrical energy is playing a major role in developed as well as developing countries. The energy is mostly produced by fossil fuels which are developing day his is to by day .they also produce lot of pollutants which totally damage the environment the alternative to this is to encourage renewable energy source. Now days the energy production at domestic level is becoming popular with the help of solar and wind energies . These technologies are widely used now days in the present paper an attempt has been made to simulate a generalized hybrid model including solar and wind.
Keywords– DC Link, PMSG, WECS , Hybrid.
I.
INTRODUCTION
In this paper main objective of our work is to Generate Electricity in eco-friendly way. Increasing population results rise in Energy demands day by day we have only limited conventional resources. In this crucial stage of energy availability, alternative way of power generation has to be taught of Solar and wind are clean renewable energy sources. It is one time investment and prevents global warming.
For optimal sizing of all the components and to minimize cost of wind diesel electrical power generation an algorithm is developed [15].Small autonomous power systems (SAPS) like solar and wind power sources are well-being accessed with systematic analytical approach avoids the cost concern and shortage of conventional resources
To minimize the life cycle cost a generalized model is developed based on different system components of a hybrid energy system and an optimal combination of energy components for a typical rural community [16].Small-scale hybrid PV-Wind generation system works only in standalone mode with batteries. The power conditioning unit is used to maximize the output power from both the wind and the PV generators to the batteries the power ratings and load management are not taken into account. A design supervisory controller based on the sliding mode control is presented in reference [8].
In this paper the generalized block diagram consists of 5.6kW PMSG based wind energy conversion system and solar array of 2.7kw. At the load individual boost converters are used . Two sources are connected in parallel to a common DC bus link. Output of this common DC link is connected to a three Phase SPWM Inverter. Power
will be generated with the help of both photovoltaic & wind energy and will be supplied to the bus bar from where power is supplied to the load. Flow of power scheme can be observed as PV array—DC/DC Boost converter—Common DC link. For wind energy, Power flow can be observed as Wind energy—Turbine—PMSG—Rectifier—Boost Converter— Common DC Link. DC link common voltage is given as an input to the 3 phase SPWM Inverter. Operation of Boost converter takes place in a closed loop to maintain the constant DC output voltage. The entire circuit simulation is done by using MATLAB/SIMULINK environment.
II.
Original Diagram and Description
The complete layout of wind-solar hybrid system which supplies either ac or dc or both is shown figure-1
Figure-1 Hybrid Model Block Diagram
A. Photovoltaic (P.V) Solar Modules
Figure2 indicates typical block diagram of PV system Using silicon being a main constituent of sand which one of the most abundant element on earth is used in the manufacturing of solar cell also known as photovoltaic cell. Combination of several solar cells design is said to be solar module and it is also an weather proof unit. Incident light is absorbed by the solar cell which is diode and it is converted into electricity. Physically and electrically connected solar modules will give rise of solar panels. Energy consumption must be estimated to determine the size of PV modules. Therefore size of PV module is calculated as Wp [5].
Energy consumption measures in watts or kilowatts where isolation is in KWh/m2/Day.
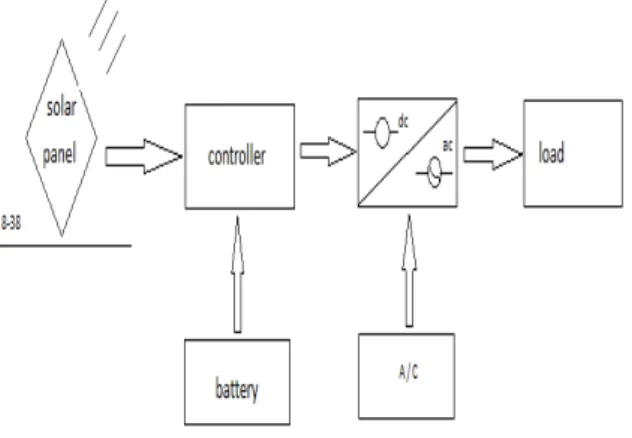
Figure 2 Photovoltaic System
Block diagram consists of solar panels which it absorbs the light energy from sunlight by using MPPT controller and the obtained electrical energy is converted from dc to ac and it is given to load the controller is assisted by battery for continuous supply. The ratings of the solar cell in the panel is given below.
Specification of single solar cell: Nominal Power Pmax =85W, Voltage at maximum power =29.12V, Current at maximum power =5.95A, Open circuit voltage of single module =36.02V, Short circuit current =7.78A, Solar cell per module =36, Open circuit voltage of single solar cell =0.6V, Irradiance =1000W/m2, So in order to obtain the 2.2kW power output we connected 17 module in series.
B. Wind Power Modelling
Conversion of wind energy to electrical Energy and to predict the output production of wind turbine generators (WTG) various mathematical models have been developed. For this purpose a statistical function found which known as Weibull distribution function is used to find the wind distributed in the site selected of the case study and monthly/annually mean speed of the wind at the site. Therefore the Weibull distribution function accepted more for this
purpose.[10,11] .The two parameter Weibull distribution function mathematically expressed in Eq[2],the cumulative distribution function it has in Eq 4 is given as Speed of wind is V-shape parameter is k which is dimension less, scale parameter of the distribution function is C (m/s),
To determine C and K widely accepted approximations are given in equations 1 and 2 respectively [11,12]
(1)
C= (2)
Where V´ = mean speed (ms-1)
Area swept out by the rotor and the density of the air and the cube of the wind speed is directly proportional to the amount of power transferred to a wind turbine, the power P in the Wind is given by The power P in the wind is given by
P = ½ Cp. ρ.A. V´3 (3) Power coefficient of the turbine is given by Cp, A maximum theoretical value of 0.593 been proposed for Cp[8,9]
ρ = Air density (kg/m3),
A (Rotor swept area) = (m2) (4)
Where D is diameter of rotor blade(m) and V1=Mean speed of wind(ms-1)
Wind Energy Conversion System Pm (watts) = 1/2 ρ*A*V3
*Cp
Pm is the mechanical output power of the turbine. Cp is the turbine power coefficient,
ρ is the air density,
A is the turbine swept area, V is the wind speed
Function of tip speed ratio λ given by: λ = Ω*R/V
Ω: Rotational speed of blades R: Radius of turbine blades V: Wind speed
C. Battery Subsystem
In enhancing systems which are hybrid battery energy storage system (BESS) has a great significance which stabilizes and permits the system to maintain at a constant and stable output despite of load fluctuations .It also covers the deficient energy in case where there is a lack of primary energy sources like sun and wind. To meet the challenges of utility application battery technology have been improved significantly. The high energy density, round trip efficiency, high energy capability, cycling capability, initial cost and life span are key factors of battery for storage applications. Various types of battery technologies are available for large scale storage energy system, but the lead acid technology is a low cost option and mature technology which is suitable in rapid discharge/charge large bulk storage system but limited life cycle and the low energy density are to be the main disadvantage of this technology
Battery simulation model:
Figure-5:Simulink model of battery bank
Figure-6 Simulink model
D. Modelling of 3 phase SPWM inverter
DC electricity from sources such as solar panels, batteries, or fuel cells to AC electricity by an inverter.at any required voltage in particular operation AC equipment is designed for mains operation electricity.in the presence of main supply the battery voltage is maintained constant by using controlled chargers however in the absence of mains the output voltage can be decreased by decreasing the battery voltage. Output voltage can be changed by variation of load. Web browsers, industrial instrumentation, note book computers, entertainment systems and automotive are used this constant current output voltage inverters. Wide range of topologies are available in the sine wave inverters.by using toroidal transformer with an output filter high frequency switching is possible with a DC link in the CVT(Current voltage transformer) and secondary .the common goal is to bring the sinusoidal output. But the output waveforms get distorted and efficiency gets effect due to certain critical loads such as computers, fluorescent lights with electronic ballasts, television, microwave ovens etc.
Figure-7 Simulation model of spwm inverter
E. Modelling of boost converter
boost converter, and the error signal is goes to the PWM block, inside the PWM block we have a carrier signal of very high frequency which is compared with the error signal of PID controller. Frequency of carrier signal is kept at 20 KHz.
Figure-8 Circuit Diagram of Boost Converter
Basic Configuration of a Boost Converter:
Shows the basic configuration of a boost converter where the switch is integrated in the used Integrated circuit. Lower power converters which are having the diode are replaced by a second switch which is integrated to the converter. If this is the case, all equations in this document apply besides the power dissipation equation of the diode.
Figure9-boost converter-close loop
Necessary Parameters of the Power Stage
1. Input voltage range: Vin (max) and Vin (min) 2. Nominal output voltage: Vout
3. Maximum output current: Iout(max)
4. Integrated circuit which uses to develop the boost converter
By knowing the above parameters power stage calculation can be done by mat lab program given below
USER DEFINED PROGRAM FOR BOOST CONVERTER
% the following are four parameters needed to calculate the power stage:
%1.input voltage range: Vin (max) and Vin (min) %2.Nominal output voltage: out
%3.maximum output current: out(max) clc;
disp('boost converter calculation')
Vin=input('ener the minimum input voltage::'); Vin1=input('ener the maximum input voltage::'); Vout=input('enter the output voltage::');
I=input('enter the maximum output current::'); fs=input('enter the switching frequency;;'); %calculation of maximum switch current n=0.9;
D=1-((Vin*n)/Vout);%duty cycle
di=2*I*(Vout/Vin);%inductor ripple current L=(Vin*(Vout-Vin))/(di*fs*Vout);%inductor value %dv=(I/(1-D))+(di/2);
dv=0.5
c=I*D/(fs*dv);%output capacitor value R=Vout/I;
disp('duty cycle') D
disp('INDUCTOR VALUE::::') L
disp('voltage ripple:::') dv
disp('capacitor value microfarad:::') C=c;
C R
disp('*****')
F.Rectifier Simulink modelling
Figure10-rectifier simulink model
III. ANALYSIS OF RESULTS:
Simulating the above circuits we get the following results
A. PV Module power ,current and voltage out puts in hybrid model is given below the parameters are also given to obtain the desired output and the output of the PV is given to the boost converter as shown in the main block diagram Output Voltage = 505 V getting constant
module produces =32.97V
Output Power = 2022 W getting constant corresponding to 1000 insolation Each PV module produces 131.88W
Figure11-pv results
B.
Figure12-wind power results
C.
Figure14-voltage in wind system
D. Boost converter programme results: 1 Min
i/p volt age Max i/p volta ge Outpu t voltag e Outpu t curre nt Switc hing frequ ency Comp onent s 502. 5 502. 5
1500 48 10000 0 Dut
y Cyc le
Di Induc tor Value (L) Volta ge Rippl e Capac itance (µF) Resist ance
0.5 226. 87
1.473 0*e^-005
0.5 5.817 8*e^ -004
39.47 37
2 Min i/p volt age Max i/p volta ge Outpu t voltag e Outpu t curre nt Switc hing frequ ency Comp onent s
435 435 1000 28 40000 Dut
y Cyc le
Di Induc tor Value (L) Volta ge Rippl e Capac itance (µF) Resist ance
0.5 128. 735
4.772 9*e^-005
0.5 9.737 0*e^ -004
35.71 3
3 Min i/p volt age Max i/p volta ge Outpu t voltag e Outpu t curre nt Switc hing frequ ency Comp onent s
420 420 1000 28 30000 Dut
y Cyc le
Di Induc tor Value (L) Volta ge Rippl e Capac itance (µF) Resist ance
0.5 128. 735
4.772 9*e^-005
0.5 9.737 0*e^- -004
32
E. Boost converter:
Figure14-Output Current Wave Form Of Spwm Inverter
G. Results obtained from rectifier:
Figure15-rectifier output voltage
H.
Figure16-Results of battery model
I.
Figure17-output voltage of dc-link in system
IV. CONCLUSION
Simulation of the PV cells, wind energy conversion system ,boost converter ,inverter, rectifier, single pulse width modulated inverter done by using Simulink mat lab .Boost converter triggered by using GTOs with the help of PWM technique and the output of the individual is given to DC link.
The combined output which is given to grid by using stepdown transformer used for various applications . I can be further improved by including other renewable sources like fuel cells, geothermal etc.
REFERENCES
[1] A.B. Kanase-Patil*, R.P. Saini, M.P. Sharma, ―Sizing of integrated renewable energy system based on load profiles and reliability index for the state of Uttarakhand in India‖ ELSEVIER, Renewable Energy (36) 2011.pp.2809-2821
[2] AkieUehara,,AlokPratap, Tomonori Goya, Etc.. ―A Coordinated Control Method to Smooth Wind Power Fluctuations of a PMSG-Based WECS‖ IEEE Transactions on Energy Conversion, VOL. 26, NO.2, JUNE 2011
[3] BelginEmreTurkay, Ali YasinTelli ―Economic Analysis of Standalone and grid
connected hybrid energy systems‖
ELSEVIER, Renewable Energy (36) 2011.pp.1931-1943
[4] C Wang and M Nehrir, "Power management of a stand-alone wind/photovoltaic/fuel cell energy system," IEEE Transactions on Energy Conversion, vol. 23, no. 3, pp. 957-967, 2008.
Excited Permanent-Magnet Brushless Machine IEEE Transactions on Industrial Electronics, VOL. 57 , NO. 3,pp. 831-839 MARCH 2010
[6] Dheeraj Kumar Khatod, Vinay Pant, and Jaydev Sharma.‖ Analytical Approach for
Well-Being Assessment of Small
Autonomous Power Systems with Solar and Wind Energy Sources‖ IEEE Transactions on Energy Conversion, VOL. 25, NO . 2, pp.535-545 JUNE 2010
[7] 7 Dong Chen, Junming Zhang, Member, IEEE, and Zhaoming Qian, Senior Member, IEEE ―An Improved Repetitive Control Scheme for Grid- Connected Inverter With Frequency-Adaptive Capability‖ IEEE
TRANSACTIONS ON INDUSTRIAL ELECTRONICS, VOL. 60, NO. 2, FEBRUARY 2013
[8] F Valenciaga and P Puleston, "Supervisor control for a stand-alone hybrid generation system using wind and photovoltaic energy," IEEE Transactions on Energy Conversion, vol. 20, no. 2,pp. 398-405, 2005
[9] G Mahesh Manivanna, R Rama Reddy, ―Analysis and simulation of Seven Level
Inverter System” International Journal of Engineering Techno science Vol (1) 2010.pp.62-68
[10] J Carrasco et al., "Power-electronic systems for the grid integration of renewable energy sources: A Survey ," IEEE Transactions on Industrial Electronics, vol. 53, no. 4, pp. 1002–1016,2008
[11] S Kjaer, J Pedersen, and F Blaabjerg, "A review of single-phase grid-connected inverters for photovoltaic modules," IEEE Transactions on Industry Applications, vol. 41, no. 5, pp. 1292–1306,2005
[12] Seul-Ki Kim, Jin-Hong Jeon, Chang-Hee Cho, Jong-Bo Ahn, and Sae-Hyuk Kwon, Dynamic Modeling and Control of a Grid-Connected Hybrid Generation System With Versatile Power Transfer IEEE Transactions on Industrial Electronics, VOL. 55, NO.4, pp .1677-1688 APRIL 2008
[13] Shuitao Yang, Qin Lei, Fang Z. Peng, and Zhaoming Qian; ―A Robust Control Scheme for Grid- Connected Voltage-Source Inverters‖ IEEE Transactions on Industrial Electronics, VOL. 58, NO. 1, pp.202-212 JANUARY 2011
[14] T Gebre, T Undeland, O Ulleberg, and P Vie, "Optimal load sharing strategy in a hybrid power system based on PV/Fuel Cell/ Battery/Super capacitor," in International Conference on Clea Electrical Power, Capri, Itali, pp .141-146, 2009 .
[15] Tapas Kumar Saha, and DebaprasadKastha,‖
Design Optimization and Dynamic
Performance Analysis of a Stand-Alone Hybrid Wind–Diesel Electrical Power Generation System‖ IEEE transactions on Energy Conversion, VOL. 25, NO. 4, pp. 1209-1217 DECEMBER 2010
[16] S. Ashok, ―Optimised model for community-based hybrid energy system‖ ELSEVIER, Renewable Energy (32) 2007.pp 1155-1164 2014
[17] Modeling of the Wind Turbine with a Permanent Magnet Synchronous Generator for Integration Ming Yin, Student Member,
IEEE, Gengyin Li, Member, IEEE, Ming Zhou, Member, IEEE, Chengyong Zhao,