PDGFR
β
Is a Novel Marker of Stromal
Activation in Oral Squamous Cell Carcinomas
Vinay K. Kartha1,2☯, Lukasz Stawski3☯, Rong Han3, Paul Haines3, George Gallagher4,
Vikki Noonan4, Maria Kukuruzinska5, Stefano Monti2‡
*, Maria Trojanowska3‡
*
1Bioinformatics Program, Boston University, Boston, Massachusetts, United States of America,2Division of Computational Biomedicine, Boston University School of Medicine, Boston, Massachusetts, United States of America,3Arthritis Center, Boston University School of Medicine, Boston, Massachusetts, United States of America,4Division of Oral Pathology, Boston University School of Dental Medicine, Boston,
Massachusetts, United States of America,5Department of Molecular and Cell Biology, Boston University School of Dental Medicine, Boston, Massachusetts, United States of America
☯These authors contributed equally to this work. ‡These authors also contributed equally to this work. *[email protected](MT);[email protected](SM)
Abstract
Carcinoma associated fibroblasts (CAFs) form the main constituents of tumor stroma and play an important role in tumor growth and invasion. The presence of CAFs is a strong pre-dictor of poor prognosis of head and neck squamous cell carcinoma. Despite significant progress in determining the role of CAFs in tumor progression, the mechanisms contributing to their activation remain poorly characterized, in part due to fibroblast heterogeneity and the scarcity of reliable fibroblast surface markers. To search for such markers in oral squa-mous cell carcinoma (OSCC), we applied a novel approach that uses RNA-sequencing data derived from the cancer genome atlas (TCGA). Specifically, our strategy allowed for an unbiased identification of genes whose expression was closely associated with a set of bona fide stroma-specific transcripts, namely the interstitial collagens COL1A1, COL1A2, and COL3A1. Among the top hits were genes involved in cellular matrix remodeling and tumor invasion and migration, including platelet-derived growth factor receptor beta (PDGFRβ), which was found to be the highest-ranking receptor protein genome-wide. Simi-lar analyses performed on ten additional TCGA cancer datasets revealed that other tumor types shared CAF markers with OSCC, including PDGFRβ, which was found to significantly correlate with the reference collagen expression in ten of the 11 cancer types tested. Subse-quent immunostaining of OSCC specimens demonstrated that PDGFRβwas abundantly expressed in stromal fibroblasts of all tested cases (12/12), while it was absent in tumor cells, with greater specificity than other known markers such as alpha smooth muscle actin or podoplanin (3/11). Overall, this study identified PDGFRβas a novel marker of stromal activation in OSCC, and further characterized a list of promising candidate CAF markers that may be relevant to other carcinomas. Our novel approach provides for a fast and accu-rate method to identify CAF markers without the need for large-scale immunostaining experiments.
a11111
OPEN ACCESS
Citation:Kartha VK, Stawski L, Han R, Haines P, Gallagher G, Noonan V, et al. (2016) PDGFRβIs a Novel Marker of Stromal Activation in Oral Squamous Cell Carcinomas. PLoS ONE 11(4): e0154645. doi:10.1371/journal.pone.0154645
Editor:Yves St-Pierre, INRS, CANADA
Received:January 18, 2016
Accepted:April 15, 2016
Published:April 29, 2016
Copyright:© 2016 Kartha et al. This is an open access article distributed under the terms of the
Creative Commons Attribution License, which permits unrestricted use, distribution, and reproduction in any medium, provided the original author and source are credited.
Data Availability Statement:All relevant data are within the paper and its Supporting Information files.
Funding:This work was in part supported by NIH grant R01 AR 44883, and by the Evans Center for Interdisciplinary Biomedical Research ARC on “Etiology and Pathogenesis of Oral Cancer (EPOC)” at Boston University (http://www.bumc.bu.edu/ evanscenteribr/). The funders had no role in study design, data collection and analysis, decision to publish, or preparation of the manuscript.
Introduction
It is well recognized that the tumor microenvironment, consisting of carcinoma associated fibroblasts (CAFs), endothelial cells, and immune cells, is vital for carcinoma cell proliferation, invasion and metastasis. CAFs, due to their ability to produce and dynamically modulate extra-cellular matrix (ECM), play a particularly important role in tumor invasion and subsequent metastatic colonization [1–4]. CAFs also produce angiogenic factors, proteases, growth factors, immune response-modulating proteins, anti-apoptotic proteins, and signaling molecules—all highly relevant to tumor biology. The cross-talk between tumor cells and CAFs is bi-direc-tional, with fibroblasts evolving in parallel with tumor cells and undergoing phenotypic modifi-cations in response to changes occurring in tumors [4]. The specific mechanisms underlying these complex interactions are only beginning to be elucidated and are likely to be influenced by the type of tumor and the local tissue microenvironment.
The activated tumor stroma shares some similarities with generic wound repair, as well as tissue fibrosis. It can be viewed as a biological response to a disrupted or damaged epithelial layer with stromal activation representing a repair process to restore tissue integrity and homeostasis [5]. The origin of CAFs can be diverse and involve both local and distant reser-voirs. Locally, CAFs can arise from resident tissue fibroblasts, where TGFβ, as well as a stiffen-ing matrix can promote their differentiation to alpha smooth muscle actin (αSMA)-positive myofibroblasts [2,6]. Alternative local sources may include mesenchymal or adipose-derived stem cells (MSC or ASC), as well as endothelial cells that can give rise to CAFs through endo-thelial to mesenchymal transition (EnMT). In some tumors, epiendo-thelial tumor cells may acquire a CAF-like phenotype through epithelial to mesenchymal transition (EMT). The contribution of bone marrow-derived MSCs and circulating CD34+ fibrocytes was also documented in sev-eral tumor models [1].
The importance of CAFs in oral cancer is supported by several reports that show correlation between the presence ofαSMA-positive fibroblast cells and poor prognosis [7,8]. In a large study of OSCC patients, the abundance of myofibroblasts was the best independent predictor of patient mortality [1]. However, the source of these phenotypically-active fibroblastic cells in OSCC lesions and the mechanisms underlying their activation remain poorly understood. The progress in this field is hindered by the lack of reliable fibroblast-specific markers owing to the heterogeneity and remarkable plasticity of fibroblast cells. Furthermore, a comprehensive anal-ysis aimed at identifying such markers using high-throughput, genome-wide expression data is yet to be performed.
Materials and Methods
TCGA RNA-sequencing data processing
RNA-sequencing (RNASeq) data was downloaded for TCGA Head and Neck Squamous Cell Carcinoma (HNSC) cancer cohort using Firehose v0.4.3 corresponding to the February 4th 2015 Firehose release. RNASeq version 2 data pertaining to Level 3 RSEM-normalized gene expression values was used. OSCC data was derived from the HNSC dataset by only including patients that corresponded to OSCC anatomic neoplasm subtypes, namely alveolar ridge, base of tongue, buccal mucosa, floor of mouth, oral cavity and oral tongue (N = 352). Adjacent mor-phologically normal epithelial (AE) samples were defined using TCGA sample barcoding information and used as a control group. Only genes having non-zero expression in at least one sample were retained in each of the analyzed datasets.
Genome-wide collagen Nearest Neighbor (NN) analysis
Mean collagen expression ofCOL1A1,COL1A2andCOL3A1across all samples in the OSCC dataset was computed and used as a reference for fibroblast-specific marker expression. These values were then correlated genome-wide (N = 20,243) using Pearson correlation with rigorous sample permutation-based p-value calculation to assess statistical significance for each gene (n = 1,000), and false discovery rate (FDR) used for multiple hypotheses testing correction. A ranked list of genes in decreasing order of Pearson coefficient was generated and used in subse-quent analyses.
Pan-cancer collagen NN enrichment analysis
TCGA RNASeq gene expression data pertaining to Adrenocortical carcinoma (ACC), Bladder urothelial carcinoma (BLCA), Colon adenocarcinoma (COAD), Kidney renal clear cell carci-noma (KIRC), Acute myeloid leukemia (LAML), Liver hepatocellular carcicarci-noma (LIHC), Lung adenocarcinoma (LUAD), Lung squamous cell carcinoma (LUSC), Pancreatic adenocarcinoma (PAAD), and Prostate adenocarcinoma (PRAD) was obtained as described for the HNSC data-set (see TCGA RNA-sequencing data processing). The described NN analysis was applied to each dataset, similar to OSCC (see Genome-wide collagen Nearest Neighbor (NN) analysis), yielding a ranked list of genes for each dataset sorted in decreasing order of Pearson correlation coefficient. The top 50 genes for each cancer type were then tested for enrichment against each of the other cancer types by a Kolmogorov-Smirnoff (KS) test (using the ranked list in the given cancer type as a reference). This yielded pairwise KS D statistics for all 11 cancer types. Since enrichment for a given pair of cancer types was tested in both directions, the two values were averaged. Cancer types were then clustered using hierarchical clustering with average linkage for the agglomeration rule.
Stromal score analysis
Correlation of stroma scores obtained using the ESTIMATE algorithm with mean collagen expression was computed (Pearson r = 0.88, p-value<0.0001). Stroma signature scores based
Tumor purity analysis
Estimates of tumor purity computed using the ABSOLUTE algorithm [10] were obtained for HNSC samples from the Broad Institute of MIT and Harvard. For the OSCC tumor samples that had both ABSOLUTE tumor purity estimates and gene expression values (N = 278), we applied a Pearson correlation to test for the association between tumor sample purity and the described mean collagen expression.
Cell lines
Tested and authenticated CAL27 cells were purchased from ATCC. HSC-3 cells were a kind gift from Roberto Weigert (NIH, Bethesda, MD), and were described previously [11]. CAL27 and HSC-3 cells were cultured under standard conditions in DMEM (Mediatech, Herndon, VA) supplemented with 10% FBS (Sigma-Aldrich). Fibroblast culture was established from human tongue OSCC specimens (see Human oral tissue specimens). Biopsy was cut into small pieces and dissociated enzymatically by 0.25% collagenase (Worthington Biochemical Corpo-ration, Lakewood, NJ) in DMEM with 20% fetal bovine serum. Digested tissue was placed in a culture dish in 5 ml of DMEM with 20% fetal bovine serum and grown for 3–5 days. The resulting confluent culture was subsequently passaged in DMEM with 10% fetal bovine serum.
Real-time PCR
Total RNA was isolated using TRIzol reagent (MRC, Inc., Cincinnati, OH). Real-time PCR was performed using the StepOnePlus™Real-Time PCR System (Applied Biosystems, Carlsbad, CA). Briefly, 1μg of total RNA was reverse transcribed with random hexamers in a total vol-ume of 20μl using a Transcriptor First Strand cDNA Synthesis Kit (Roche, Tuscon, CA) according to the manufacturer’s protocol. The cDNA was diluted to 200μl. The real-time PCR was carried out using SYBR1
Green PCR Master Mix (Applied Biosystems) with 2μl of diluted cDNA in triplicates with glyceraldehyde 3-phosphate dehydrogenase (GAPDH) as the internal control. Real-time PCR was performed at 95°C for 10 min, followed by 40 cycles of 95°C for 15 sec and 60°C for 1 min. Melting curve analysis of PCR products confirmed the absence of sec-ondary products. The primer sequences used for real-time PCR are available upon request.
Human oral tissue specimens
Immunohistochemistry and picrosirius red staining on tumor and ulcer
biopsy tissues
Immunohistochemistry was performed on formalin-fixed, paraffin-embedded 8μm oral mucosa tissue sections using the Vectastain ABC kit (Vector Laboratories, Burlingame, CA) and Vector ImmPress Rabbit or Rat-AP kit according to the manufacturer's instructions. Briefly, sections (5μm thick) were mounted on APES (aminopropyltriethoxy silane solution)-coated slides, deparaffinized with Histo-Clear (National Diagnostics, Atlanta, GA), and rehy-drated through a graded series of ethanol. Endogenous peroxidase was blocked by incubation in 3% hydrogen peroxide for 30 minutes, followed by incubation with 0.15 M glycine for 45 minutes, and blocking buffer (3% BSA) for 1 hour. Sections were incubated overnight at 4°C with antibodies against PDGFRβ(rabbit polyclonal anti-PDGFRβ, Cell Signaling, Danvers, MA), Periostin (rabbit polyclonal anti-Periostin, Abcam, Cambridge, MA) Podoplanin (rat anti-human Podoplanin, eBioscience, San Diego, CA) and Smooth Muscle Actin (biotinylated mouse monoclonal anti-SMA, NeoMarkers, Fremont, CA). For picrosirius red staining, slides were prepared similarly and were placed following rehydration in prewarmed Bouins’solution for 1 hour at 60°C, followed by 0.1% Direct red (Sigma-Aldrich, St. Louis, MO) in saturated aqueous picric acid for 30 minutes. After brief washing in water, slides were placed in 0.1% Fast green (Fisher Scientific, Pittsburgh, PA) in water for 10 minutes, quenched in 1% acetic acid, and dehydrated through a graded ethanol series.
Immunofluorescence staining on frozen specimen sections
For all immunofluorescence staining tumor samples were directly embedded in O.C.T. com-pound, flash frozen, and stored at -80°C. Staining was performed on 5μm cryosections of tumor. Briefly, slides were blocked with a blocking solution (3% BSA [Sigma-Aldrich], and 0.1% Triton1
X-100 in PBS) for 2 h. After washing, tissue sections were incubated at 4°C over-night with primary antibodies: rabbit polyclonal PDGFRB (Cell Signaling, Danvers, MA), mouse anti-E-Cadherin (BD Biosciences) and goat polyclonal VE-Cadherin (Santa Cruz, CA). After washing, tissue sections were incubated with secondary Ab: Alexa fluor 488 donkey anti-rabbit (Invitrogen, Grand Island, NY), Alexa fluor 594 donkey anti-mouse, and Alexa fluor 594 donkey anti-goat (Invitrogen, Grand Island, NY) for 1.5 h. Coverslips were mounted on slides using Vectashield with DAPI (Vector Laboratories, Burlingame, CA) and examined using a FluoView FV10i confocal microscope system (Olympus, Center Valley, PA) at 488 nm (green), 594 nm (red) and 405 nm (blue).
Results
Collagen genes
COL1A1
,
COL1A2
, and
COL3A1
are highly expressed
in fibroblasts relative to OSCC cells
epithelia (AE), with a sustained elevated expression in tumor grade 1 to grade 3/grade 4 groups, suggesting an early activation of fibroblasts in primary OSCCs (ANOVA p-value<0.0001.
Fig 1A).
Mean collagen expression strongly correlates with ESTIMATE stromal
scores in OSCC
To independently assess the reliability of collagen expression as a proxy for stromal infiltration, we correlated stromal score values generated using the ESTIMATE algorithm with the corre-sponding mean collagen expression. Remarkably, we found that the mean expression of the three chosen collagen genes was highly positively correlated (Fig 1B; Pearson r = 0.88, p-value<0.0001) with the ESTIMATE-based stromal scores derived using a gene signature
com-prising a total of 141 genes. Despite strict selection for inclusion, TCGA tissue samples may Fig 1. Collagen expression is elevated early in OSCC and can be used to identify potential OSCC CAF markers. A. Boxplot of average fibroblast-specific collagen expression (COL1A1,COL1A2,COL3A1) with
respect to tumor grade for TCGA OSCC data.B. Correlation of stroma scores obtained using the ESTIMATE algorithm with mean collagen expression (Pearson r = 0.88, p-value<0.0001). AE: Adjacent normal epithelium
retain a heterogeneous mix of cell types, causing varying levels of tumor purity. To assess whether the expression of the three specific collagens simply reflected the level of overall tumor purity, we correlated the average collagen expression and OSCC tumor purity estimated using the ABSOLUTE algorithm. To this end, TCGA samples with matching RNASeq expression and ABSOLUTE-based tumor purity estimates (N = 278) were analyzed. We observed a mod-erate negative correlation between the two features (r = -0.32; p-value = 4.4e-08.S1 Fig), indi-cating that higher average fibroblast-specific collagen expression only partially explains corresponding lower tumor purity. Degree of immune cell infiltration would be a logical addi-tional contributor to reduced tumor purity not captured by collagen expression. Taken together, these results suggest that, in the context of OSCC, the mean expression of these three collagens may serve as a good proxy for stromal infiltration.
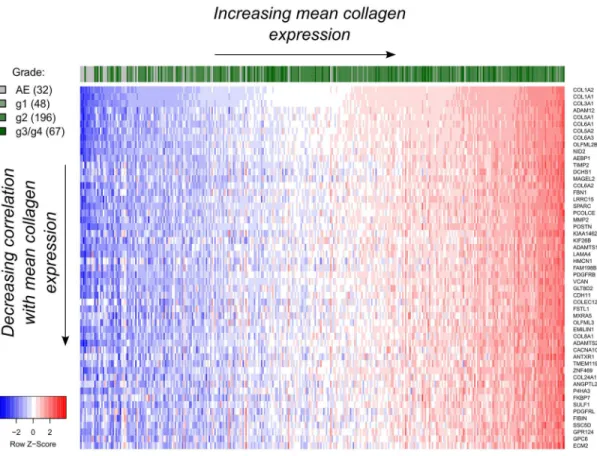
Identification of potential stromal markers in OSCC
We performed a genome-wide 'nearest neighbor' (NN) analysis using the TCGA OSCC dataset to identify genes whose expression best-correlated with the average expression of the three cho-sen collagen genes (see Genome-wide collagen Nearest Neighbor (NN) analysis andS2 Table). Among the top-ranking genes, we found primarily ECM-specific genes, such as collagen type VI (COL6A1,COL6A3),FBN1,ADAM12,SPARC, andPOSTN(Fig 2).PDGFRBwas also found to be highly positively correlated (Pearson r = 0.85, FDR = 0.0085), and was the highest-ranked transmembrane protein-encoding gene among the 20,243 genes tested (rank = 25),
Fig 2. Gene expression profile of the top 50 hits (53 includingCOL1A1,COL1A2andCOL3A1) obtained from the nearest neighbor (NN) gene expression analysis using mean collagen expression as a reference for TCGA OSCC data.Only samples with known tumor grade are highlighted. Expression values were log2-transformed after
adding a pseudo-count of 1 and standardized per gene prior to their visualization. AE: Adjacent normal epithelium.
suggesting that PDGFRβcould serve as a cellular marker of OSCC CAFs. Gene-set enrichment analysis (GSEA) confirmed a positive enrichment of genes involved in ECM organization and signaling by PDGF (S3 Table) with respect to the average collagen expression. Also, the top 50 genes were found to be more highly correlated with each other within the OSCC sample group than within the AE samples (S2 Fig), suggesting a more coordinated expression of these genes in OSCCs compared to controls. Expression of select genes within the top 50 hits was further examined experimentally using quantitative PCR in OSCC fibroblast pairs and in OSCC tumor cell lines (S1 Table). Whereas all of the assessed genes showed high expression in fibroblasts, several genes, includingSPARC,ADAM12,TIMP2,MMP2, andCOL5A2were also expressed in carcinoma cells, albeit at lower levels. The remaining genes were either undetected or expressed at negligible levels in tumor cells, confirming their CAF-specific expression. It is important to note that gene expression in tumor cell lines may not accurately reflectin vivo
conditions, and that this should be further experimentally validated in patient tumors.
PDGFR
β
is a reliable marker of CAFs in OSCC
To assess the expression and tissue localization of PDGFRβin OSCC, we performed immunos-taining in twelve OSCC tumor tongue specimens and paired morphologically normal AE tis-sue. For comparison, we analyzed PDGFRβexpression in six tongue specimens representing benign hyperkeratosis and epithelial hyperplasia, as well as 10 tongue ulcer specimens. PDGFRβlocalized to the blood vessels in AE tissue, consistent with a pericyte/smooth muscle cell expression (Fig 3A). Similar expression patterns were also observed in the hyperkeratosis/ hyperplasia specimens. Conversely, numerous fibroblasts expressing high levels of PDGFRβ were found in stroma surrounding tumor islands in all OSCC specimens (12/12), while no
Fig 3. PDGFRβlocalizes primarily to the surrounding stroma in OSCC. A. PDGFRβstaining is absent in adjacent epithelium and hyperplasia samples, but is present in ulcer and OSCC specimens. Red arrows indicate blood vessels and green arrows indicate fibroblasts.B. Picrosirius red staining of collagen 1 and 3 fibers (left) and immunostaining of PDGFRβ(middle) and additional marker periostin (right) that were identified from the NN analysis.
PDGFRβexpression was detected on tumor cells. Note also the very close proximity of PDGFRβ-positive cells to carcinoma cells. An increased presence of the PDGFRβ-positive cells was also observed in ulcer (10/10) in the granulation tissue, which forms during the healing process. PDGFRβwas primarily expressed on fibroblasts, as well as cells surrounding capillar-ies and small blood vessels, and, occasionally, on dendritic cells. These observations are consis-tent with the notion that there are many similarities between inflammatory wounds such as ulcers and activated tumor stroma [5].
Since periostin (POSTN) was among the ECM genes that were closely associated with the collagens (rank = 18, Pearson r = 0.88) and PDGFRβin the TCGA analysis, we also examined its expression in OSCC specimens. POSTN was abundant in collagen-rich stromal regions identified using picrosirius red staining and its expression overlapped with that of PDGFRβ (Fig 3B).
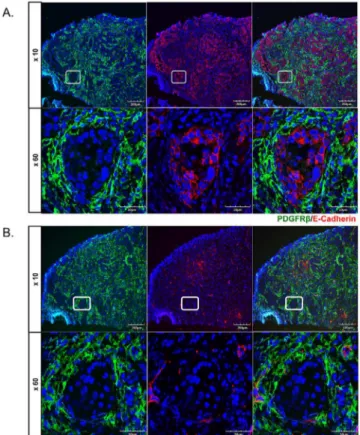
Given the close proximity of PDGFRβ-positive cells to carcinoma cells we wished to deter-mine whether carcinoma cells in the invasive tumor fronts also express PDGFRβ. Tumor speci-mens were double stained for PDGFRβand a representative marker of carcinoma cells, E-cadherin. As shown inFig 4Athere was no co-localization between these two markers. Because PDGFRβcan be expressed in pericytes, as well as fibroblasts we next examined co-localization of PDGFRβwith VE-cadherin, a marker of endothelial cells. VE-cadherin positive cells were primarily found in the stromal compartments in close proximity to PDGFRβpositive cells, which may represent pericytes (Fig 4B). There was no co-localization between these two markers.
Fig 4. PDGFRβdoes not co-localize with tumor cells and endothelium.Double immunofluorescence staining of PDGFRβ/E-Cadherin (A.), and PDGFRβ/VE-Cadherin (B.) on cryosections from oral tumor biopsies. Representative images are shown for four tumors.
AsαSMA [7] and podoplanin [15] were previously reported to be expressed in OSCC CAFs, these markers were considered in our analysis. Of note, neitherαSMA nor podoplanin showed as high a correlation with the average collagen gene expression in the TCGA analysis (Pearson r = 0.51 and 0.21 respectively). Expression ofαSMA in unaffected tongue tissues, hyperplasia and ulcer specimens was localized to pericytes/SMA cells around the blood vessels (S3 Fig). Furthermore, in contrast to the prevalent PDGFRβexpression,αSMA-positive CAFs were only found in a subset of OSCC specimens (3/11) (S3 Fig). It has been reported that αSMA is usually associated with moderately and poorly differentiated OSCC, but is infrequent in well differentiated tumors[16] and our results are consistent with this finding. Podoplanin was expressed primarily in lymphatic endothelial cells (S4 Fig). In OSCC, podoplanin was weakly expressed in a subset of CAFs (3/11) and overlapped with that ofαSMA (S4 Fig). Since PDGFRβandαSMA are also expressed in pericytes their increased expression during tumor progression may, in part, reflect tumor-induced angiogenesis.
PDGFR
β
is a potential CAF marker in multiple cancers
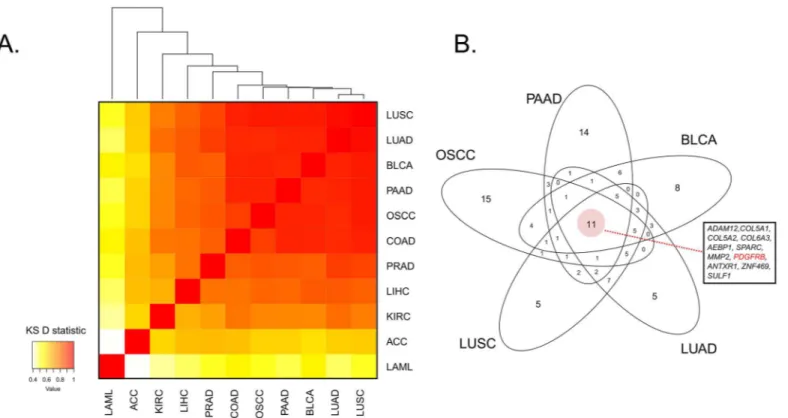
From our NN analysis within OSCC TCGA data, we considered other potential CAF markers, including PDGFRα, FSP1/S100A4, VIM, and FAP; however, none of these markers showed as close an association with the average collagen expression as PDGFRβ(S2 Table). To assess how closely related different cancer types are with respect to their collagen-associated expression signatures, we extended the described NN analysis to 10 additional TCGA cancer datasets (see Pan-cancer collagen NN enrichment analysis). These included nine carcinoma datasets, as well as a leukemia dataset (LAML) as a negative control of ECM behavior owing to its non-solid tis-sue origin. Clustering based on the similarity of their NN rankings with respect to average col-lagen expression as measured by a pairwise KS enrichment statistic yielded a clear segregation of cancer types, with most manifesting a high similarity in their list of collagen-correlated markers, and with LAML the only clear outlier, likely reflecting its non-solid origin (Fig 5A). Of note, the overlap between the top 50 genes of the five most closely related cancer types (OSCC, LUAD, LUSC, BLCA and PAAD,Fig 5A), yielded a set of 11 genes that included
PDGFRB(Fig 5B). Furthermore,PDGFRBwas consistently found to be within the top 50 hits of each NN ranked list for a total of eight out of the 11 cancer types (with the exceptions being KIRC, LAML and LIHC), with a mean genome-wide rank of 28.5. Its correlation with mean collagen expression was statistically significant (FDR0.05) in all tumor types but LAML (FDR = 0.089).
Discussion
A large study of several tumors, which did not include OSCC, systematically evaluated expression of PDGFRβas well as PDGFRαon fibroblasts and pericytes by immunohistochem-istry [18]. The data revealed a variable expression of these receptors in different tumors, with fibroblast expression of PDGFRβmost common in lung and colon tumors. Interestingly, stro-mal expression of PDGFRβin breast cancer correlated with poor prognosis [18]. It is important to note that in our study PDGFRβwas not expressed on carcinoma cells, however with the lim-ited number of specimens analyzed, we cannot exclude a possibility that PDGFRβmay be expressed in a subset of OSCCs, as has been shown for other cancers [19,20]. Relevant to our findings, previous studies demonstrated elevated expression of PDGF primarily in tumor cells in OSCC [21,22], suggesting a paracrine mechanism of fibroblast recruitment through a PDGF-PDGFRβaxis. Interestingly, many of the top-ranking ECM-specific genes in our analy-sis have previously been evaluated in OSCC and linked to tumor progression. Of particular interest are matricellular proteins, SPARC and POSTN. Elevated expression of both genes was documented in OSCC [23] and correlated with the presence of metastases [24,25]. Further-more, basal lamina components, NID2 and LAMA4 were previously investigated in OSCC [26,27]. Franz et al. reported that stromal expression of lamininα4 chain, which is undetectable in healthy and hyperplastic mucosa, gradually increased in tumor grades 1 to 3 [26]. On the other hand, increased hypermethylation of NID2 promoter was observed in OSCC samples, indicative of decreased gene expression [27]. However, expression of NID2 in the TCGA OSCC dataset was higher in tumor samples compared to adjacent normal epithelia with a Fig 5. Pan-cancer NN analysis highlights PDGFRβas a potential CAF marker in multiple cancer types A. Heatmap of average pairwise Kolmogorov-Smirnoff (KS) D statistics using the top 50 genes in the collagen NN cancer analysis of each of 11 cancer types.B. Venn diagram of top 50 genes in collagen NN ranked list within the five most closely related cancers (based on the average KS D statistic; Fig 5A). Core overlap has 11 genes, which includes PDGFRβ, highlighted in red. ACC: Adrenocortical carcinoma; BLCA: Bladder urothelial carcinoma; COAD: Colon adenocarcinoma; KIRC: Kidney renal clear cell carcinoma; LAML: Acute myeloid leukemia; LIHC: Liver hepatocellular carcinoma; LUAD: Lung adenocarcinoma; LUSC: Lung squamous cell carcinoma; PAAD: Pancreatic adenocarcinoma; PRAD: Prostate adenocarcinoma.
sustained elevated expression in tumor grades 1 to 3 (data not shown). It would be important to experimentally evaluate expression of NID2 mRNA and protein in OSCC specimens to clar-ify this inconsistency.
Matrix metalloproteinases are multifunctional proteins that are central to tumor progres-sion and metastasis [28]. MMP2 was the highest-ranking MMP gene whose expresprogres-sion was found to significantly correlate with the collagen genes in our NN analysis. Elevated expression of MMP2 was previously reported in OSCC and was associated with more invasive phenotype [29]. Another proteolytic family of enzymes related to MMPs is a disintegrin and metallopro-teinase (ADAM) multifunctional gene family, which also regulates cancer cell proliferation and progression [30]. In particular, ADAM12 is overexpressed in various pathological conditions, including adenocarcinoma and breast and bladder cancer, as well as several fibrotic diseases [31]. In OSCC, increased expression of ADAM12 mRNA and protein has been observed and correlated with primary tumor size and tumor stage [32]. Two other related family members ADAMTS12 and ADAMTS2 were also among the top ranking genes in our NN analysis. Inter-estingly, ADAMTS12 has been shown to have both pro- and anti-tumorigenic activities, while very little is still known about the role of ADAMTS2 in cancer [33]. To date, there are no reports on the expression of ADAMTS family members in OSCC. In addition to the genes dis-cussed, there were additional stromal genes identified by the NN analysis, includingCDH11,
OLML3,FSTL1,AEBP1,VCAN, previously reported to correlate with tumor progression and metastasis in various cancers [34–36]. Elevated expression of CDH11 mRNA has indeed been observed in OSCC [23].
The altered expression of stromal markers is consistently associated with poor prognosis. However, despite the increased interest in this field, the specific functional role of the stromal alterations in facilitating tumor progression is still poorly understood. A major limitation in studying CAF populationsin vivohas been the lack of robust fibroblast markers that are both fibroblast-specific, and expressed in all fibroblast populations [12]. Our study provides a novel, unbiased approach to select CAF markers with relevance to OSCC for further validation and mechanistic studies, with the ultimate goal of identifying novel therapeutic targets for OSCC.
Supporting Information
S1 Fig. Scatter plot of mean collagen expressionvs. tumor purity estimates derived using
the ABSOLUTE algorithm highlighting a moderate negative correlation (Pearson r = -0.32, p-value<0.0001).
(TIFF)
S2 Fig. Pairwise gene expression Pearson correlation of the top 50 hits from collagen NN analysis within (A.) tumor and (B.) control TCGA OSCC samples.AE: Adjacent normal epi-thelium.
(TIFF)
S3 Fig. Immunostaining highlighting localization of alpha smooth muscle actin (αSMA) in
adjacent normal oral epithelium (AE), hyperplasia, ulcer, and OSCC tongue specimens.
(TIFF)
S4 Fig. Immunostaining highlighting localization of podoplanin in adjacent normal oral epithelium (AE), hyperplasia, ulcer, and OSCC tongue specimens.
(TIFF)
epithelium (AE), CAL27 and HSC-3 cells.Fibroblast to cancer expression for each gene was calculated by averaging RF and AE, and CAL27 and HSC-3 values, respectively, normalizing the former value to 1. Genes are sorted in decreasing order of Fibroblast to cancer expression, with GAPDH used as an internal control. NA: Undetected.
(XLSX)
S2 Table. Collagen-based nearest neighbor analysis results in OSCC.Genes are ranked in decreasing order of their Pearson correlation with respect to the mean expression ofCOL1A1,
COL1A2andCOL3A1. FDRs indicate permutation-based significance estimates after multiple testing correction. The Gene_ID field represents both official HGNC gene symbols and Entrez gene IDs for each gene.
(XLSX)
S3 Table. Gene-set enrichment analysis (GSEA) result table highlighting gene-sets posi-tively enriched with respect to average collagen expression in OSCC.TCGA OSCC data was queried against canonical pathway genesets (c2.cp.v5.0) derived from the molecular signature database (MSigDb) using average collagen expression as a continuous ranking variable. (XLSX)
Acknowledgments
We would like to thank Michael Lawrence for providing us with ABSOLUTE tumor purity scores corresponding to the TCGA OSCC data, and Xaralabos Varelas and Ann Marie Egloff for carefully reviewing the manuscript. We would also like to acknowledge dbGap for granting access to the TCGA data (phs000178.v9.p8).
Author Contributions
Conceived and designed the experiments: SM MT MK VKK LS RH. Performed the experi-ments: LS RH PH. Analyzed the data: VKK LS PH GG VN SM MT. Contributed reagents/ materials/analysis tools: MT SM MK GG VN. Wrote the paper: VKK LS MK SM MT.
References
1. De Wever O, Van Bockstal M, Mareel M, Hendrix A, Bracke M. Carcinoma-associated fibroblasts pro-vide operational flexibility in metastasis. Seminars in Cancer Biology. 2014. pp. 33–46. doi:10.1016/j. semcancer.2013.12.009
2. Calon A, Tauriello DVF, Batlle E. TGF-beta in CAF-mediated tumor growth and metastasis. Seminars in Cancer Biology. 2014. pp. 15–22. doi:10.1016/j.semcancer.2013.12.008
3. Curry JM, Sprandio J, Cognetti D, Luginbuhl A, Bar-Ad V, Pribitkin E, et al. Tumor microenvironment in head and neck squamous cell carcinoma. Semin Oncol. 2014; 41: 217–234. doi:10.1053/j.seminoncol. 2014.03.003PMID:24787294
4. Routray S, Sunkavali A, Bari K. Carcinoma-associated fibroblasts, its implication in head and neck squamous cell carcinoma: a mini review. Oral Dis. 2013; doi:10.1111/odi.12107
5. Flier JS, Underhill LH, Dvorak HF. Tumors: Wounds That Do Not Heal. N Engl J Med. 1986; 315: 1650– 1659. doi:10.1056/NEJM198612253152606PMID:3537791
6. Barron DA, Rowley DR. The reactive stroma microenvironment and prostate cancer progression. Endo-crine-Related Cancer. 2012. doi:10.1530/ERC-12-0085
7. Marsh D, Suchak K, Moutasim KA, Vallath S, Hopper C, Jerjes W, et al. Stromal features are predictive of disease mortality in oral cancer patients. J Pathol. 2011; 223: 470–481. doi:10.1002/path.2830
PMID:21294121
8. Vered M, Dobriyan A, Dayan D, Yahalom R, Talmi YP, Bedrin L, et al. Tumor-host histopathologic vari-ables, stromal myofibroblasts and risk score, are significantly associated with recurrent disease in ton-gue cancer. Cancer Sci. 2010; 101: 274–280. doi:10.1111/j.1349-7006.2009.01357.xPMID:
9. Yoshihara K, Shahmoradgoli M, Martínez E, Vegesna R, Kim H, Torres-Garcia W, et al. Inferring tumour purity and stromal and immune cell admixture from expression data. Nat Commun. 2013; 4: 2612. doi:10.1038/ncomms3612PMID:24113773
10. Carter SL, Cibulskis K, Helman E, McKenna A, Shen H, Zack T, et al. Absolute quantification of somatic DNA alterations in human cancer. Nat Biotechnol. Nature Publishing Group; 2012; 30: 413–421. doi:
10.1038/nbt.2203
11. Koebnick C, Smith N, Black MH, Porter AH, Richie B, Hudson S, et al. Decreased Lymphangiogenesis and Lymph Node Metastasis by mTOR Inhibition in Head and Neck Cancer. 2013; 55: 328–333. 12. Kalluri R, Zeisberg M. Fibroblasts in cancer. Nat Rev Cancer. 2006; 6: 392–401. doi:10.1038/nrc1877
PMID:16572188
13. Karagiannis GS, Poutahidis T, Erdman SE, Kirsch R, Riddell RH, Diamandis EP. Cancer-associated fibroblasts drive the progression of metastasis through both paracrine and mechanical pressure on can-cer tissue. Mol Cancan-cer Res. 2012; 10: 1403–18. doi:10.1158/1541-7786.MCR-12-0307PMID:
23024188
14. Sweeney SM, Orgel JP, Fertala A, McAuliffe JD, Turner KR, Di Lullo GA, et al. Candidate cell and matrix interaction domains on the collagen fibril, the predominant protein of vertebrates. J Biol Chem. 2008; 283: 21187–21197. doi:10.1074/jbc.M709319200PMID:18487200
15. Inoue H, Tsuchiya H, Miyazaki Y, Kikuchi K, Ide F, Sakashita H, et al. Podoplanin expressing cancer-associated fibroblasts in oral cancer. Tumor Biol. 2014; 35: 11345–11352. doi: 10.1007/s13277-014-2450-7
16. Rodrigues P, Da Costa Miguel M, De Aquino S, Fonseca F, Dos Santos Silva A, Paes Leme A, et al. Stromal myofibroblasts in potentially malignant and malignant lesions of the oral cavity. Oncol Lett. 2014; 667–670. doi:10.3892/ol.2014.2763
17. Tommelein J, Verset L, Boterberg T, Demetter P, Bracke M, De Wever O. Cancer-associated fibro-blasts connect metastasis-promoting communication in colorectal cancer. Front Oncol. 2015; 5: 63. doi:10.3389/fonc.2015.00063PMID:25853091
18. Paulsson J, Sjöblom T, Micke P, Pontén F, Landberg G, Heldin C-H, et al. Prognostic significance of stromal platelet-derived growth factor beta-receptor expression in human breast cancer. Am J Pathol. 2009; 175: 334–341. doi:10.2353/ajpath.2009.081030PMID:19498003
19. Heldin C-H. Targeting the PDGF signaling pathway in tumor treatment. Cell Commun Signal. 2013; 11: 97. doi:10.1186/1478-811X-11-97PMID:24359404
20. Jechlinger M, Sommer A, Moriggl R, Seither P, Kraut N, Capodiecci P, et al. Autocrine PDGFR signal-ing promotes mammary cancer metastasis. J Clin Invest. 2006; 116: 1561–1570. doi:10.1172/ JCI24652PMID:16741576
21. Li C, Shintani S, Terakado N, Klosek SK, Ishikawa T, Nakashiro K, et al. Microvessel density and expression of vascular endothelial growth factor, basic fibroblast growth factor, and platelet-derived endothelial growth factor in oral squamous cell carcinomas. Int J Oral Maxillofac Surg. 2005; 34: 559– 565. doi:10.1016/j.ijom.2004.10.016PMID:16053878
22. Sasahira T, Kirita T, Yamamoto K, Ueda N, Kurihara M, Matsushima S, et al. Transport and Golgi orga-nisation protein 1 is a novel tumour progressive factor in oral squamous cell carcinoma. Eur J Cancer. 2014; 50: 2142–2151. doi:10.1016/j.ejca.2014.05.006PMID:24889917
23. Choi P, Jordan CD, Mendez E, Houck J, Yueh B, Farwell DG, et al. Examination of oral cancer biomark-ers by tissue microarray analysis. Arch Otolaryngol Head Neck Surg. 2008; 134: 539–546. doi:10. 1001/archotol.134.5.539PMID:18490578
24. Aquino G, Sabatino R, Cantile M, Aversa C, Ionna F, Botti G, et al. Expression analysis of SPARC/ osteonectin in oral squamous cell carcinoma patients: From saliva to surgical specimen. Biomed Res Int. 2013; 2013. doi:10.1155/2013/736438
25. Siriwardena BSMS, Kudo Y, Ogawa I, Kitagawa M, Kitajima S, Hatano H, et al. Periostin is frequently overexpressed and enhances invasion and angiogenesis in oral cancer. Br J Cancer. 2006; 95: 1396– 403. doi:10.1038/sj.bjc.6603431PMID:17060937
26. Franz M, Wolheim A, Richter P, Umbreit C, Dahse R, Driemel O, et al. Stromal laminin chain distribution in normal, hyperplastic and malignant oral mucosa: Relation to myofibroblast occurrence and vessel formation. J Oral Pathol Med. 2010; 39: 290–298. doi:10.1111/j.1600-0714.2009.00840.xPMID:
19889153
27. Guerrero-Preston R, Soudry E, Acero J, Orera M, Moreno-Lopez L, Macia-Colon G, et al. NID2 and HOXA9 promoter hypermethylation as biomarkers for prevention and early detection in oral cavity squampus cell carcinoma tissue and saliva. Cancer Prev Res. 2012; 4: 1061–1072.
29. Jafarian AH, Mostaan LV, Roshan NM, Khazaeni K, Parsazad S, Gilan H. Relationship between the Expression of Matrix Metalloproteinase and Clinicopathologic Features in Oral Squamous Cell Carci-noma. Iran J Otorhinolaryngol. 2015; 27.
30. Mochizuki S, Okada Y. ADAMs in cancer cell proliferation and progression. Cancer Science. 2007. pp. 621–628. doi:10.1111/j.1349-7006.2007.00434.xPMID:17355265
31. Nyren-Erickson EK, Jones JM, Srivastava DK, Mallik S. A disintegrin and metalloproteinase-12 (ADAM12): Function, roles in disease progression, and clinical implications. Biochim Biophys Acta— Gen Subj. Elsevier B.V.; 2013; 1830: 4445–4455. doi:10.1016/j.bbagen.2013.05.011
32. Uehara E, Shiiba M, Shinozuka K, Saito K, Kouzu Y, Koike H, et al. Upregulated expression of ADAM12 is associated with progression of oral squamous cell carcinoma. Int J Oncol. 2012; 40: 1414– 1422. doi:10.3892/ijo.2012.1339PMID:22267082
33. Kelwick R, Desanlis I, Wheeler GN, Edwards DR. The ADAMTS (A Disintegrin and Metalloproteinase with Thrombospondin motifs) family. Genome Biol. 2015; 16: 113. doi:10.1186/s13059-015-0676-3
PMID:26025392
34. Cheon DJ, Tong Y, Sim MS, Dering J, Berel D, Cui X, et al. A collagen-remodeling gene signature regu-lated by TGF-?? signaling is associated with metastasis and poor survival in serous ovarian cancer. Clin Cancer Res. 2014; 20: 711–723. doi:10.1158/1078-0432.CCR-13-1256PMID:24218511
35. Torres S, Bartolomé RA, Mendes M, Barderas R, Fernandez-Aceñero MJ, Peláez-García A, et al. Pro-teome profiling of cancer-associated fibroblasts identifies novel proinflammatory signatures and prog-nostic markers for colorectal cancer. Clin Cancer Res. 2013; 19: 6006–6019. doi:10.1158/1078-0432. CCR-13-1130PMID:24025712