www.earth-surf-dynam.net/4/175/2016/ doi:10.5194/esurf-4-175-2016
© Author(s) 2016. CC Attribution 3.0 License.
Adaptive cycles of floodplain vegetation response to
flooding and drying
R. Thapa, M. C. Thoms, M. Parsons, and M. Reid
Riverine Landscapes Research Laboratory, Geography and Planning, University of New England, NSW, 2351, Australia
Correspondence to:R. Thapa ([email protected])
Received: 17 July 2015 – Published in Earth Surf. Dynam. Discuss.: 2 September 2015 Revised: 7 December 2015 – Accepted: 2 January 2016 – Published: 3 February 2016
Abstract. Flooding is a key driver of floodplain vegetation productivity. Adaptive cycles provide a model for
ex-amining the productivity of semi-arid floodplain vegetation in response to hydrology. We examined the response of vegetation productivity (measured as NDVI) through a hypothesised adaptive cycle to determine whether the cycle repeats over time and how it is affected by differently sized flood events. The area of floodplain inundation was associated with an adaptive cycle that repeated in four flood events through the following phases: wetting (exploitation phase), wet (conservation phase), drying (release phase) and dry (reorganisation phase). Vegetation productivity responses corresponded to these phases. The area and quality of floodplain vegetation productivity followed the hypothesised pattern of higher-quality vegetation vigour in the wetting and wet phases, lower vigour in the drying phase and lowest vigour in the dry phase. There were more transitions between NDVI classes in the wet phase, which was dominated by two-way transitions. Overall, the wetting, wet and drying phases were dominated by smaller-probability class changes, whereas in the dry phase, higher-probability class changes were more prominent. Although the four flood events exhibited an adaptive cycle the duration of the adaptive-cycle phases, and the nature of vegetation productivity response, differed with the character of the flood event. Vegeta-tion response in two of the adaptive-cycle phases – the release and reorganisaVegeta-tion phases – were as hypothesised, but in the exploitation and conservation phases, changes in vegetation productivity were more dynamic. The character of vegetation response through the adaptive cycle also indicates that semi-arid floodplain vegetation productivity is more vulnerable to changing state during the conservation and release phases and not during the exploitation and reorganisation phases as resilience theory suggests. Overall, the adaptive cycle represents a new model to improve our understanding of the complexity of change in semi-arid floodplain vegetation productivity through cycles of flooding and drying. Changes in vegetation productivity could initiate structural changes in floodplain vegetation communities, with commensurate influences on floodplain sediment dynamics.
1 Introduction
Floodplains are dynamic features of the riverine landscape driven by exchanges of water and sediment mediated by the presence of vegetation (Hupp, 2000; Naiman et al., 2010). This occurs on multiple temporal and spatial scales (Dol-lar et al., 2007). Feedbacks that occur between water, sed-iment and vegetation on the floodplain surface are indica-tive of complex adapindica-tive systems, which are characterised by multiple stable states, nonlinear dynamics, fast and slow drivers and self-emergence (Holling, 1973; Holling and
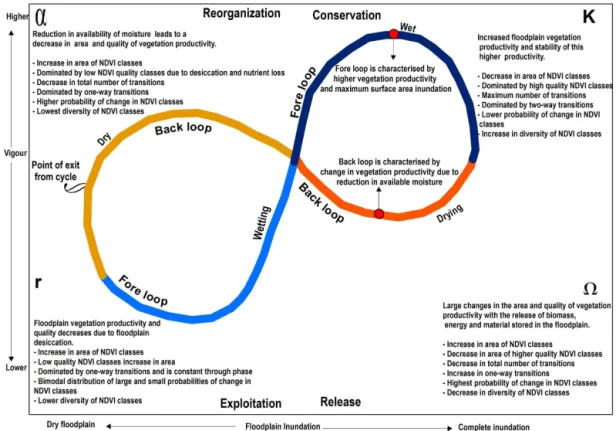
sys-Figure 1.The hypothesised adaptive-cycle model of vegetation productivity response to hydrology in semi-arid floodplains. The adaptive cycle starts as floodwater inundates the floodplain in the wetting phase (exploitation). The wet phase (conservation) is a period of maximum inundation, the drying phase (release) begins with the contraction of floodwaters, and the dry phase (reorganisation) occurs with the desic-cation of the floodplain. The adaptive cycle reflects changes in two properties: (i) floodplain connectedness, which ranges from a totally dry
to complete inundation of the floodplain along thexaxis, and (ii) vegetation productivity, ranging from low to high vegetation vigour along
theyaxis. Exit from the cycle occurs within left quadrant of the figure and represents the stage where there is potential for a change in state or a flip to a new state. Figure taken from Thapa et al. (2016).
tem dynamics (Holling and Gunderson, 2002). The exploita-tion phase (r phase) occurs early in the adaptive cycle and follows a previous disturbance. In this phase, elements of the system are engaged in rapid growth to exploit available re-sources (Walker and Salt, 2006). Through the conservation phase (K phase), biomass gradually builds up and energy and materials accumulate in the system (Holling and Gun-derson, 2002). The release phase (phase) is triggered by internal or external disturbances (Holling and Gunderson, 2002). In the release phase, biomass, energy and materials stored in the system are released, becoming available as the template for the reorganisation phase. In the reorganisation phase (αphase), the system reorganises into the same state or may become vulnerable to flipping into a new state, which is likely to be organised differently and to be less productive (Holling and Gunderson, 2002). If the system does not flip into a new state, it moves back into the exploitation phase where a new cycle begins.
Semi-arid floodplains are ecosystems characterised by long periods of no or limited surface water interspersed by periods of floodplain inundation (Thoms, 2003). Flooding is a primary driver of floodplain productivity that can stimulate
a rapid increase in vegetation productivity that may be main-tained for months across large areas of floodplain (Capon, 2003; Reid et al., 2011; Parsons and Thoms, 2013). The productivity of floodplain vegetation in response to flood-ing has been hypothesised to be more complex than a simple boom–bust model and follow an adaptive cycle of exploita-tion, conservaexploita-tion, release and reorganisation (Thapa et al., 2016). There are two interacting elements of this hypothe-sised floodplain adaptive cycle (Fig. 1). The first describes the progression of flooding as the key driver of floodplain vegetation productivity through the adaptive cycle. The sec-ond describes the progression of vegetation productivity re-sponse to the driver through the phases of the adaptive cy-cle. Thus, the adaptive-cycle hypothesis proposes that flood-plain ecosystem change is characterized by the relationship between the availability of floodplain surface water and veg-etation productivity.
is a period of enhanced vegetation productivity (Fig. 1). With maximum inundation, vegetation productivity is expected to decrease in total area but be higher in quality and stable in these aspects across the floodplain (Fig. 1). During the dry-ing phase (release), surface water inundation contracts and the floodplain begins to dry (Fig. 1). Vegetation productiv-ity is expected to not only decrease in area and qualproductiv-ity in this phase but also have a higher probability of change in the area and quality of vegetation productivity because of the release of biomass, energy and material stored in the flood-plain (Fig. 1). As the floodflood-plain surface dries further, veg-etation productivity moves into the dry phase (reorganisa-tion), with vegetation productivity expected to decline even further in area and quality (Fig. 1). Some vegetation commu-nities with access to remaining moisture may thrive in this phase; however, as the floodplain becomes desiccated during the dry phase, floodplain vegetation productivity is expected to be lower in area and quality and unstable. The highest likelihood of change to a new state should occur during the movement from the reorganisation to the exploitation phase (Holling and Gunderson, 2002). In the dry phase, floodplain vegetation may reorganise itself into the same state ready to begin a new cycle when flooding occurs or exit the cycle to flip into a different state (Fig. 1). Overall, the fore loop of the adaptive cycle (exploitation to conservation) is charac-terised by higher vegetation productivity and the back loop (release to reorganisation) is characterised by greater change in vegetation productivity because of the release of biomass and energy stored in the floodplain. In moving between the phases of the adaptive cycle the area of floodplain inundated varies from low to high (Fig. 1,x axis), which corresponds to the connectedness of the system through an adaptive cy-cle. Vigour varies from low to high (Fig. 1, y axis), which relates to the potential of the system through an adaptive cy-cle. Systems with low potential and low connectedness will have higher resilience and vice versa (Holling and Gunder-son, 2002).
The hypothesis proposed by Thapa et al. (2016) is de-rived from observations of floodplain vegetation productiv-ity through only one cycle of flooding and drying. However, unanswered questions remain about the efficacy of adaptive cycles for characterising floodplain vegetation productivity in response to different flooding and drying events. Floods, and therefore the character of floodplain inundation, differ in magnitude, timing, duration and spatial pattern (Murray et al., 2006; Thoms and Parsons, 2011). As these factors in-fluence vegetation productivity responses (Capon, 2003; Par-sons and Thoms, 2013), the passage of vegetation productiv-ity around an adaptive cycle in response to flooding and dry-ing might not occur in all floods, makdry-ing the application of adaptive cycles untenable. This study examines adaptive cy-cles of floodplain vegetation in response to four flood events to determine whether an adaptive cycle repeats and how it is influenced by different-sized flood events.
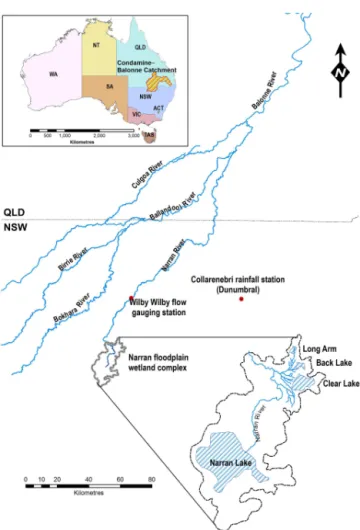
Figure 2.The Narran floodplain within the lower reaches of the Condamine–Balonne catchment, Australia.
1.1 Study area
The Narran floodplain is located in the Condamine–Balonne catchment, within the northern region of the Murray–Darling Basin, Australia (Fig. 2). The Condamine–Balonne River originates in well-watered uplands of the south-east Queens-land highQueens-lands but flows for most part across a dry Queens- land-scape (Thoms and Sheldon, 2000). The river has a sin-gle channel for most of its length but bifurcates into five anabranching channels downstream of St. George, known lo-cally as the Lower Balonne (Fig. 2). These channels have relatively low gradients (0.0002 to 0.0003), are highly sin-uous (1.9 to 2.5) and the bankfull cross-sectional area of each decreases with distance downstream (Thoms, 2003). The Narran River, which flows along the eastern boundary of the Lower Balonne, terminates within the Narran floodplain (Fig. 2).
is not inundated as a result of local rainfall but from flows in the Narran River (Rayburg and Thoms, 2009). Local rainfall is highly variable, with annual rainfall ranging from 144 mm (2002) to 957 mm (1950) at Collarenebri, and occurs mainly in the summer months (November–February) associated with tropical monsoonal activity. With a mean annual evaporation of 2250 mm the Narran floodplain landscape is dry most of the time. The Narran floodplain is geomorphologically com-plex with numerous lakes, channel networks and dissected floodplain surfaces (Rayburg and Thoms, 2009).
The long-term (1965–2009) mean annual discharge of the Narran River at Wilby Wilby (Gauge 422016) is 128 717 ML, ranging from 1003 to 690 000 ML. Flows ex-ceeding 13 000 ML day−1 (MLD) at Wilby Wilby result in overbank flows and inundation of the Narran floodplain (Rayburg and Thoms, 2009). These flows have an average recurrence interval of 1.5 years. The highly variable nature of flow in the Narran River results in infrequent periods of floodplain inundation (Murray et al., 2006). Inundation of the Narran floodplain is also spatially complex irrespective of the size of the flood event, with the expansion and con-traction of floodwaters across the floodplain resulting in a dynamic mosaic of inundated patches (Murray et al., 2006). The relationship between floodplain inundated area and the number of inundated wet patches displays an anticlockwise hysteresis; therefore, significant fragmentation of floodwa-ters occurs during the contraction of floodwafloodwa-ters on the Nar-ran floodplain (Murray et al., 2006).
The four main lakes of the Narran floodplain – Clear Lake, Back Lake, Long Arm and Narran Lake – (Fig. 2) hold water for different periods of time. Narran Lake (51.95 km2) has a capacity of 122 500 ML and retains water for up to 12– 15 months following a flood event but is dry 60 % of the time (Rayburg and Thoms, 2009). Clear Lake (5.86 km2), Back Lake (0.97 km2) and Long Arm (0.72 km2) have a combined capacity of 17 500 ML and retain water for 4–12 months (Thoms et al., 2007). The northern part of the flood-plain fills in sequence through Clear Lake, Back Lake, Long Arm (Fig. 2) and Narran Lake from flow in the Narran River (Rayburg and Thoms, 2009). The wetting and drying of the Narran floodplain has been severely impacted by water re-source development in the upper catchment. Water extrac-tion has reduced the median annual flow in the Narran River by approximately 30 % (Thoms, 2003), significantly reduc-ing moderate-sized floods on the Narran floodplain (Thoms et al., 2007).
Vegetation on the Narran floodplain is dominated by the perennial shrub lignum (Duma florulenta). Lignum shrub-land is mostly found in the northern and central part of the floodplain along the Narran River. There is an over-storey of riparian woodland along main watercourses com-prising river red gum (Eucalyptus camaldulensis), coolibah (Eucalyptus coolabah) and black box (Eucalyptus largiflo-rens). Other woodland species found in the Narran flood-plain include poplar box (Eucalyptus populnea), belah
(Ca-suarina cristata), gidgee (Acacia calcicola), wilga (Gei-jera parviflora), black box (Eucalyptus largiflorens) and whitewood (Atalaya hemiglauca). Lignum shrubland and woodland communities cover approximately 151 km2(51 %) of the Narran floodplain. Grassland covers approximately 42 km2(14 %) and consists of Mitchell grass (Astreblaspp.), neverfail (Eragrostis setifolia) and box grass (Paspalidium constrictum) interspersed among clumps of trees and shrubs. Crops and pastures cover 48 km2(16 %), and the remaining 55 km2(19 %) is lake area and barren ground.
2 Methods
2.1 Satellite image selection
Remotely sensed satellite images were used to track the pro-ductivity of vegetation through periods of flooding and dry-ing in the Narran floodplain. A three-step process was used to obtain satellite images for the analysis of vegetation pro-ductivity. First, the conditions of dry and flood periods were defined. A dry period is a period of no flow or flow below the long-term 95th percentile flow, combined with below av-erage rainfall. In a dry period there is no moisture subsidy to the floodplain through flooding or rainfall. Although ground-water can be an important source of moisture for floodplain vegetation in some contexts (Horner et al., 2009), groundwa-ter in the Narran floodplain is approximately 100 m below the floodplain surface (Fitzpatrick et al., 2005). The flood period was defined as flow above 13 000 MLD in the Narran River (Wilby Wilby), i.e. the flow required to initiate floodplain in-undation (Thapa et al., 2016).
Second, discharge and rainfall records were searched for conditions matching the definition of dry and flood periods. Daily Narran River flow data (January 1980–December 2009 at Wilby Wilby) were acquired from the NSW Department of Primary Industries. Daily rainfall data for the same pe-riod were obtained from the Australian Bureau of Meteorol-ogy (Station 048038 at Collarenebri). Monthly discharge and rainfall means were calculated and each month in the record was delineated as being above or below average or as having no flow or rainfall. Periods fitting the definitions of flood and dry were identified in the discharge and rainfall record.
period image sequence stopped when floodwater completely contracted and dry images started. The 75 dry and flood im-ages were rearranged into four events. The details of imim-ages in each event are provided in Table 1.
Images were cropped to a standard floodplain area de-noted by the boundary of floodplain soils (Rayburg et al., 2006). Images were resampled to 25 m resolution and re-projected to the Geodetic Datum of Australia 1994 Uni-versal Transverse Mercator zone 55S, to ensure compatibil-ity of images from different sources (i.e. from ACRES and USGS). The aligned image digital numbers were converted to top-of-atmosphere reflectance using the methods of Chan-der et al. (2009). A relative radiometric normalisation was performed using dark and light targets to make images ac-quired on different dates comparable (Myeong et al., 2006).
2.2 Delineation of adaptive phases
The flood period images were processed in ERDAS imagine software to delineate the expansion and contraction of flood waters across the floodplain. To map inundation extent, den-sity slicing was used to identify inundated (water) and non-inundated (non-water) pixels and their threshold reflectance values, as recommended by Overton (2005). In some im-ages, detecting inundated pixels was not possible using a single band because of the presence of a dense vegetation canopy. For those images, the normalised difference water index (Xu, 2006) and unsupervised classification were used to differentiate between inundated and non-inundated pixels. These methods have been successfully used to map inunda-tion across Australian floodplains using Landsat satellite im-agery (Frazier and Page, 2000; Shaikh et al., 2001; Rayburg and Thoms, 2009; Thomas et al., 2010). The results from both methods were combined to estimate the area of flood-plain inundation.
Phases of the adaptive cycle were delineated from the area of floodplain inundation. The wetting phase is an ini-tial rapid expansion of floodwater across the floodplain. The wet phase is a period of maximum inundation. The drying phase is associated with the contraction of floodwaters and the dry phase is associated with no surface water availabil-ity. Differences in the area of floodplain inundation among the adaptive phases were examined for each event using non-parametric Kruskal–Wallis one-way analysis of variance on ranks in SigmaPlot (Version 12). Differences in the area of floodplain inundation among the four events were also ex-amined using this test.
2.3 Calculation of the normalised difference vegetation index
The normalised difference vegetation index (NDVI) is based on the red and near-infrared (NIR) band reflectance prop-erties and is strongly correlated with photosynthetic activ-ity. Hence, NDVI is a surrogate for vegetation productivity
(Lillesand and Kiefer, 2000; Farina, 2006; Wen et al., 2012). The normalised difference vegetation index was calculated in each image as NDVI=ρNIR−ρred/ρNIR+ρred, where ρ represents the spectral reflectance values of spectral bands NIR (band 4) and red (band 3) of Landsat The-matic Mapper (TM) and Enhanced TheThe-matic Mapper Plus (ETM+) images. Entropy analysis and moving window anal-ysis were used to divide the NDVI values of all 473 142 pixels into classes, following the method of Parsons and Thoms (2013). Six NDVI classes emerged. Class 1 is no greenness (NDVI < 0). Class 2 (NDVI 0–0.072), Class 3 (NDVI 0.072–0.207), Class 4 (NDVI 0.207–0.459), Class 5 (NDVI 0.459–0.666) and Class 6 (NDVI > 0.666) represent a continuum of increasing vegetation productivity.
2.4 Analysis of vegetation productivity among adaptive-cycle phases
Each image was allocated to the corresponding wetting, wet, drying or dry phase of the adaptive cycle. Four broad types of NDVI data were used to explore vegetation productivity through the dry, wetting, wet and drying phases: area and quality of NDVI; number and direction of NDVI class transi-tions; probability of NDVI class transitransi-tions; and NDVI class diversity. The area of floodplain with active vegetation pro-ductivity (total area of NDVI Classes 2–6) was calculated for each image. Quality of vegetation productivity was cal-culated as the area of individual NDVI classes in each image, where low-quality productivity is NDVI Class 2 and 3 (low greenness) and high-quality productivity is NDVI Classes 4, 5 or 6 (higher greenness). NDVI Class 1 was excluded be-cause this class has no greenness and corresponds to water bodies and barren ground.
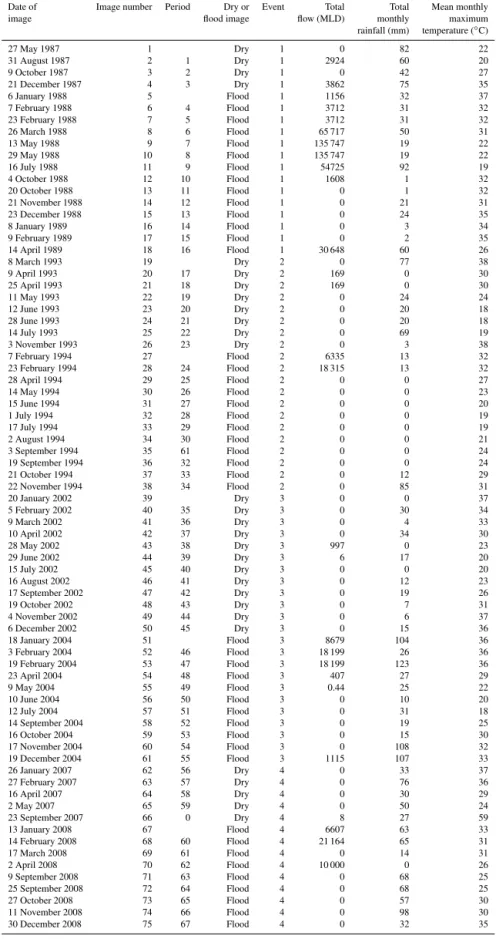
Table 1.Satellite images for the four events, with corresponding hydrology, rainfall and temperature conditions. A period refers to the comparison of two images, where the comparison of image 1 and 2 becomes Period 1. Hydrology data were obtained from the Department of Primary Industries (NSW) Office of Water Information, and climatic data were acquired from the Australian Bureau of Meteorology.
Date of Image number Period Dry or Event Total Total Mean monthly image flood image flow (MLD) monthly maximum rainfall (mm) temperature (◦
0 20 40 60 80 100 120
1 2 3 4 5 6 7 8 9 10 11 12 13 14 15 16 17 18 19 20 21 22 23 24 25 26 27 28 29 30 31 32 33 34 35 36 37 38 39 40 41 42 43 44 45 46 47 48 49 50 51 52 53 54 55 56 57 58 59 60 61 62 63 64 65 66 67 68 69 70 71 72 73 74 75
A
re
a
of
F
lo
od
pl
ai
n
In
und
at
io
n
(k
m
2)
Image number Dry Wetting Wet Drying
(a)
Dry Wetting Wet Drying Dry Wetting Wet Drying
Dry Wetting Wet Drying
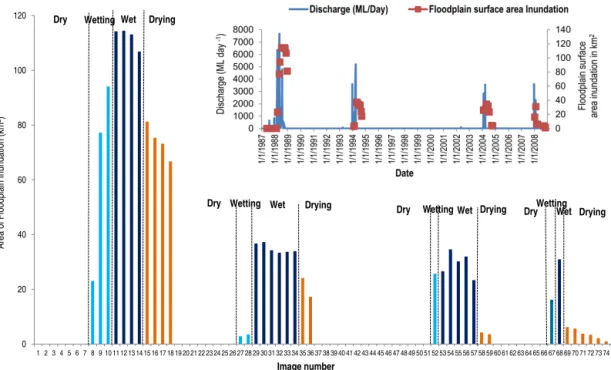
Figure 3.Surface area inundation of the Narran floodplain divided into corresponding dry, wetting, wet and drying phases of the adaptive
cycle(a). Image numbers are explained in Table 1. Inset graph(b)shows the total discharge (ML) in the Narran River and the corresponding
Narran floodplain surface area inundation.
image was also calculated using the Shannon–Wiener diver-sity index (Magurran, 1988). Monthly images are considered to be samples, NDVI classes species, and NDVI area abun-dance.
Differences in the total area of NDVI, area of each NDVI class, total transitions, one-way transitions, two-way transi-tions, probability of transitions and diversity among adap-tive phases were examined separately using a non-parametric Kruskal–Wallis one-way analysis of variance on ranks in SigmaPlot (Version 12). The same test was also used to examine differences in these variables among flood events. The H statistic is a measure of the actual difference in the sum of the ranking between samples. Multivariate analyses were used to examine differences among adaptive phases,
using PRIMER_E and PERMANOVA+. Three types of data
(area and quality, number and direction of transitions, prob-ability of transitions) were analysed separately, but the four events were combined. Multi-dimensional scaling was per-formed using the Bray–Curtis similarity coefficient. The rel-ative dispersion of images within an adaptive phase was ex-amined using the multi-variate dispersion (MVDSP) rou-tine (Warwick and Clarke, 1993), where lower values indi-cate similarity of images from the same adaptive phase in multivariate space. The relative dispersion among adaptive phases was examined using the distance among centroid rou-tines in PERMANOVA+, which calculates distances among group centroids (Anderson et al., 2008). Lower values in-dicate closer centroids and, hence, greater similarity among adaptive phases.
3 Results
3.1 Floodplain inundation and adaptive-cycle phases
The area of floodplain inundation corresponds to the dry, wetting, wet and drying phases of an adaptive cycle. The adaptive cycle commences with an initial rapid expansion of floodwaters across the floodplain in the wetting phase (Fig. 3a). The wetting phase is followed by the wet phase, during which inundation is at its maximum extent, remain-ing relatively stable within the phase (Fig. 3a). The wet phase is followed by the drying phase, during which the area of inundated floodplain contracts (Fig. 3a). The dry phase follows the drying of the floodplain and remains in place until a flow event starts the next wetting phase. Dur-ing the dry phase, surface water is absent from the flood-plain (Fig. 3a). There was a significant difference in the area of floodplain inundation among the wetting, wet, drying and dry phases in each event (Event 1:H=15.793,p=0.001; Event 2: H=16.309, p=< 0.001; Event 3: H=19.480, p=< 0.001; Event 4:H=12.005,p=0.007). Thus, the di-visions among phases are repeated across the four events.
0 50 100 150 200 250 300
1 2 3 4 5 6 7 8 9 101112131415161718192021222324252627282930313233343536373839404142434445464748495051525354555657585960616263646566676869707172737475
A
re
a
(k
m
2)
Image Number
NDVI 2 NDVI 3 NDVI 4 NDVI 5 NDVI 6
Dry Wetting Wet Drying Dry Wetting Wet Drying Dry Wetting Wet Drying Dry Wetting
Wet Drying
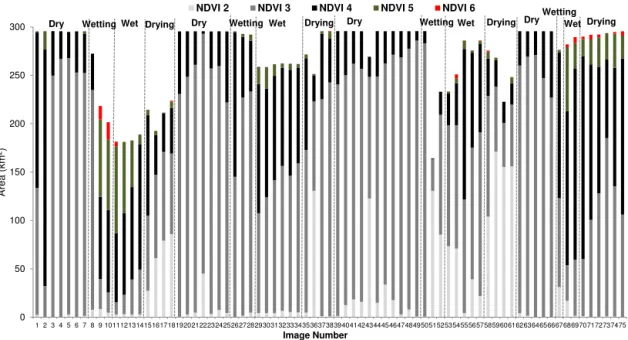
Figure 4.Area of NDVI Class 2 through to 6 in the Narran floodplain during the dry, wetting, wet and drying phases of the adaptive cycle. NDVI Class 1 is not shown because it represents bare ground or water. Image numbers are explained in Table 1.
approximately 2 months and a long wet phase of 6 months (Fig. 3a). Event 4 was very different from the other events and was characterised by a short wetting and wet phase of 1 month and an extended drying phase of over 6 months (Fig. 3a). There was a significant difference in inundated area among the four flood events (H=8.507, p=0.037), related to flow in the Narran River. The largest area of flood-plain inundation occurred in Event 1 (114 km2) and was as-sociated with inflows that peaked at 135 747 MLD in May 1988 (Fig. 3a and b). The second-largest floodplain inun-dation of 37 km2 occurred in Event 2 and was associated with a peak flow of 88 974 MLD in March 1994. Flood-plain inundation in Event 3 and Event 4 was associated with flows of 21 307 MLD and 21 164 MLD, resulting in inunda-tion of 34 km2and 31 km2respectively (Fig. 3a and b). Over-all, these differences largely reflect the hydrograph for each event, where larger floods are associated with some phases having a longer duration (Fig. 3b). Despite differences in the area of floodplain inundation between events and the length of the wetting, wet and drying phases, there is always a wet-ting, wet, drying and dry phase. Thus, vegetation productiv-ity can be further examined in relation to the adaptive-cycle phases of floodplain inundation.
3.2 Area and quality of vegetation productivity through the adaptive-cycle phases
The total area of NDVI followed the hypothesised pattern (Fig. 1) of an increase in the dry and drying phases and de-crease in the wetting and wet phases. In most events there was a significant difference in the total area of NDVI among the dry, wetting, wet and drying phases of the adaptive cycle
(Table 2). The total area of NDVI was always higher in the dry phase than the other phases (Fig. 4). Across all events the mean area of NDVI in the dry phase was 288 km2(range: 164 to 296 km2). For comparison, the mean area of NDVI in the wetting phase was 255 km2(range: 202 to 293 km2), the wet phase was 246 km2 (range: 181 to 286 km2) and the drying phase was 268 km2(range: 193 to 296 km2).
As hypothesised in the adaptive-cycle model (Fig. 1) the highest-quality NDVI (Class 6) occurred mostly in the wet-ting and wet adaptive phases (Fig. 4). NDVI Class 6 did not occur in any dry phase across the four events (Fig. 4) as hy-pothesised. In contrast to the model, higher-quality NDVI did occur in the drying phase of Events 1 and 4, although the area of NDVI Class 6 was relatively low (Fig. 4). This was pre-sumably because of additional water being available in both events: through the large magnitude of inflow in Event 1 and the contribution of managed environmental water in Event 4 (Table 1).
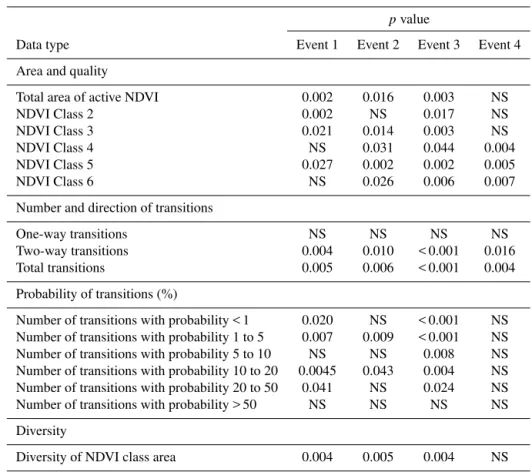
Table 2.Differences in NDVI class area and quality, number and direction of NDVI class transitions, probability of NDVI class transitions, and NDVI class diversity among adaptive-cycle phases of four events. NS: not significant (p> 0.05).
pvalue
Data type Event 1 Event 2 Event 3 Event 4
Area and quality
Total area of active NDVI 0.002 0.016 0.003 NS
NDVI Class 2 0.002 NS 0.017 NS
NDVI Class 3 0.021 0.014 0.003 NS
NDVI Class 4 NS 0.031 0.044 0.004
NDVI Class 5 0.027 0.002 0.002 0.005
NDVI Class 6 NS 0.026 0.006 0.007
Number and direction of transitions
One-way transitions NS NS NS NS
Two-way transitions 0.004 0.010 < 0.001 0.016
Total transitions 0.005 0.006 < 0.001 0.004
Probability of transitions (%)
Number of transitions with probability < 1 0.020 NS < 0.001 NS
Number of transitions with probability 1 to 5 0.007 0.009 < 0.001 NS
Number of transitions with probability 5 to 10 NS NS 0.008 NS
Number of transitions with probability 10 to 20 0.0045 0.043 0.004 NS
Number of transitions with probability 20 to 50 0.041 NS 0.024 NS
Number of transitions with probability > 50 NS NS NS NS
Diversity
Diversity of NDVI class area 0.004 0.005 0.004 NS
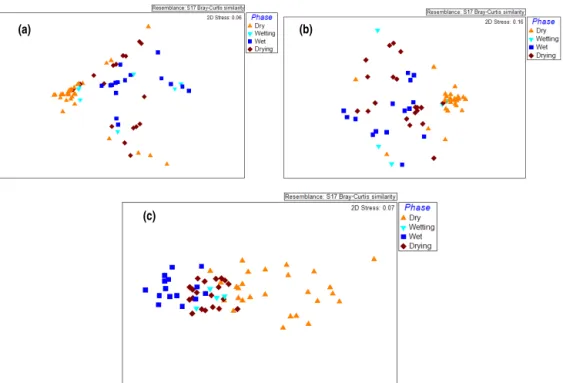
phases all six NDVI classes were present. The drying phase was also dominated by NDVI Classes 3 and 4, with mean areas of 119 and 94 km2respectively, and all NDVI classes were present in this phase. Thus, in the wetting, wet and dry-ing phases the quality of NDVI was consistent in all events with an increase and decrease in quality as hypothesised in the model. However, the quality of NDVI was expected to decrease in the dry adaptive phase, but this was not observed and it remained in Class 3 in this phase in all events (Fig. 4). Ordination revealed some separation of images among the four phases of the adaptive cycle based on area of the NDVI classes (Fig. 5a). The dry images were clumped in multi-variate space, whereas the wetting, wet and drying images were more dispersed (Table 3). The greatest distance among centroids was between the dry adaptive phase and the wet-ting, wet and drying adaptive phases (Table 4). The wetting-, wet- and drying-phase centroids were relatively close to each other in multivariate space (Table 4).
3.3 Number and direction of transitions through the adaptive-cycle phases
The observed pattern of the total number of NDVI class tran-sitions followed the hypothesised adaptive-cycle model. In all events there was a significant difference in the total
num-Table 3. Multivariate dispersion (MVDSP) index values of the different adaptive-cycle phases for NDVI class area and quality, number and direction of NDVI class transitions, and probability of NDVI class transitions data.
Multivariate dispersion index
Data type Dry Wetting Wet Drying
Area and quality 0.89 1.34 1.29 1.29
Number and direction of transitions 0.75 1.63 1.29 1.28
Probability of transitions 1.28 0.38 0.72 0.67
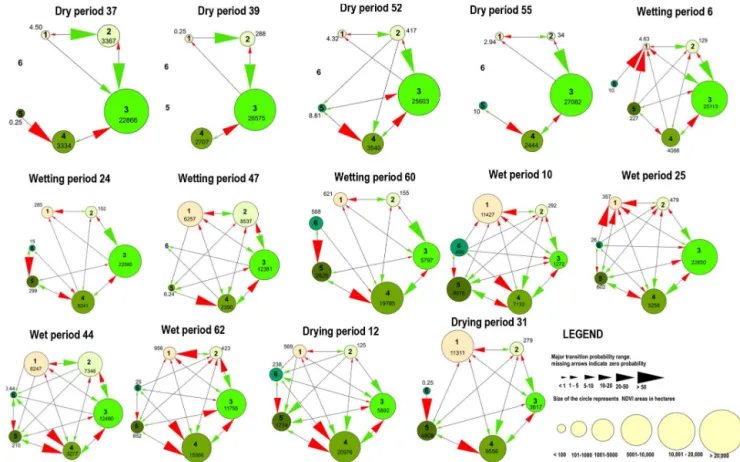
ber of transitions among the wetting, wet, drying and dry phases of the adaptive cycle (Table 2). In the dry phase 295 transitions occurred compared to 851 transitions in the com-bined wetting, wet and drying phases (Fig. 6). There was a marked increase in the total number of transitions during the wet and wetting phases followed by a decrease during the drying phase, with the lowest number of transitions in the dry phase (Fig. 6).
(a) (b)
(c)
-
-Figure 5.Nonmetric multidimensional scaling (MDS) ordinations of adaptive cycles using(a)area and quality,(b)number and directions of transitions, and(c)probability of transitions.
The observed pattern of the direction of transitions also followed the hypothesised adaptive-cycle model. In all events there was a significant difference in the number of two-way transitions among the wetting, wet, drying and dry phases of the adaptive cycle (Table 2). However, in all events there was no significant difference in the number of one-way tran-sitions among the phases in any of the events (Table 2). In all events, both one-way and two-way transitions occurred in the dry, wetting, wet and drying phases (Fig. 7). The wet phase was more dynamic, with a higher frequency of one-way and two-one-way transitions, which was not hypothesised in the model. Overall, one-way transitions were more prevalent in the dry phase and two-way transitions in the wet phase (Fig. 6). The ratio of one-way to two-way transitions in the dry phase was 0.42, significantly higher (Student’s t test: p< 0.001) than the ratios of the other phases (0.27 for the wetting phase, 0.09 for the wet phase, and 0.25 for the dry-ing phase).
Ordination based on one-way and two-way transitions re-vealed little separation of the wetting-, wet- and drying-phase images, but a separation of dry-phase images (Fig. 5b). The dry-phase images are clumped in multivariate space, whereas the wetting, wet- and drying-phase images are more dis-persed (Table 3). The greatest distance among centroids is between the dry phase and the wetting, wet and drying phases (Table 4). This suggests that the wetting, wet and drying phases are more similar to each other than to the dry phase (Table 4).
Table 4. Centroid distances between different adaptive-cycle phases using NDVI class area and quality, number and direction of NDVI class transitions, and probability of NDVI class transition data.
Group centroid distances
Data type Dry Wetting Wet Drying
Area and quality
Dry –
Wetting 28.33 –
Wet 39.70 12.52 –
Drying 30.34 10.60 13.70 –
Number and direction of transitions
Dry –
Wetting 37.76 –
Wet 48.15 25.78 –
Drying 40.82 23.32 13.42 –
Probability of transitions
Dry –
Wetting 27.37 –
Wet 39.59 15.96 –
Figure 6.An example Markovian transition model of change between NDVI Classes 1–6 in the dry, wetting, wet and drying phases of floodplain inundation. The area of floodplain in each NDVI class is shown by differently sized circles and labelled with area (ha). Arrows identify the changes between NDVI classes, with red arrows indicating decrease and the green arrows indicating increase in NDVI classes. The size of the arrowhead indicates the probability of change among NDVI classes. Periods are explained in Table 1.
0 5 10 15 20 25 30 35
1 2 3 4 5 6 7 8 9 10 11 12 13 14 15 16 17 18 19 20 21 22 23 24 25 26 27 28 29 30 31 32 33 34 35 36 37 38 39 40 41 42 43 44 45 46 47 48 49 50 51 52 53 54 55 56 57 58 59 60 61 62 63 64 65 66 67
N
um
ber
of
t
rans
it
ios
Period
One-way transition Two-way transitions
Dry Wetting Wet Drying Dry
Wetting Wet Drying Dry Wetting
Wet Drying Dry
Wetting Wet Drying
0 10 20 30 40 50 60 70 80 90 100
<1 1-5
5-10 10-20 20-50 >
50 <1 1-5
5-10 10-20 20-50 >
50 <1 1-5
5-10 10-20 20-50 >
50 <1 1-5
5-10 10-20 20-50 >
50 <1 1-5
5-10 10-20 20-50 >
50 <1 1-5
5-10 10-20 20-50 >
50 <1 1-5
5-10 10-20 20-50 >
50 <1 1-5
5-10 10-20 20-50 > 50 N um ber of t rans it ions Probability class
(a) Event 1
Dry Flood
Event 2
Dry Flood
Event 3
Dry Flood
Event 4
Dry Flood
0 20 40 60 80 100 120 140 160 N um ber of t rans it ions Probability class
Dry Wetting Wet Drying
(b)
Figure 8.The distribution of probability transition classes in(a)events divided into flood and dry components and(b)the dry, wetting, wet and drying adaptive-cycle phases.
3.4 Probability of NDVI class transitions through the adaptive-cycle phases
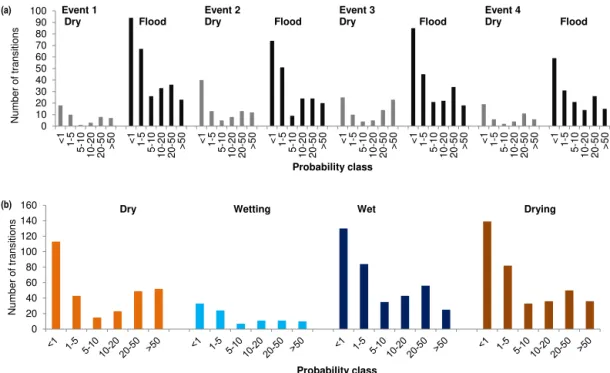
Distributions of the probability of NDVI class transitions were bimodal for each flood event (Fig. 8a) and each phase of the adaptive cycle (Fig. 8b). All distributions had a primary mode in the < 1 % probability class and a secondary mode occurring in the 10–20, 20–50 % or > 50 % probability class. There were differences in the bimodality of the probability of NDVI class transitions between the dry, wetting, wet and drying phases (Fig. 8b).
In particular, the dry phase was characterised by a pri-mary mode in < 1 % and a secondary mode in the 20–50 and > 50 % probability class (Fig. 8b). Combined, the number of transitions in the 20–50 and > 50 % probability classes was equivalent to that recorded in the < 1 % probability class. Thus, the probability of NDVI class transitions in the dry phase is dominated by a higher frequency of both low- and high-probability transitions. This contrasts with the wetting phase, where the distribution of NDVI class transitions was weakly platykurtic in nature, with a primary mode at < 1 % and a weaker secondary mode at 10–20 %, suggesting that the probability of class transitions is dominated by lower-probability transitions (Fig. 8b). The distribution of the prob-ability of NDVI class transitions in the wet and drying phases was similar to each other but different to that of the dry and wetting phases (Fig. 8b). These distributions had a dominant primary mode at < 1 % and a secondary mode at 20–50 %. These observed class transitions were as was hypothesised
for the wetting, wet and drying phases but not for the dry phase.
In contrast to the other types of data, ordination based on transition probability classes revealed dispersion of the dry-phase images and clumping of the wetting-, wet- and drying-phase images (Table 3 and Fig. 5c). In addition, the greatest distance among centroids was between the dry phase and the wetting, wet and drying phases (Table 4). The wetting-, wet-and drying-phase centroids were closer to each other in mul-tivariate space (Table 4), but the centroid distances between the drying and wetting phase were similar (Table 4).
3.5 Diversity of vegetation productivity through the adaptive-cycle phases
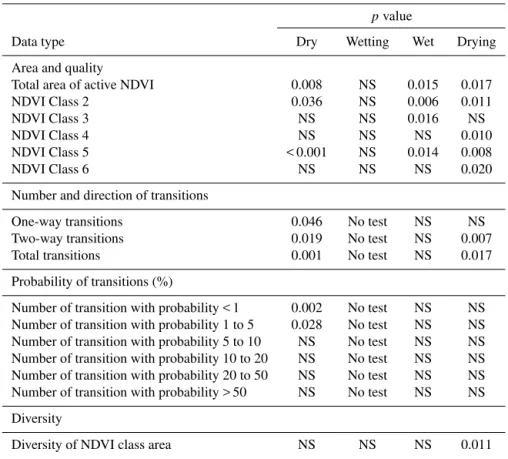
Table 5.Differences in NDVI class area and quality, number and direction of NDVI class transitions, probability of NDVI class transitions, and NDVI class diversity among events for each adaptive phase. NS: not significant (p> 0.05). No test: replication unavailable for a test.
pvalue
Data type Dry Wetting Wet Drying
Area and quality
Total area of active NDVI 0.008 NS 0.015 0.017
NDVI Class 2 0.036 NS 0.006 0.011
NDVI Class 3 NS NS 0.016 NS
NDVI Class 4 NS NS NS 0.010
NDVI Class 5 < 0.001 NS 0.014 0.008
NDVI Class 6 NS NS NS 0.020
Number and direction of transitions
One-way transitions 0.046 No test NS NS
Two-way transitions 0.019 No test NS 0.007
Total transitions 0.001 No test NS 0.017
Probability of transitions (%)
Number of transition with probability < 1 0.002 No test NS NS
Number of transition with probability 1 to 5 0.028 No test NS NS
Number of transition with probability 5 to 10 NS No test NS NS
Number of transition with probability 10 to 20 NS No test NS NS
Number of transition with probability 20 to 50 NS No test NS NS
Number of transition with probability > 50 NS No test NS NS
Diversity
Diversity of NDVI class area NS NS NS 0.011
3.6 Vegetation productivity among flood events
Despite the occurrence of adaptive phases in all four events, the size of each flood had some effect on aspects of vegeta-tion productivity in some of the adaptive-cycle phases. There was a significant difference in total NDVI area and NDVI quality among events in the dry, wet and drying phases but not in the wetting phase (Table 5). However, these differ-ences among events did not apply to all NDVI quality classes (Table 5). Significant differences in the direction of NDVI class transitions occurred among events in the dry and dry-ing phases but not in the wet phase (Table 5). In contrast, there were generally no significant differences in probability of NDVI class transitions among events in any of the phases (Table 5). Diversity only differed among events in the drying phase (Table 5). Thus, a positive relationship between flood size and the area of floodplain vegetation productivity was observed in the Narran floodplain. However, all floods had a similar response in terms of the relative quality of NDVI and the nature of changes in floodplain vegetation productivity through each of the adaptive-cycle phases.
4 Discussion
There is limited empirical evidence demonstrating the ap-plication of adaptive cycles (Scheffer, 2009), despite the
0 0.2 0.4 0.6 0.8 1 1.2 1.4 1.6
1 2 3 4 5 6 7 8 9 101112131415161718192021222324252627282930313233343536373839404142434445464748495051525354555657585960616263646566676869707172737475
S
hannon'
s
H
'
Image Number Dry
Wetting
Wet Drying Dry
Wetting
Wet Drying Dry
Wetting
Wet Drying Dry Wetting
Wet Drying
Figure 9.Shannon–Wiener Diversity Index of NDVI class area in the dry, wetting, wet and drying adaptive-cycle phases. Image numbers are explained in Table 1.
In all four events, observed floodplain vegetation produc-tivity responses matched those hypothesised in the adaptive-cycle model derived from one event (Thapa et al., 2016). The area of vegetation productivity increased in the dry and drying phases and decreased in the wetting and wet phases. The quality of vegetation productivity was also as hypothesised, with higher-quality vegetation productivity in the wet and wetting phases, lower-quality productivity in the drying phase and lowest-quality productivity in the dry phase. The maximum number of transitions between NDVI classes occurred in the wet phase and was dominated by two-way transitions, as hypothesised. The dry phase had the lowest number of transitions and was dominated by one-way transitions, as hypothesised. The distribution of prob-ability transitions was bimodal in all phases, also as hy-pothesised, but the degree of bimodality differed between phases. The wetting, wet and drying phases were domi-nated by smaller-probability class changes (i.e. more fre-quent smaller-magnitude changes), whereas in the dry phase, higher-probability changes (i.e. higher-magnitude changes) were more prominent, and this was not as hypothesised. Di-versity also followed the hypothesised adaptive-cycle model with a high diversity of NDVI classes in the wet phase, de-creasing through the drying phase to be lowest in the dry phase. These recurrent patterns of vegetation productivity through the phases of the adaptive cycle demonstrate that the effects of floodplain flooding and drying are consistently reflected in vegetation response. One of the tenets of the theory of adaptive cycles is repetition through phases of conservation, release, reorganisation and exploitation, where one phase builds the conditions that influence the movement of the system into the next phase (Holling and Gunderson,
2002). The movement of Narran floodplain vegetation pro-ductivity through the adaptive-cycle phases is influenced by the conditions of flooding and drying associated with a hy-drological driver of ecosystem change.
by a range of hydro-geomorphic factors including hydrology (Sims and Thoms, 2002), soil character (Reid at al., 2011) and floodplain morphology (Scown et al., 2016). In a se-ries of experiments designed to test the influence of different flooding and drying regimes on floodplain vegetation, Webb et al. (2006) demonstrated that prolonged waterlogging of floodplain soils can inhibit vegetation recruitment and pro-ductivity. Thus, longer-duration flood events may suppress floodplain vegetation productivity in the wet phase. By com-parison, larger-scale variations in the nutrient status of flood-plain soils have been inferred to influence vegetation pro-ductivity across floodplains whereby areas of elevated nu-trients are associated with more productive vegetation and faster vegetation productivity response to flooding (Sims and Thoms, 2002; Reid et al., 2011). However, the systematic variation of soil nutrient concentrations from west to east across the Narran floodplain, which is a legacy of past geo-morphic processes (Rayburg et al., 2006), suggests the min-imal influence of soil nutrients on the landscape pattern of vegetation productivity response.
The environmental processes influencing vegetation pro-ductivity response through the wetting, wet, drying and dry adaptive-cycle phases in the Narran floodplain can only be hypothesised at present. Nonetheless, understanding patterns at multiple levels of organisation is an essential first step in deciphering the relationships between ecosystem pattern and process (Turner, 1989). The new philosophy of science (Pickett at al., 1994) emphasised the explanation of struc-tures and patterns rather than focusing solely on proving causality using a falsification approach. Experiments can be conducted on plant ecophysiology and inundation interac-tions to understand the causal mechanisms driving floodplain vegetation productivity responses through the adaptive-cycle phases. However, floodplains are complex systems and veg-etation responses to inundation may have multicausal, self-emergent and hierarchically organised properties that can never be fully deciphered with a reductionist approach. Inter-disciplinary floodplain research requires information on both the complexity of patterns on multiple scales and detailed ex-perimental studies to increase understanding about the nature of change and the potential influence of multiple drivers on patterns of change.
Studying resilience is about characterising and under-standing change in complex systems (Gunderson and Pritchard, 2002; Walker and Salt, 2012). Ecologically, re-silience can be defined as the capacity of systems to undergo change while maintaining the same fundamental structure, function and feedbacks (Holling, 1973; Holling and Gun-derson, 2002; Walker and Salt, 2012). Adaptive cycles are a component of resilience theory and provide a framework for understanding how complex systems undergo change (Holling and Gunderson, 2002). The results of this study consistently demonstrated vegetation productivity change through an adaptive cycle in response to flooding and drying. Thus, this study supports the notion of Holling (1973) and
Holling and Gunderson (2002) that a resilient system fluctu-ates between the four phases of an adaptive cycle. A feature of an adaptive cycle is that it contains an exit point where the system might flip to a different cycle characterised by different structure, function and feedbacks (Holling, 1973; Gunderson and Pritchard, 2002). Although little is known about the exit from an adaptive cycle, exit points have been characterized as periods of marked change in the stability of key driving factors (Scheffer and Carpenter, 2003; Scheffer, 2009). When a system approaches a threshold of change, it fluctuates more, which is thought to be an indicator of an impending change in state or regime shift (Biggs et al., 2009; Scheffer, 2009). The transition between the reorgani-sation and exploitation phases is considered as the point in the adaptive cycle at which a system is more vulnerable to state change (Holling and Gunderson, 2002; Scheffer et al., 2001). Example state changes have been observed for lake, coral reef, forest and grassland ecosystems (Scheffer et al., 2001; Scheffer and Carpenter, 2003; Wolf et al., 2007), but it has only been hypothesised thus far that this state change occurs between the reorganisation and exploitation phases of the adaptive cycle. In the Narran floodplain, stability, rather than instability, in vegetation productivity was observed in the reorganisation and exploitation phases of the adaptive cy-cle. The conservation phase of the floodplain adaptive cycle was found to be the most unstable, with a greater number of transitions between NDVI classes, a greater number of two-way transitions, and transitions characterised by high-frequency or low-magnitude changes in NDVI class. The re-sults from the Narran floodplain suggest that in contrast to theory, the exit point occurs in the conservation to release phases when the floodplain is wet, not dry. Resilience think-ing may provide a useful framework with which to investi-gate the physical domains (water and sediment exchange) of floodplains as earth surface systems. Concepts of resilience, such as adaptive cycles and tipping points, may act as useful frameworks with which to investigate dynamic earth surface systems.
com-plexity of floodplain change using an adaptive-cycle perspec-tive will increase our ability to model and manage these valu-able but fragile ecosystems in the future.
Acknowledgements. The authors thank Geoscience Australia and the United States Geological Survey for supplying Landsat images. This research was supported by a UNE International Strategic Postgraduate Scholarship.
Edited by: H. Viles
References
Anderson, M., Gorley, R., and Clarke, K.: Primer-E.
PERMANOVA+ for PRIMER: Guide to software and
sta-tistical methods, Plymouth University, Plymouth, UK, 2008. Biggs, R., Carpenter, S. R., and Brock. W. A.: Turning back from
the brink: Detecting an impending shift in time to avert it, P. Natl. Acad. Sci. USA, 106, 826–831, 2009.
Bolliger, J., Wagner, H. H., and Turner, M. G.: Identifying and Quantifying Landscape Patterns, in: A Changing World. Chal-lenges for Landscape Research, edited by: Kienast, F., Wildi, O., and Ghosh, S., Springer Science, Dordrecht, the Netherlands, 177–194, 2009.
Bunn, S. E., Thoms, M. C., Hamilton, S. K., and Capon, S. J.: Flow variability in Dryland Rivers: boom, bust and the bits in between, River Res. Appl., 22, 179–186, 2006.
Capon, S. J.: Plant community responses to wetting and drying in a large arid floodplain, River Res. Appl., 19, 509–520, 2003. Capon, S. J.: Flood variability and spatial variation in plant
commu-nity composition and structure on a large arid floodplain, J. Arid Environ., 60, 283–302, 2005.
Chander, G., Markham, B. L., and Helder, D. L.: Summary of cur-rent radiometric calibration coefficients for Landsat MSS, TM,
ETM+, and EO-1 ALI sensors, Remote Sens. Environ., 113,
893–903, 2009.
Dollar, E. S. J., James, C. S., Rogers, K. H., and Thoms, M. C.: A framework for interdisciplinary understanding of rivers as ecosystems, Geomorphology, 89, 147–162, 2007.
Farina, A.: Principles and Methods in Landscape Ecology, To-wards a Science of Landscape, Springer Science, Dordrecht, the Netherlands, 2006.
Fitzpatrick, A., Clarke, J. D. A., and Lane, R.: Mapping hydrolog-ical architecture beneath the lower Balonne floodplain, Queens-land, Australia, Geophysical Research Abstracts, 7, 02505, 2005. Folke, C., Carpenter, S. R., Walker, B., Scheffer, M., Chapin, T., and Rockström, J.: Resilience thinking: integrating resilience, adaptability and transformability, Ecol. Soc., 15, available at: http://www.ecologyandsociety.org/vol15/iss4/art20/ (last access: 19 January 2016), 2010.
Frazier, P. S. and Page, K. J.: Water body detection and delineation with Landsat TM data, Photogramm. Eng. Rem. S., 66, 1461– 1468, 2000.
Gunderson, L. H. and Pritchard, L.: Resilience and Behaviour of Large-Scale Systems, Island Press, Washington, USA, 2002. Holling, C. S.: Resilience and stability of ecological systems, Annu.
Rev. Ecol. Syst., 4, 1–23, 1973.
Holling, C. S.: The resilience of terrestrial ecosystems, local sur-prise and global change, in: Sustainable development of the bio-sphere, edited by: Clark, W. C., and Munn, R. E., Cambridge University Press, Cambridge, UK, 292–317, 1986.
Holling, C. S. and Gunderson, L.: Resilience and adaptive cy-cles, in: Panarchy: Understanding Transformations in Human and Natural Systems, edited by: Gunderson, L. and Holling, C. S., Island Press, Washington DC, USA, 25–62, 2002.
Horner, G. J., Baker, P. J., Nally, R. M., Cunningham, S. C., Thom-son, J. R., and Hamilton, F.: Mortality of developing floodplain forests subjected to a drying climate and water extraction, Global Change Biol., 15, 2176–2186, 2009.
Hughes, F. M. R.: Floodplain biogeomorphology, Prog. Phys. Geog., 21, 501–529, 1997.
Hupp, C. R.: Hydrology, geomorphology and vegetation of Coastal Plain rivers in the sout-eastern USA, Hydrol. Process., 14, 2991– 3010, 2000.
Lillesand, T. M. and Kiefer, R. W.: Remote sensing and image in-terpretation, John Wiley and Sons, New York, USA, 2000. Magurran, A. E.: Ecological diversity and its measurement,
Springer-Verlag, Berlin, Germany, 1988.
Mertes, L. A. K., Daniel, D. L., Melack, J. M., Luiz, B. N., Mar-tinelli, A., and Forsberg, B. R.: Spatial patterns of hydrology, geomorphology, and vegetation on the floodplain of the Amazon River in Brazil from a remote sensing perspective, Geomorphol-ogy, 13, 215–232, 1995.
Murray, O., Thoms, M., and Rayburg, S.: The diversity of inundated areas in semi-arid flood plain ecosystems, International Associa-tion of Hydrological Sciences, 306, 277–286, 2006.
Myeong, S., Nowak, D. J., and Duggin, M. J.: A temporal analy-sis of urban forest carbon storage using remote sensing, Remote Sens. Environ., 101, 277–282, 2006.
Naiman, R. J., Bechtold, J. S., Beechie, T. J., Latterell, J. J., and Van Plet, R.: A process-based view of floodplain forest patterns in coastal river valleys of the Pacific Northwest, Ecosystems, 13, 1–31, 2010.
Overton, I. C.: Modelling floodplain inundation on a regulated river: integrating GIS, remote sensing and hydrological models, River Res. Appl., 21, 991–1000, 2005.
Parsons, M. and Thoms, M. C.: Patterns of vegetation greenness during flood, rain and dry resource states in a large, unconfined floodplain landscape, J. Arid Environ., 88, 24–38, 2013. Pickett, S. T. A., Kolasa, J., and Jones, C. G.: Ecological
Under-standing: The Nature of Theory and the Theory of Nature, Aca-demic Press, San Diego, CA, USA, 1994.
Rayburg, S. and Thoms, M.: A coupled hydraulic–hydrologic mod-elling approach to deriving a water balance model for a complex floodplain wetland system, Hydrol. Res., 40, 364–379, 2009. Rayburg, S., Thoms, M., and Lenon, E.: Unravelling the physical
template of a terminal floodplain – wetland sediment storage system, International Association of Hydrological Sciences, 306, 304–313, 2006.
Reid, M. A., Ogden, R., and Thoms, M. C.: The influence of flood frequency, geomorphic setting and grazing on plant communities and plant biomass on a large dryland floodplain, J. Arid Environ., 75, 815–882, 2011.
Scheffer, M. and Carpenter, S. R.: Catastrophic regime shifts in ecosystems: linking theory to observation, Trends Ecol. Evol., 18, 648–656, 2003.
Scheffer, M., Carpenter, S., Foley, J. A., Folke, C., and Walker, B.: Catastrophic shifts in ecosystems, Nature, 413, 591–596, 2001. Scown, M., Thoms, M., and De Jager, N. R.: Measuring spatial
pat-tern in floodplains: A step towards understanding the complexity of floodplain ecosystems, in: River Science: Research and Ap-plications for the 21st Century, edited by: Gilvear, D. J., Green-wood, M., Thoms, M., and Wood, P., John Wiley and Sons, UK, 239–258, 2016.
Shaikh, M., Green, D., and Cross, H.: A remote sensing approach to determine environmental flows for wetlands of the Lower Dar-ling River, New South Wales, Australia, Int. J. Remote Sens., 22, 1737–1751, 2001.
Sims, N. C. and Thoms, M. C.: What happens when flood plains wet themselves: vegetation response to inundation on the lower Balonne floodplain, International Association of Hydrological Sciences, 276, 195–202, 2002.
Thapa, R., Thoms, M., and Parsons, M.: An adaptive cycle hypothe-sis of semi-arid floodplain vegetation productivity in dry and wet resource states, Ecohydrology, 9, 39–51, 2016.
Thomas, R., Bowen, S., Simpson, S., Cox, S., and Sims N.: In-undation response of vegetation communities of the Macquarie Marshes in semi-arid Australia, in: Ecosystem Response Mod-elling in the Murray – Darling Basin, edited by: Saintilan, N., and Overton, I., CSIRO publishing, Melbourne, Australia, 139– 153, 2010.
Thoms, M. and Parsons, M.: Patterns of vegetation community dis-tribution in a large, semi-arid floodplain landscape, River Sys-tems, 19, 271–282, 2011.
Thoms, M., Capon, S., Padgham, M., and Rayburg, S.: The Narran Ecosystem Project: The response of a terminal wetland system to variable wetting and drying. Final report to Murray-Darling Basin Commission. No. 40/08, Canberra, Australia, 2007. Thoms, M. C.: Floodplain-river ecosystems: lateral connections
and the implications of human interference, Geomorphology, 56, 335–349, 2003.
Thoms, M. C. and Sheldon, F.: Lowland rivers: An Australian in-troduction, Regul. River, 16, 375–383, 2000.
Turner, M. G.: Landscape ecology: the effect of pattern on process, Annu. Rev. Ecol. Syst., 20, 171–197, 1989.
Walker, B. and Salt, D.: Resilience practice: Building capacity to absorb disturbance and maintain function, Island Press, Wash-ington DC, USA, 2012.
Walker, B. H. and Salt, D.: Resilience Thinking. Sustaining Ecosys-tems and People in a Changing World, Island Press, Washington DC, USA, 2006.
Walker, K. F., Sheldon, F., and Puckridge, J. T.: A perspective on dryland river ecosystems, Regul. River, 11, 85–104, 1995. Ward, D. P., Petty, A., Setterfield, S. A., Douglas, M. M.,
Ferdi-nands, K., Hamilton, S. K., and Phin, S.: Floodplain inundation and vegetation dynamics in the Alligator Rivers region (Kakadu) of northern Australia assessed using optical and radar remote sensing, Remote Sens. Environ., 147, 43–55, 2014.
Warwick, R. and Clarke, K.: Increased variability as a symptom of stress in marine communities, J. Exp. Mar. Biol. Ecol., 172, 215– 226, 1993.
Webb, M. C., Reid, M. A., Capon, S., Thoms, M. C., Rayburg, S., and James, C. S.: Are floodplain-wetland plant communities de-termined by seed bank composition or inundation periods?, In-ternational Association of Hydrological Sciences, 306, 241–350, 2006.
Wen, L., Yang, X., and Saintilan, N.: Local climate determines the NDVI-based primary productivity and flooding creates hetero-geneity in semi-arid floodplain ecosystem, Ecol. Model., 242, 116–126, 2012.
Weng, Q.: Land use change analysis in the Zhujiang Delta of China using satellite remote sensing, GIS and stochastic modelling, J. Environ. Manage., 64, 273–284, 2002.
Wolf, E. C., Cooper, D. J., and Hobbs, N. T.: Hydrologic regime and herbivory stabilize an alternative state in Yellowstone National Park, Ecol. Appl., 17, 1572–1587, 2007.