The Good, the Bad, and the Tiny: A Simple,
Mechanistic-Probabilistic Model of
Virus-Nutrient Colimitation in Microbes
B. B. Cael1,2*
1Massachusetts Institute of Technology, Cambridge, MA, United States of America,2Woods Hole Oceanographic Institution, Woods Hole, MA, United States of America
Abstract
For phytoplankton and other microbes, nutrient receptors are often the passages through which viruses invade. This presents a bottom-up vs. top-down, co-limitation scenario; how do these would-be-hosts balance minimizing viral susceptibility with maximizing uptake of limiting nutrient(s)? This question has been addressed in the biological literature on evolu-tionary timescales for populations, but a shorter timescale, mechanistic perspective is lack-ing, and marine viral literature suggests the strong influence of additional factors, e.g. host size; while the literature on both nutrient uptake and host-virus interactions is expansive, their intersection, of ubiquitous relevance to marine environments, is understudied. I pres-ent a simple, mechanistic model from first principles to analyze the effect of this co-limitation scenario on individual growth, which suggests that in environments with high risk of viral invasion or spatial/temporal heterogeneity, an individual host’s growth rate may be opti-mized with respect to receptor coverage, producing top-down selective pressure on short timescales. The model has general applicability, is suggestive of hypotheses for empirical exploration, and can be extended to theoretical studies of more complex behaviors and systems.
Introduction
Phytoplankton account for approximately half of global annual primary production [1]; both phytoplankton and marine bacteria are important components in global biogeochemical cycles and the global ecosystem [2]. Though phytoplankton and other marine microorganisms are regulated simultaneously by bottom-up [3,4] and top-down control [5], the former frequently a result of nutrient limitation, the latter frequently a result of viral invasion [6], these controls are seldom studied simultaneously. Both grazing effects and nutrient limitation are well-stud-ied [7,8]; understanding of viral impacts remains poorer [9] but viruses are known to have sig-nificant effects on a vast range of marine microbes; studies include e.g. estimates that 30% of cyanobacterial death is caused by viral lysis [10], or laboratory results showing a 20% increase in viral concentration can halve phytoplankton primary productivity and biomass [11]. Viral a11111
OPEN ACCESS
Citation:Cael BB (2015) The Good, the Bad, and the Tiny: A Simple, Mechanistic-Probabilistic Model of Virus-Nutrient Colimitation in Microbes. PLoS ONE 10(11): e0143299. doi:10.1371/journal.pone.0143299
Editor:Muhammad Aqeel Ashraf, University of Malaya, MALAYSIA
Received:May 27, 2015
Accepted:November 3, 2015
Published:November 23, 2015
Copyright:© 2015 B. B. Cael. This is an open access article distributed under the terms of the Creative Commons Attribution License, which permits unrestricted use, distribution, and reproduction in any medium, provided the original author and source are credited.
Data Availability Statement:All relevant data are within the paper and its Supporting Information files.
Funding:This work was supported by the Massachusetts Institute of Technology Charles Vest Presidential Fellowship. The funders had no role in study design, data collection and analysis, decision to publish, or preparation of the manuscript.
invasion also plays an important role in biogeochemical cycles through the“viral shunt”[12]. Viruses often occur at an order of magnitude higher concentration in marine environments than even prokaryotes, [13], up to 109ml−1in some cases. These estimates are given for total
number of viruses; however, the networks of virus-host interactions are complex, and involve both specialization and generalization [14,15,16].
Viruses typically inject their genetic material into hosts through specific channels on the cell surface [17]; some of these channels in both phytoplankton and bacteria are the receptors through which the organism takes up nutrients [18,19,20]. This presents an interesting co-limitation scenario, where the would-be-host must balance minimizing viral susceptibility with maximizing uptake of limiting nutrient(s). This question was deftly addressed on evolutionary timescales using adaptive dynamics in a 2009 paper by Menge and Weitz [21]. However, there are complicating factors on longer timescales, such as the co-evolving process of‘lock and key’ dynamics between host and virus [22]; simultaneously, some microorganisms have been shown to express control over their receptor availability on short timescales [23,24], and the dynamics of encounter rates are nontrivial and may yield significantly different results than a prescribed viral encounter rate. Classicaly in marine systems, viral uptake has been modeled as a rate process [25], but as marine viruses are often quite virulent [6,17] and their invasion-to-lysing timescales are typically much shorter than host replication rates [26,27], modeling viral invasion in this way is not faithful to the system considered herein (this paper focuses on marine environments). Instead, to garner a robust, mechanistic understanding of the dynamics of viral invasion, it must be modeled probabilistically as a first-passage-time process, based on the Brownian motion of the viruses, and by comparing timescales of nutrient uptake-limited host reproduction with viral invasion times. This is to say that hosts do not accumulate viruses at a particular diffusive rate; once a host has been invaded, the virus quickly dominates its repli-cative machinery, and its lysing is more or less assured.
In what follows I develop a simple mechanistic model from first principles to address this co-limitation on shorter timescales, from an individual host’s perspective. It should not be con-sidered a thorough explication of the relevant factors’effect on individual growth rate, but rather a hypothesis-generating tool for laboratory orin situinvestigation, suggesting among other things i) that an individual’s lineage’s growth rate may indeed be optimized with respect to receptor coverage, on various timescales, but only in a restricted set of conditions where viruses are plentiful and/or hosts are aggregated, ii) which conditions might be expected to result in a microbial population being drawn down to a seed population by phage activity, iii) that organisms with fast controls on their receptor activity might be advantaged by reducing receptor activity in host-aggregated or high-viral conditions, iv) that intermittency in viral con-centration might serve as a means to support phenotypic diversity in a microbial population in terms of receptor allocation.
Analysis
Setup
uptake dynamics at these scales [29], and as organisms are expected to relax their uptake rate to that where nutrients are co-limiting [30], the consideration of a single nutrient is not seri-ously restrictive. The case of multiple viruses may be interesting and relevant to real systems, but all of the expected results are well-treated in [21], and outside of the scope of this paper. In our parameter range selection we focus on marine systems, but the model should be equally applicable to other microbial systems as well.
We track nutrient parameters with the subscriptνand virus parameters with the subscript β; host concentration will be tracked with the subscriptη. Model parameters are then:
• concentration and diffusivity of nutrient and virus, resp. (cν,κν,cβ,κβ).
• host radiusa, nutrient quotaq(the mass of nutrient needed to uptake before replicating), and local concentrationcη. As this is an individual model, by‘local concentration’we mean
the concentration of hosts in a small region around the individual host, e.g. within a sphere centered at the host with radiusO(10−3m); thus if hosts are aggregated or patchy, local
con-centrationcηincreases.
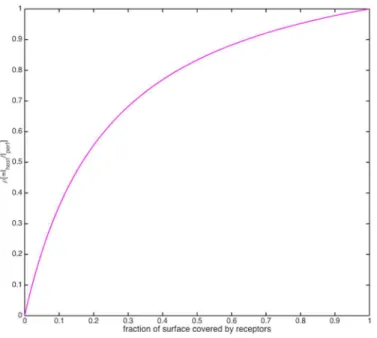
• host receptor efficiencyρ, i.e. the ratio of the cell’s nutrient uptake rate with that of a perfectly absorbing sphere its sizeI/Iperf, a monotonic function of the fraction of its cell surface covered
by receptors (Fig 2) [31].
Table 1displays observationally derived value ranges for the above parameters in various marine ecosystems [32–48]. Let nutrients be uptaken diffusively and let virsues travel in 3-d Brownian motion. Employing the canonical formula for nutrient uptake rate [31,49] as a func-tion of these parameters,I= 4πρaκνcν, a time-to-replication can easily be derived as the cell
quota divided by the uptake rate, i.e.tr:¼q=I. As mentioned in the introduction, classically [25] virus uptake has been modeled as a diffusive absorption process as well, taken up in large numbers by hosts; however, marine viruses are known to be highly virulent [6,17], thus it is
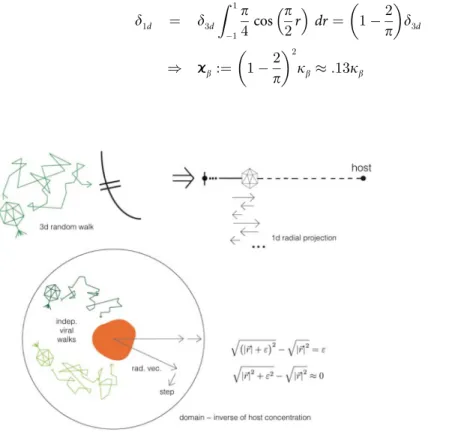
Fig 1. Model schematic.Viruses invade a would-be-host through the same receptor via which the host uptakes a limiting nutrient.
not an unreasonable assumption to take it that a viral invasion corresponds to the eventual death of its host’s lineage; marine viral lysing timescales have been shown in many cases to be much shorter than host replication times (though are not always, e.g. for lysogenic viruses, for which this sort of model does not apply) [26,27]. Thus we can model viral uptake probabilisti-cally, with the virus taking a 3-dimensional random walk in a domain near its host, and deriv-ing a probability density function for thefirst passage time to the host’s cell surface.
Fig 2. Plot of receptor efficiency versus percent receptor coverage.Similar to a Monod curve. doi:10.1371/journal.pone.0143299.g002
Table 1. Parameter definitions, typical values, and units.
parameter definition/formula typical range units
values taken from [12,13,25,35–48] and sources compiled therein
host radius (aη) equivalent spherical radius [32] 10−6−10−4 m
nutrient radius (aν) ” 10−11−10−9 m
viral radius (aβ) ” 10−8−10−7 m
host concentration (cη) local microscale concentration 106−1011 m−3
nutrient concentration (cν) ” 1010−1014 fg m−3
virus concentration (cβ) ” 107−1012 m−3
host nutrient quota (q) mass of nutrient required to uptake before replicating .1—106 fg host receptor efficiency (ρ) fraction of uptake rate relative to perfect absorber,I/Iperf .1-1
-nutrient diffusivity (κν) Einstein-Stokes relation:ki:¼ kBT
6pnai 10
−10
−10−9 m2/s virus radial diffusivity (ϰ
b) projection of 3-d viral diffusivity onto radial vector,*.13κβ 10−13−10−12 m2/s host replication timescale (τr) tr:¼q=I¼
q 4praZkncn
<1/day—>1/week s
host probability of replication (Pr) probability thatτr<τinvasion 0—1
-host lineage growth rate (μ) expected growth rate incorporating virus-induced death <0
Radial walk
Since viral walks will be independent (as they are Brownian motion trajectories), consider a single virus randomly walking near a host, in spherical coordinates (φ,ϑ,r) with the origin at the host’s center; the angle coordinates are irrelevant for invasion, so optimally we’d like to project this to a 1-d walk. This in general is not possible, because spherical coordinates have curvature, but in this case we can take advantage of the fact that the mean step size for the virus is several orders of magnitude smaller than its radial coordinate vector, which is at leastO(a) =
O(μm). When decomposing a given random step into its radial and nonradial components, the effect of the nonradial component on the radial distance after the step will be negligible; this is just by Pythagoras’theorem. For a random step starting at radiusrdecomposed into radial partsand nonradial partε, the new radial distance:
ffiffiffiffiffiffiffiffiffiffiffiffiffiffiffiffiffiffiffiffiffiffiffiffiffi
ðrþsÞ2þε2
q
¼ ffiffiffiffiffiffiffiffiffiffiffiffiffiffiffiffiffiffiffiffiffiffiffiffiffiffiffiffiffiffiffiffiffiffiffi r2þ2rsþs2þε2 p
ffiffiffiffiffiffiffiffiffiffiffiffiffiffiffiffi r2þ2rs p
even whenεsbecauser⋙s;ε. We thus can project the 3-d random walk onto a 1-d random walk with a redefined radial diffusivityϰ
b(Fig 3), for which the orthogonal components can be incorporated as a negative drift; this drift is small enough for the parameter range of this model to be ignored; its inclusion has no impact on the results, and may even be surpassed by a posi-tive drift towards host receptors caused by viruses acposi-tively seeking their hosts as thought possi-ble in some cases [37]. To calculateϰ
b, wefind the projected mean radial step lengthδ1dfor the
given 3-d step length by integrating over all step directions, assuming that step angles are uncorrelated:
d1d ¼ d3d
Z 1
1
p
4cos
p
2r
dr¼ 1 2
p
d3d
) ϰ
b:¼ 1
2
p
2
kb:13kb
Fig 3. Viral walk projection schematic.
First passage time
Chankdrasekhar [50,51] showed that for randomly distributed particles in three dimensions the mean distance between particles of a given concentrationcis5
9c
1=3(technically the
prefac-tor is.5545/9); we may then consider the virus to be undergoing a 1-d radial random walk betweenaandb:¼ 5
18c 1=3
Z , where we implement an absorbant boundary condition ataand a reflective/periodic boundary condition atb; the second boundary condition is included to account for the multiplicity of hosts and viruses in the local environment; a virus moving away from one host will be moving closer to another one nearby. We then may use the established result in probability theory that the time it takes for a virus starting at radial distanceγto hit the cell surface is given by a Lévy distributionL[52]; if we were to incorporate the small drift, we would use an Inverse Gaussian distribution, which has the Lévy distribution as its limit [53]. We then take thisfirst passage probability for invasion timeτi(without shifting from the
origin, as is done in some cases):
Lðh;g2
Þ :¼ ffiffiffiffiffiffiffiffiffiffig 2ph3
p exp g2=2h
ð Þ )
2PðtijgÞ ¼ L t;ðg aÞ 2
ϰ b
!
þL t;ð2b a gÞ 2
ϰ b
!
where we incorporate the possibility that the virus travels all the way to the reflective boundary and back to the cell surface, or equivalently travels away from another cell’s and to the surface of that host, and normalize accordingly, as we have added two probability distributions. We can thenfind the probability of time-to-invasion by integrating over all possibile initial posi-tions for the virus in the dining sphere, then define probabilityprthatτr<τi, i.e. that a host
starting with a single virus in its dining sphere successfully replicates. Assuming our times are sufficiently small thatðb aÞ=ð ffiffiffiffiffiffiffiϰ
bt
p Þ 2(which is more than guaranteed by host replication
timescales being on the order of a day) then dropping small terms, this expression simplifies to:
pr ¼1
Z tr
o
EgfPðtijgÞPðgÞg dti 1
4
p
a2
b3 a3
ffiffiffiffiffiffiffiffiffi
ϰ btr
p
These results are well-matched by a similar derivation one can take using electrostatics [53] and by the CDF of the Lévy distribution which is a complimentary error function, but more instructive in that the above expression reveals direct parameter dependencies and provides additional intuition as to the importance of various terms than an expression involving
modi-fied Bessel functions or erfc().
Growth rate
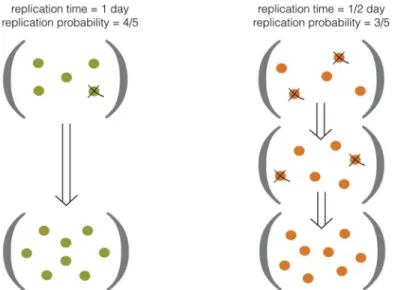
However, this above expression doesn’t tell the whole story; ultimately the most successful strategy for a lineage is determined by a combination of this replication probability, the num-ber of viruses in play, and thetimeit takes to replicate, because replication is a compounding process; a faster, riskier strategy can beat out a more conservative strategy (Fig 4). Ultimately, then, the desired parameter is the growth rate. If we consider a replication event as a doubling, and there arenβviruses in the host’s dining sphere, we can define the (expected, individual,
viral-uptake-included) growth rateμas [54]
m:¼ ln ð2pnb
r Þ1= tr
¼ 1
tr ln2þnblnpr
Noting thatnb¼
4p
3 rcbb
3 ¼53p
237rcb=cZ:089rcb=cZbecause viral trajectories are independent and the likelihood of a virus successfully contacting a receptor (invasion site) is proportional to the host’s receptor efficiency by construction, and plugging in our previously derived formulae forprandτr, wefind:
m¼4pkncnaZr
q :69þ:089r
cb cZ
ln 1 :13 a 3=2
Z
5 18
3 c 1
Z a3Z
" #
ffiffiffiffiffiffiffiffiffiffiffia nq abcnr
r !!
ðÞ
where we have takenκβ/κν=aν/aβas the ratio of their radii, derived from the Einstein-Stokes
relationki:¼ kBT
6pnai[29], and added the subscriptηto the host’s radius; the above equation is the
same ifaν/aβis replaced byκβ/κν. Our desired expression for the individual host lineage growth
rate in the presence of both nutrients and viruses. Freezing parameters other thanρ, this equa-tion takes the form
m¼ArþBr2lnð1 Cr 1=2Þ ðÞ
A:¼4pln2kncnaZ=q B:¼:13A cb cZ
C:¼:13 a
3=2
Z
5 18
3 c 1
Z a3Z
" #
ffiffiffiffiffiffiffiffia nq abcn r
Whereμ,A, andBhave units of inverse time, andCis dimensionless. The recurrence of the prefactor.13 is a coincidence, as would be clear if we expanded past two significant digits. The termAρindicates the standard“virusless”growth rate, and the always-negative second term indicates the impact of viral invasion on growth rate, which is affected not only by viral param-eters but by host and nutrient paramparam-eters as well, reflecting the importance of invasion as well as replication timescales in the growth rate.
Fig 4. Schematic of individual lineage virus-modified growth rateμ.success is determined both by viral susceptibility and replication rate.
Results
The above expression provides a framework to investigate sensitivity of growth rate to different parameters, and more interestingly to suggest under what conditions growth rate might be optimized with respect to receptor coverage. After plugging in ranges of typical values for parameters as suggested inTable 1, we found:
• μdecreases linearly as virus concentrationcβincreases, as expected, because more viruses are
present to increase probability of invasion.μincreases superlinearly in nutrient concentra-tioncν, because not only is the virus-free growth rate increasing linearly but the probability
thatτr<τiis increasing simultaneously.
• diffusivities may change because of changing temperature or different radii of the diffusing particle; higher diffusivities will result in higher encounter rates. If temperature increases,μ increases linearly because the difference inκβis offset by proportional increase inκνin the
coefficientC, while the coefficientA/κν; if diffusivities change because of changes in radii,
aνdecreasing will causeμto increase superlinearly, for similar reasons to the effect ofcν
above, while a decrease inaβwill causeμto decrease.
• μand host nutrient quotaqare approximately inversely proportional, as expected, becauseτr /q.
• μdecreases superlinearly as host radiusaηincreases, as can be seen most clearly in the
expres-sion forpr; this is consistent with classical theory in viral dynamics [26], though derived
quite differently.
The more interesting behavior is that of receptor coverageρand host concentrationcη; ifA Bin () above,cηhas negligible effect andμincreases linearly withρ. However, in cases of :089cb
cZOð1Þ, we haveO(A) =O(B), and hosts may optimizeμwith respect toρ. Because
methods of estimating ocean viral concentrations do not in general differentiate between viral types, but do almost always register higher concentrations of viruses than phytoplankton or microbes in the ocean, it is difficult to get good estimates ofcβ, but it is known that the value of cβ/cηmay range over several orders of magnitude but can often be1; on average we might
expectB/A= 1.3 if on averagecβ10cη[14].
Even if the bulk concentration of hosts may be low, as the individual in this case only is affected by thelocalconcentration at its own scale,cηmay be significantly larger than if hosts
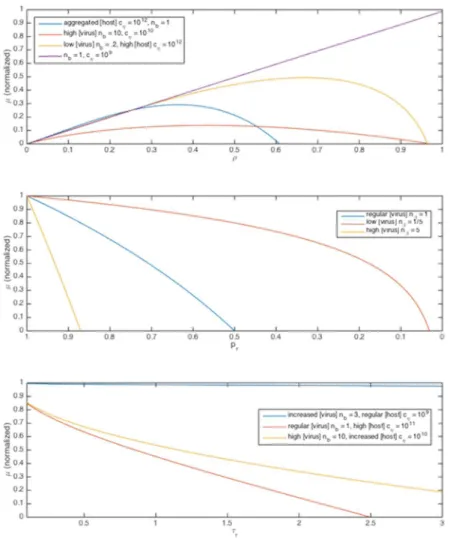
were uniformly distributed, which can significantly change the value ofC, which may thus range over several orders of magnitude dependent on the various parameter values [55,56]. Thus the model suggests that in cases where the concentration of viruses is at least an order of magnitude than that of its hosts, or the hosts are aggregated, that optimal growth rate may be achieved withρlower than 1 (Fig 5). After exploring the observationally suggested parameter space, we can simplify to four regimes:
Regime I: IfABandCis not particularly large,μAρ, this is maximized forρ= 1. That is, if viruses are not particularly locally abundant relative to hosts, and hosts are not particularly large or abundant, an individual lineage’s growth rate will be unaffected by viruses, as we might expect; this does not, however, imply viral invasion rates are non-negligible for the population.
Regime III: IfA>BbutC=O(1) or larger, there will be an optimum inμwith respect toρ. That is, if hosts are at high local concentrations, whether in bloom or aggregated, especially for larger hosts, their individual risk for viral invasion increases, because if an individual virus enters the region of aggregation its likelihood of contacting a host increases significantly. This carries the implicit assumption that host aggregation is un- or positively correlated with viral aggregation, which is difficult to measure on microscales, but plausible; in a patch of hosts there is an increased likelihood that viruses are present in at least as significant numbers because of an increased likelihood that a lysing event has recently occurred or will soon occur, releasing a large number of viruses. This colocation is a subtle component needing further consideration.
Regime IV: In some cases, parametersCand/orBcan become large enough thatμis nega-tive for nearly allρvalues; in these cases, the viral invasion rate is high enough that the lineage of a given individual is unlikely to survive, so the population is grazed by viruses down to a small seed population.
Fig 5. Growth rateμas a function of several parameters.A:μas a function ofρin Regimes I-III. Parameter
Discussion
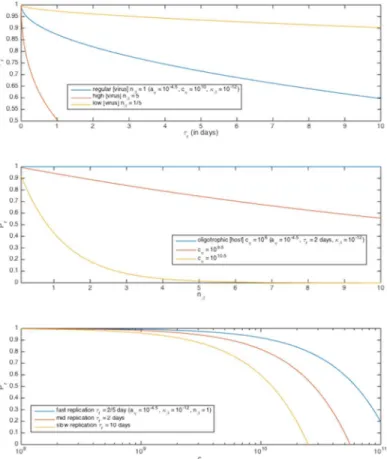
The above model investigates the impact of simultaneous bottom-up and top-down control on growth rate of generalized microbes, from an individual-mechanistic perspective. From it we can derive the expected probability of successful individual replicationPr(Fig 6) as a function
of host radiusaη, host concentrationcη, viral diffusivityκβ, number of viruses nearbynβ, and
host replication timescaleτr:
Pr ¼ ðprÞ
nb ¼ 1 :93a 2
Zpffiffiffiffiffiffiffiffikbtr
5 18
3
c 1
Z a3Z !nb
as well as an expression for a modified, individual lineage growth rate incorporating both nutri-ent uptake limitation and expected viral invasion limitation as a function of either the parame-ters used above or our initially described parameparame-ters. It suggests that receptor efficiencyρand host aggregation are key factors for understanding the dynamics involved, in addition to host, nutrient, and virus concentrations. Both expressions yield intuitively plausible parameter dependencies.
Fig 6. Total replication probabilityPras a function of several parameters.Parameter values given in
legends.
Beyond corroborating the findings of the studies which contextualize it, the model also sug-gests that co-limitation exerts influence on organisms at shorter timescales, i.e. those on the order of several doubling times of an organism’s lineage. We can draw several other suggestions from the model:
• Cases where organisms feel selection pressure to optimize towards co-limitation may only be felt in specific parameter ranges where concentrations of relevant viruses are significant, or hosts are tightly packed, subsequently increasing viral invasion risk—otherwise, receptor coverageρwill be determined by other, likely biochemical, factors. However, this model does suggest that this selection pressure can be felt at the individual scale, bridging the gap with previously suggested population-scale selection pressure. Both of these model implications are difficult to justify without mechanistic treatment presented here.
• Intermittency of viral concentration experienced by a population may be a process that sus-tains phenotypic diversity of receptor coverage, because differentρ-valued phenotypes will have superior growth rates in different viral conditions.
• Organisms which are capable of changing their active receptor coverage may be strongly advantaged by optimizing growth rate with respect toρas conditions fluctuate. Even if these organisms cannot detect cues that viruses are present, other cues such as infochemicals from nearby conspecifics (indicating aggregation) or increases in local nutrient concentration (because presumably nutrient concentration will be correlated with host aggregation) may be used to, perhaps counterintuitively,decreaseρvalues so as to maximize growth rate by mini-mizing risk of viral invasion.
• The model suggests that viral top-down control can exert selective influence on populations at very short timescales, via differential grazing; parasite-host models often consider bottom-up factors to drive selection on long timescales, so this suggests a plausible disjoint range of times on which top-down pressure can still be significant [57].
• As the above function forμis very sensitive to parameters inside the logarithm, i.e.C, it indi-cates that in logarithmic space there is a relatively narrow range where viruses can both exert influence on host growth and not kill off the bulk of the population. This range largely over-laps with ranges found for oceanic viruses, which may to a limited extent explain the magni-tude of their distribution in marine environments.
While co-limitation by multiple nutrients is common in many ecosystems [30,58,59,60], population co-limitation does not equate to co-limitation of individuals [30], and the impact of viruses invading through a particular nutrient’s receptor can only serve to drive down or keep the same the receptor coverage for that nutrient; thus it is unclear that considering multiple nutrients in the model above would allow the gleaning of any new results or additional rele-vance. However, it may be interesting to investigate the impact of motility or shear, i.e. increas-ing Sherwood number, on the model, or the impact of viral mortality; note that in the above model the viruses live forever, but a possibility of viral death modifying the Lévy distribution might change the above expression forPr. Other factors worth further consideration that may
intersect with the model could be the impact of Michaelis-Menten kinetics, relationships of replication and invasion timescales with invsasion-to-lysing timescales, and mechanisms which may increase or decrease the colocation of viruses, hosts, and nutrients.
Supporting Information
S1 File. Supplementary Data.Data as reported in table, taken from references, used to deter-mine ranges of model parameters, as a.csv file.
(CSV)
Acknowledgments
It is a pleasure to thank Roman Stocker for valuable advice with regards to this work and the encouragement to publish it, and Ariele Affigne for illustrated figures.
Author Contributions
Conceived and designed the experiments: BC. Performed the experiments: BC. Analyzed the data: BC. Contributed reagents/materials/analysis tools: BC. Wrote the paper: BC.
References
1. Field CB, Behrenfeld MJ, Randerson JT, Falkwoski P. Primary production of the biosphere: integrating terrestrial and oceanic components. Science 281.5374 (1998: ): 237–240. doi:10.1126/science.281. 5374.237
2. Falkowski P. The role of phytoplankton photosynthesis in global biogeochemical cycles. Photosynthe-sis Research 39.3 (1994: ): 235–258. doi:10.1007/BF00014586
3. Martin JH, Coale KH, Johnson KS, Fitzwater SE, Gordon RM, Tanner SJ et al. Testing the iron hypothe-sis in ecosystems of the equatorial Pacific Ocean. Nature 371 (1994) 123–129.
4. Price NM, Ahner BA, Morel FMM. The equatorial Pacific Ocean: Grazer-controlled phytoplankton popu-lations in an iron-limited ecosystem. Limnology and Oceanography 39.3 (1994: ): 520–534. doi:10. 4319/lo.1994.39.3.0520
5. Strom SL, Macri EL, Olson MB. Microzooplankton grazing in the coastal Gulf of Alaska: Variations in top-down control of phytoplankton. Limnology and Oceanography 52.4 (2007: ): 1480–1494. doi:10. 4319/lo.2007.52.4.1480
6. Suttle CA. Marine viruses—major players in the global ecosystem. Nature Reviews Microbiology 5.10 (2007: ): 801–812. doi:10.1038/nrmicro1750
7. Kiørboe T. How zooplankton feed: mechanisms, traits and trade-offs. Biological Reviews 86.2 (2011: ): 311–339.
8. Beardall J, Young E, and Roberts S. Approaches for determining phytoplankton nutrient limitation. Aquatic Sciences 63.1 (2001: ): 44–69. doi:10.1007/PL00001344
9. Weitz JS, Wilhelm SW. Ocean viruses and their effects on microbial communities and biogeochemical cycles. F1000 biology reports 4 (2012).
10. Proctor LM, Fuhrman JA. Viral mortality of marine bacteria and cyanobacteria. Nature 343 (1990): 60– 62.
11. Suttle CA. Inhibition of photosynthesis in phytoplankton by the submicron size fraction concentrated from seawater. Marine Ecology Progress Series 87 (1992): 105–105.
12. Wilhelm SW, Suttle CA. Viruses and Nutrient Cycles in the Sea. Bioscience 49.10 (1999: ): 781–788. doi:10.2307/1313569
13. Danovaro R, Corinaldesi C, Dell’Anno A, Fuhrman JA, Middelburg JJ, Nobel RT et al. Marine viruses and global climate change. FEMS microbiology reviews 35.6 (2011: ): 993–1034. doi: 10.1111/j.1574-6976.2010.00258.x
14. Thingstad TF. Elements of a theory for the mechanisms controlling abundance, diversity, and biogeo-chemical role of lytic bacterial viruses in aquatic systems. Limnology and Oceanography 45.6 (2000: ): 1320–1328. doi:10.4319/lo.2000.45.6.1320
15. Weinbauer MG. Ecology of prokaryotic viruses. FEMS microbiology reviews 28.2 (2004: ): 127–181. doi:10.1016/j.femsre.2003.08.001
16. Sullivan MB, Waterbury JB, Chisolm SW. Cyanophages infecting the oceanic cyanobacterium Pro-chlorococcus. Nature 424.6952 (2003: ): 1047–1051. doi:10.1038/nature01929
18. Schneider H, Fsihi H, Kottwitz B, Mygind B, Bremer E. Identification of a segment of the Escherichia coli Tsx protein that functions as a bacteriophage receptor area. Journal of bacteriology 175.10 (1993: ): 2809–2817.
19. Gehring K, Charbit A, Brissaud E, Hofnung M. Bacteriophage lambda receptor site on the Escherichia coli K-12 LamB protein. Journal of bacteriology 169.5 (1987: ): 2103–2106.
20. Bohm J, Lambert O, Frangakis AS, Letellier L, Baumeister W, Rigaud JL. FhuA-mediated phage genome transfer into liposomes: a cryo-electron tomography study. Current Biology 11.15 (2001: ): 1168–1175. doi:10.1016/S0960-9822(01)00349-9
21. Menge DNL, Weitz JS. Dangerous nutrients: evolution of phytoplankton resource uptake subject to virus attack. Journal of theoretical biology 257.1 (2009: ): 104–115. doi:10.1016/j.jtbi.2008.10.032
22. Weitz JS, Hartman H, Levin SA. Coevolutionary arms races between bacteria and bacteriophage. Pro-ceedings of the National Academy of Sciences of the United States of America 102.27 (2005: ): 9535– 9540. doi:10.1073/pnas.0504062102
23. Chapman-McQuiston E, Wu XL. Stochastic receptor expression allows sensitive bacteria to evade phage attack. Part I: Experiments. Biophysical journal 94.11 (2008: ): 4525–4536. doi:10.1529/ biophysj.107.120212
24. Høyland-Kroghsbo NM, Maerkedahl RB, Svenningsen SL. A quorum-sensing-induced bacteriophage defense mechanism. MBio 4.1 (2013: ): e00362–12.
25. Murray AG, Jackson GA. Viral dynamics: A model of the effects size, shape, motion and abundance of single-celled planktonic organisms and other particles. Marine ecology progress series. Oldendorf 89.2 (1992: ): 103–116.
26. Son K, Guasto J, Cubillos-Ruiz A, Sullivan M, Stocker R. Viral video: Live imaging of virus-host encoun-ters. Bulletin of the American Physical Society 59 (2014).
27. Son K, Guasto J, Cubillos-Ruiz A, Sullivan M, Chisolm S, Stocker R. Visualizing viral transport and host infection. Bulletin of the American Physical Society 58 (2013).
28. Cussler EL. Diffusion: mass transfer in fluid systems. Cambridge university press, 2009.
29. Roland C, Grace JR, Weber ME. Bubbles, drops, and particles. Courier Corporation, 2005.
30. Harpole SW, Ngai JT, Cleland EE, Seabloom EW, Borer ET, Bracken MES, et al. Nutrient co-limitation of primary producer communities. Ecology Letters 14.9 (2011: ): 852–862. doi:10.1111/j.1461-0248. 2011.01651.x
31. Berg HC, Purcell E. Physics of chemoreception. Biophysical journal 20.2 (1977: ): 193. doi:10.1016/ S0006-3495(77)85544-6
32. Jennings BR, Parslow K. Particle size measurement: the equivalent spherical diameter. Proceedings of the Royal Society of London. Series A, Mathematical and Physical Sciences (1988: ): 137–149.
33. Mann NH. Phages of the marine cyanobacterial picophytoplankton. FEMS microbiology reviews 27.1 (2003: ): 17–34. doi:10.1016/S0168-6445(03)00016-0
34. Falkowski PG, Barber RT, Smetacek V. Biogeochemical controls and feedbacks on ocean primary pro-duction. Science 281.5374 (1998: ): 200–206. doi:10.1126/science.281.5374.200
35. Reynolds CS. The ecology of phytoplankton. Cambridge University Press, 2006.
36. Williams RG, Follows MJ. Ocean dynamics and the carbon cycle: Principles and mechanisms. Cam-bridge University Press, 2011.
37. Rothenberg E, Sepulveda LA, Skinner SO, Zeng L, Selvin PR, Golding I. Single-virus tracking reveals a spatial receptor-dependent search mechanism. Biophysical journal 100.12 (2011: ): 2875–2882. doi: 10.1016/j.bpj.2011.05.014
38. Clausznitzer D, Micali G, Neumann S, Sourjik V, Endres RG (2014) Predicting Chemical Environments of Bacteria from Receptor Signaling. PLoS Comput Biol 10(10) doi:10.1371/journal.pcbi.1003870 PMID:25340783
39. Kirchman DL, ed. Microbial ecology of the oceans. Vol. 36. John Wiley and Sons, 2010.
40. Bienfang PK, Harrison PJ. Co-variation of sinking rate and cell quota among nutrient replete marine phytoplankton. Mar. Ecol. Prog. Ser 14 (1984): 297–300.
41. McCarthy JJ, Goldman JC. Nitrogenous nutrition of marine phytoplankton in nutrient-depleted waters. Science 203.4381 (1979: ): 670–672. doi:10.1126/science.203.4381.670
42. Cotton FA, Wilkinson G. Advanced inorganic chemistry. Vol. 5. New York: Wiley, 1999.
43. Maranger R, Bird DF. Viral abundance in aquatic systems: a comparison between marine and fresh waters. Marine ecology progress series. Oldendorf 121.1 (1995: ): 217–226.
45. Payet JP, Suttle CA. Physical and biological correlates of virus dynamics in the southern Beaufort Sea and Amundsen Gulf. Journal of Marine Systems 74.3 (2008: ): 933–945.
46. Boras JA, Sala MM, Vazquez-Dominguez E, Weinbauer MG, Vaque D. Annual changes of bacterial mortality due to viruses and protists in an oligotrophic coastal environment (NW Mediterranean). Envi-ronmental microbiology 11.5 (2009: ): 1181–1193. doi:10.1111/j.1462-2920.2008.01849.x
47. Guixa-Boixereu N, Lysnes K, Pedrós-Alió C. Viral lysis and bacterivory during a phytoplankton bloom in a coastal water microcosm. Applied and environmental microbiology 65.5 (1999: ): 1949–1958.
48. Corinaldesi C, Crevatin E, Del Negro P, Marini M, Russo A, Fonda-Umani S et al. Large-scale spatial distribution of virioplankton in the Adriatic Sea: testing the trophic state control hypothesis. Applied and Environmental Microbiology 69.5 (2003: ): 2664–2673. doi:10.1128/AEM.69.5.2664-2673.2003
49. Karp-Boss L, Boss E, Jumars PA. Nutrient fluxes to planktonic osmotrophs in the presence of fluid motion. Oceanography and Marine Biology 34 (1996): 71–108.
50. Bansal PP, Ardell AJ. Average nearest-neighbor distances between uniformly distributed finite parti-cles. Metallography 5.2 (1972: ): 97–111. doi:10.1016/0026-0800(72)90048-1
51. Chandrasekhar S. Stochastic problems in physics and astronomy. Reviews of Modern Physics 15 (1943) 1.
52. Schrodinger E. Zur theorie der fall-und steigversuche an teilchen mit brownscher bewegung. Physika-lische Zeitschrift 16 (1915): 289–295.
53. Redner S. A guide to first-passage processes. Cambridge University Press, 2001.
54. May RM. Stability and complexity in model ecosystems. Vol. 6. Princeton University Press, 2001.
55. Stocker R. Marine microbes see a sea of gradients. Science 338.6107 (2012: ): 628–633. doi:10.1126/ science.1208929
56. Stocker R, Seymour J, Hunt D, Samandi A, Polz M. Rapid chemotactic response enables marine bacte-ria to exploit ephemeral microscale nutrient patches. Proceedings of the National Academy of Sciences 105.11 (2008: ): 4209–4214. doi:10.1073/pnas.0709765105
57. Rosenzweig ML, MacArthur R. Graphical representation and stability conditions of predator-prey inter-actions. American Naturalist (1963: ): 209–223.
58. Price NM, Morel FMM. Colimitation of phytoplankton growth by nickel and nitrogen. Limnology and Oceanography 36.6 (1991: ): 1071–1077. doi:10.4319/lo.1991.36.6.1071
59. North RL, Guilford SJ, Smith REH, Havens SM, Twiss MR. Evidence for phosphorus, nitrogen, and iron colimitation of phytoplankton communities in Lake Erie. Limnology and Oceanography 52.1 (2007: ): 315–328. doi:10.4319/lo.2007.52.1.0315
![Table 1 displays observationally derived value ranges for the above parameters in various marine ecosystems [32–48]](https://thumb-eu.123doks.com/thumbv2/123dok_br/18304118.348015/3.918.302.686.118.425/table-displays-observationally-derived-ranges-parameters-various-ecosystems.webp)