http://dx.doi.org/10.1590/bjb.2014.0077 Original Article
Evaluation of abundance indexes in open population studies: a
comparison in populations of small mammals in southern Brazil
Graipel, ME.
a*
, Hernández, MIM.
aand Salvador, C.
baDepartamento de Ecologia e Zoologia, Universidade Federal de Santa Catarina – UFSC, Campus Universitário, s/n, Córrego Grande, CEP 88040-970, Florianópolis, SC, Brazil
bCaipora Cooperativa, Av. Desembargador Vitor Lima, 260, Ed. Madson Center, 513, Carvoeira, CEP 88040-400, Florianópolis, SC, Brazil
*e-mail: [email protected]
Received: June 29, 2012 – Accepted: April 16, 2013 – Distributed: August 31, 2014
(With 5 figures)
Abstract
Many manuscripts comparing populations and/or analysing the structure of animal communities use indexes of captures as synonymous of abundance. However, the basic methods more suitable to this assumption - probabilistic estimates based on equal capture probability - have not been considered. In this study, the deviations caused by different types of capture indexes are compared with a common probabilistic population estimator (Cormack-Jolly-Seber). The analyses showed that Minimum Number Known Alive (MNKA) and the number of individuals showed greater association with the population estimator than with non-probabilistic indexes based on recaptures. Therefore, none of the indexes presented the same performance to estimate population size estimation which can lead to ecological misinterpretation. Some recommendations were also described.
Keywords: Cormack-Jolly-Seber, MNKA, number of individuals, total captures, capture success.
Avaliação de índices de abundância em estudos de populações abertas: uma
comparação em populações de pequenos mamíferos do sul do Brasil
Resumo
Muitos estudos comparam populações e/ou analisam a estrutura de comunidades animais usando índices de captura como se fossem sinônimos de abundância. No entanto, os métodos mais adequados considerando o pressuposto - estimativas probabilísticas baseadas na igualdade da probabilidade de capturas - não têm sido considerados. Neste estudo, os desvios causados por diferentes tipos de índices de captura são comparados com um dos mais comuns estimadores populacionais probabilísticos (Cormack-Jolly-Seber). As análises mostraram que o número mínimo de animais conhecidos vivos (MNKA) e o número de indivíduos apresentaram maior associação com o estimador populacional do que com os índices não probabilísticos baseados em recapturas. Entretanto, nenhum dos índices apresentou o mesmo desempenho do estimador populacional o que pode levar a interpretações equivocadas. Algumas recomendações foram também descritas.
Palavras-chave: Cormack-Jolly-Seber, MNKA, número de indivíduos, capturas totais, sucesso de captura.
1. Introduction
The estimation of population abundance is a fundamental parameter in ecology, but as the full count of individuals is usually impractical or impossible, in many cases probabilistic estimates have been considered more appropriate than a simple count or indices of abundance (Nichols, 1986). These simple count based estimates are non-probabilistic and they are considered rather naive (e.g., Dood Junior and Dorazio, 2004; Kéry et al., 2010; Mackenzie et al., 2003; Mackenzie and Bailey, 2004; Mackenzie and Kendall, 2002; Williams, et al., 2002). After more than one decade of experience as peer reviewers, we see, however, that they are still common in neotropical populations studies
(Fernandez, 1995). A comparison of the most common naive and probabilistic estimations can thus contribute to ecology in the neotropics.
This probability can be related to behavioural factors, such as the animal response to the trap by either learning to return or to avoid them; as well as methodological ones, such as the trap size, the bait type according to either the diet of each species or to environmental food availability, and even the sampling design by selecting habitats and size area. All the responses can thus vary also through time, species and population heterogeneity, such sex and age of individuals (see Begon, 1979; Fernandez, 1995; Jolly and Dickson, 1983; Monteiro-Filho and Graipel, 2006). Therefore, the more diverse the biological group, the more important the probabilistic estimates. This is the issue in small mammals studies due to their high diversity (Nichols, 1986), and even more important in a high diversity region like the Neotropics.
The problem of time variation on detection probability and therefore on abundance estimates can be reduced by applying closed population designs and these models have been greatly improved more recently (Otis et al., 1978). Closed population means the abundance does not change during the study and that there are no known changes by recruitment (e.g., birth or emigration) or losses (e.g., death or immigration). This assumption is hard to meet but it can be assumed by reducing the time series intervals which can provide great power for population estimates (Otis et al., 1978). Nevertheless, the difference between open and closed population is artificial and both models can be applied in the same study design taking the advances of both models (Pollock, 1982). This models combination is known as robust design.
On the other hand, there are difficulties in the application of probabilistic models for closed populations because they require more data and cannot be used in many cases (Gentile and Fernandez, 1999). Open population models are then preferred, especially the deterministic ones (e.g. MNKA) as a measure of abundance instead of probabilistic models such as Cormack-Jolly-Seber, the most important open population model for population estimates. This model is considered less biased than MNKA (Nichols and Pollock, 1983; Jolly and Dickson, 1983).
Behind all those issues for less biased population estimates and development of more robust studies is the detection probability which is not accounted for in MNKA as well as in the other estimates called deterministic like index based on simple count or unit of effort. The deterministic estimates have the assumption of equal detection probability on time, individuals and behaviour. This is an assumption even more difficult to assume in natural populations. Detection can be estimated with a capture history after a series of capture, mark and recapture of individuals. The probabilistic model allows the estimate of population size of non-marked individuals. MNKA simply rather ignores one portion of the population, the non-marked individuals.
By observing the still growing naive population studies based on indexes of abundance, we aimed to perform an assessment of these methods for open population design with capture-recapture methods of small mammal studies with field data from southern Brazil. On behalf of the small
mammal population ecology in the Neotropical region, mainly in the Atlantic Forest hotspot, the comparison of the estimation method can help population ecologists and wild life managers to take the advantage of proper approaches and to increase the popularity of more robust probabilistic estimates (Nichols 1986; Nichols and Pollock 1983).This study presents an analysis of differences between the measures mentioned above and errors associated with their interpretations.
2. Material and Methods
2.1. Areas of study
The two independent areas of study were both covered by Atlantic Forest but with different vegetation classes (sensu Ribeiro et al., 2009), 200 km apart on the coast of Santa Catarina State, Southern Brazil.
The Volta Velha Private Reserve (VVPR; 26°04’05’’S and 48°37’30’’W) had 1,186 ha area in the continental part of Itapoá municipality. The study area was covered by dense forest of “restinga” vegetation class at sea level.
The Lagoa do Peri Municipal Park (LPMP; 27°43’S and 48°32’W) had approximately 1,500 ha area in the south of the 42,000 ha Santa Catarina island. The study area was covered also by dense forest, but of “forest” vegetation class located on the lower slopes, from 5 to 60 m elevation above sea level.
The regional climate with both study areas is mesothermic to super humid with ca. 1400-1800 mm total rainfall well distributed year-round and mean annual temperature of ca. 20.3 °C (Santa Catarina, 1986). The Köppen-Geiger climate classification is Cfa (Peel et al., 2007).
2.2. Field methods
The areas were sampled over four consecutive days/ month during a 24 month capture-recapture programme, from April 1998 to August 2001, detailed elsewhere (Graipel, 2003; Graipel et al., 2003, 2006). The trapping grids were tree high, i.e. traps set at ground, understory and canopy stratum. The grid at LPMP was 11 × 7 trap size (1.26 ha) and the VVPR grids were 10 x 10 traps (3.24 ha). Two trap sizes was used, a bigger (450 × 150 × 150 or 450 × 210 × 170 mm) and smaller (260 × 190 × 90 mm) one. Pieces of banana coated with peanut butter were used as bait. Captured animals were sexed, marked using combinations of ear holes or combinations of distal toe clipping, and released at the same location.
2.3. Methods of analysis
The population sizes were estimated using Cormack-Jolly-Seber (CJS) (Cormack, 1964; Jolly, 1965; Seber, 1965), considered one of the best probabilistic methods for open population (e.g., Nichols and Pollock, 1983). The CJS probabilistic estimation was compared with the following non-probabilistic indexes of abundance:
• Minimum Number Known Alive animals (MNKA – Krebs, 1966);
• number of individuals captured (NI); • total catches (TC);
• capture success (CS): CS = TC / SE;
where SE was the sampling effort (or number of trapnights) for each trap size and forest high.
• and the number of captures by individual (CI): CI = CT / NI
The probability of minimum capture or capturability (C) was estimated as described by Hilborn et al. (1976).
Due to the difference between estimations and indices, we used a ranking of each population in relation to the control method (CJS), allowing direct comparison between expected and observed ranking positions. For this purpose, the existence of deviations and the magnitude of deviations in relation to the expected position were considered. Additionally, we applied a Principal Component Analysis to assess the existence of associations between estimation and indexes and Pearson correlation between the population abundance estimated by Cormack-Jolly-Seber (CJS) and indexes based on catches and/or recaptures. This analyses was conducted in the Statistica for Windows program (StatSoft Inc., 1998).
3. Results
Considering the community of small mammals of VVPR, the MNKA had two deviations (between the third and fourth ranking position) and the NI had four deviations.
Table 1. Estimation and index of small mammal population (the ranking deviance position comparing the control estimation
method) after 24 month capture-recapture program, from September 1999 to August 2001 in Volta Velha Private Reserve, Southern Brazil. Acronyms: the control method [Cormack-Jolly-Seber (CJS)], Minimum Number Known Alive animals (MNKA), number of individuals (NI); total catches (TC); capture success (CS); catches by individual (CI); capturability (C).
Species/Indexes CJS MNKA NI CT SC CI C (%)
Akodon montensis Thomas, 1913 364.4 (1°) 315 (1°) 130 (2°) 629 (1°) 6.6 (1°) 4.8 (2°) 82
Euryoryzomys russatus (Wagner, 1848) 311.9 (2°) 274 (2°) 148 (1°) 360 (2°) 3.8 (2°) 2.4 (6°) 66
Juliomys sp. 174.2 (3°) 93 (4°) 58 (3°) 122 (5°) 0.6 (5°) 2.1 (7°) 46
Gracilinanus microtarsus (Wagner, 1842) 111.9 (4°) 95 (3°) 34 (5°) 136 (3°) 0.7 (3°) 4.0 (3°) 55
Nectomys squamipes (Brants, 1827) 99.8 (5°) 88 (5°) 35 (4°) 135 (4°) 0.7 (3°) 3.9 (4°) 67
Marmosa paraguayana (Tate, 1931) 49.4 (6°) 49 (6°) 16 (6°) 110 (6°) 0.5 (6°) 6.9 (1°) 83
Metachirus nudicaudatus (É. Geoffroy, 1803) 24.3 (7°) 21 (7°) 9 (7°) 34 (7°) 0.4 (7°) 3.8 (5°) 58
Table 2. Estimation and index of small mammal population (the ranking deviance position comparing the control estimation
method) after 24 month capture-recapture program, from April 1998 to March 2000 in Lagoa do Peri Municipal Park, Southern Brazil. Acronyms: the control method [Cormack-Jolly-Seber (CJS)], Minimum Number Known Alive animals (MNKA), number of individuals (NI); total catches (TC); capture success (CS); catches by individual (CI); capturability (C).
Species/Indexes CJS MNKA NI TC CS CI C (%)
Didelphis aurita Wied-Neuwied, 1826
258.0 (1°) 149 (2°) 56 (3°) 285 (1°) 14.8 (1°) 5.1 (3°) 43
Akodon montensis Thomas, 1913 243.8 (2°) 180 (1°) 73 (2°) 225 (3°) 3.2 (3°) 3.1 (6°) 62
Euryoryzomys russatus
(Wagner, 1848) 159.8 (3°) 142 (3°) 75 (1°) 228 (2°) 3.3 (2°) 3.0 (7°) 79
Sooretamys angouya
(G. Fischer 1814) 130.0 (4°) 99 (5°) 48 (4°) 158 (5°) 1.3 (5°) 3.3 (5°) 65
Oligoryzomys nigripes
(Olfers, 1818) 126.2 (5°) 104 (4°) 38 (5°) 105 (6°) 0.9 (6°) 2.8 (8°) 65
Nectomys squamipes
(Brants, 1827) 83.7 (6°) 75 (6°) 31 (6°) 199 (4°) 2.8 (4°) 6.4 (2°) 79
Marmosa paraguayana
(Tate, 1931) 83.3 (7°) 66 (7°) 21 (7°) 89 (7°) 0.7 (8°/9°) 4.2 (4°) 69
Oxymycterus judex Thomas,
1909
74.0 (8°) 48 (8°) 21 (7°/8°) 54 (8°) 0.8 (7°) 2.6 (9°) 50
Lutreolina crassicaudata
The TC and the CS had three shifts positions each, though varied in up to two positions and the number of CI was not matched in any position with the expected rank, ranging up to five positions (Table 1).
In the LPMP, the MNKA had four standard deviations in the ranking position (between the first and second, and the fourth and fifth positions). The NI presented two deviations in the ranking position.
The TC and the CS had five and seven deviations, respectively, and they deviated up to two positions. There was no difference between the eighth and ninth of CS ranking positions. The CI did not coincide in any position in the comparative ranking, and its deviation reached up to eight positions in the ranking (Table 2).
The correlation matrix among the calculated data for the species of small mammals of VVPR pointed to a highly significant association among CJS, MNKA and NI; among MNKA, TC and CS (p ≤ 0.01); and among between CJS and TC, and CJS and CS (p ≤ 0.01), and a significant level between NI and TC, and NI and CS (p ≤ 0.05) (Table 3). There was no correlation between CI and other measures. In the PMPL, a similar pattern was noted, with highly significant correlation values between CJS and MNKA, between MNKA and NI (p ≤ 0.01), and between CJS and NI, and CJS and TC, between MNKA and TC, NI and TC (p ≤ 0.01), and a significant level between CJS and CS and between TC and CS (p ≤ 0.05) (Table 4). There was no correlation among CS and MNKA and NI, and again between CI and other measures.
Throughout the analysis of both the community of mammals, it was noted that the first component (Factor 1) was primarily related to capture behaviour (recaptures),
distinguishing the CI from the other variables. The second component (Factor 2) was associated with capturability.
The estimate of CJS and other indexes, except CI, were highly correlated with each other in relation to Factor 1, indicating a strong relationship between these variables in both small mammals community (Figure 1 and 2). Factor 2 made a distinction between the variables, but once again CI was the more discordant index.
For the VVPR data, the first component had an eigenvalue of 4.8, accounting for 80.0% of variance, and for the second
Table 3. Correlation matrix (Pearson) between the population abundance estimated by Cormack-Jolly-Seber (CJS) and
by indexes based on catches and/or recaptures: Minimum Number Known Alive animals (MNKA), number of individuals (NI); total catches (TC); capture success (CS); catches by individual (CI) of a community of small mammals of Volta Velha
Private Reserve.
Estimation-Indexes CJS MNKA NI TC CS
MNKA 0.98**
NI 0.97** 0.97**
TC 0.93** 0.96** 0.87*
CS 0.92** 0.95** 0.87* 0.99**
CI –0.30 –0.19 –0.35 0.02 0.00
*p ≤ 0.05. **p ≤ 0.01.
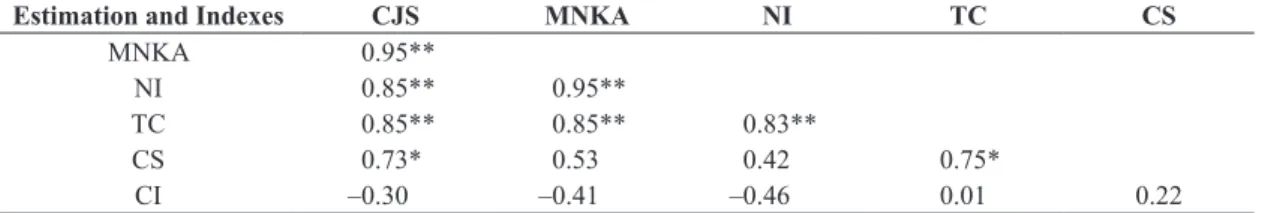
Table 4. Correlation matrix (Pearson) between the population abundance estimated by Cormack-Jolly-Seber (CJS) and by
indexes based on catches and/or recaptures: Minimum Number Known Alive animals (MNKA), number of individuals (NI); total catches (TC); capture success (CS); catches by individual (CI) of a community of small mammals of Lagoa do Peri
Municipal Park.
Estimation and Indexes CJS MNKA NI TC CS
MNKA 0.95**
NI 0.85** 0.95**
TC 0.85** 0.85** 0.83**
CS 0.73* 0.53 0.42 0.75*
CI –0.30 –0.41 –0.46 0.01 0.22
*p ≤ 0.05. **p ≤ 0.01.
Figure 1. Principal Component Analysis of
Cormack-Jolly-Seber’s estimation (CJS) and indexes based on catches and/
or recaptures of a community of small mammals of Volta Velha Private Reserve. Recapture Behaviour = Factor 1, and Capturability = Factor 2. Minimum Number Known Alive
Figure 2. Principal Component Analysis of
Cormack-Jolly-Seber’s estimation (CJS) and indexes based on catches and/
or recaptures of a community of small mammals of Lagoa do Peri Municipal Park. Recapture Behaviour = Factor 1, and Capturability = Factor 2. Minimum Number Known
Alive animals (MNKA), number of individuals (NI); total catches (TC); capture success (CS); catches per individual (CI).
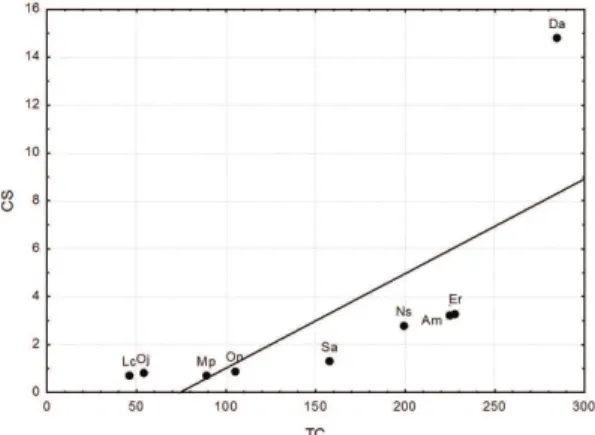
Figure 3. Pearson correlation between total catches (TC)
and capture success (CS) for the populations of small
mammals from Lagoa do Peri Municipal Park, Southern Brazil. Da = Didelphis aurita; Am = Akodon montensis; Er = Euryoryzomys russatus; Sa = Sooretamys angouya; On = Oligoryzomys nigripes; Ns = Nectomys squamipes; Mp = Marmosa paraguayana; Oj = Oxymycterus judex; Lc = Lutreolina crassicaudata.
Figure 4. Pearson correlation between the
Cormack-Jolly-Seber’s estimation (CJS) and the Minimum Number Known Alive animals (MNKA) for populations of small mammals
of Volta Velha Private Reserve. Am = Akodon montensis; Er = Euryoryzomys russatus; Gm = Gracilinanus microtarsus; Ns = Nectomys squamipes; Mp = Marmosa paraguayana; Mn = Metachirus nudicaudatus; Jsp = Juliomys sp. component an eigenvalue of 1.1, accounting for 18.3% of
total variance. For LPMP data, the first component had an eigenvalue of 4.18, accounting for 69.7% of variance, and the second component an eigenvalue of 1.35, accounting for 22.6% of the total variance.
It was also possible to notice greater proximity between the CJS (as expected for a probabilistic estimator that considers capturability) with the partially corrected MNKA, and between these and the NI, without any type of correction in relation to capturability. However, both MNKA and NI were not dependent on number of recaptures within each of the sampling periods, rather than TC, CS and CI, which were negative dependent to the capturability factor (Figures 1 and 2).
The lower correlation between TC and CS was expected in LPMP (Figure 3), since D. aurita was the most abundant species, as obtained by CJS (see Table 2), due to catches and recaptures occurring only in large traps installed in soil (27% of traps installed in the ground), while in VVPR no minor correlation for any species was noticed, in function of differential catches due to size or model of trap used.
The species Juliomys sp. in VVPR had the lowest capturability and also accounted for the greatest deviation from the expected abundance, when the association between CJS and the index considered as less wrong (MNKA) was verified (Table 1, Figure 4). Similarly, the smallest and the largest capturability observed in LPMP, D. aurita and
Euryoryzomys russatus, respectively, were responsible for the largest deviations (Table 2, Figure 5).
4. Discussion
The variation in interpretation of CJS´s estimates and indexes based on catches and/or recaptures for the seven populations of VVPR and the nine populations of small
mammals of LPMP demonstrated the importance of the main assumption, i.e. the equal detection probability. When this assumption is not applied, it can produce misinterpretations by comparing population size between species, as expected (Nichols, 1986).
influenced by the behaviour of individuals, which may be related, among other factors, to their learning ability to return or avoid the traps, to tagging effects, or bait attraction depending on food availability in the environment (Begon, 1979; Fernandez, 1995; Jolly and Dickson, 1983; Monteiro-Filho and Graipel, 2006).
Population size estimates are considered more robust throughout closed population estimation methods and it should be preferable (Otis et al., 1978; Pollock, 1982). However, it was not our situation. Before all analysis presented here, we have tried to estimate abundance with close population approaches (Otis et al., 1978) but the results were feasible for even fewer species, probably because they require larger numbers of individuals with more recaptures (Fernandez, 1995; Mckelvey and Pearson, 2001). The non-probabilistic estimations should be the last options, but the MNKA could be an alternative only to those species without enough data (Nichols, 1986). We thus suggest developing a robust design (Pollock, 1982) to sample population and compare the abundance based on closed population estimation when possible, or on any other probabilistic open one as preferred.
Acknowledgements
The first author thanks Ivo R. Ghizoni Jr., Claudio R. Graipel, Marcos Azevedo, Jorge Cherem, Rafael Reinicke and the undergraduate students from UFSC for their help in fieldwork. Luiz Glock, Emygdio Monteiro-Filho and Nilton Cáceres for the discussions at each stage of this research. This research was partially funded by the PICDT/CAPES program for the first author and Productivity in Research/ CNPq (process 303800/2010-0) for the second author.
References
BEGON, M., 1979. Investigating animal abundance: capture-recapture for biologists. London: Edward Arnold.
CORMACK, RM., 1964. Estimates of survival from the sighting of marked animals.Biometrika, vol. 51, no. 3/4, p. 429-438. http:// dx.doi.org/10.2307/2334149.
DODD-JUNIOR, CK. and DORAZIO, RM., 2004. Using counts to simultaneously estimate abundance and detection probabilities in a salamander community.Herpetologica, vol. 60, no. 4, p. 468-478. http://dx.doi.org/10.1655/03-60.
FERNANDEZ, FAS., 1995. Métodos para estimativas de parâmetros populacionais por captura, marcação e recaptura.Oecologia Brasiliensis, vol. 2, no. 1, p. 1-26. http://dx.doi.org/10.4257/ oeco.1995.0201.01.
GENTILE, R. and FERNANDEZ, FAS., 1999. A field comparison of two capture-mark-recapture estimators of small mammal populations.Revista Brasileira de Zoologia, vol. 16, no. 4, p. 1109-1114. http://dx.doi.org/10.1590/S0101-81751999000400020.
GRAIPEL, ME., 2003. A simple ground-based method for trapping small mammals in the forest canopy.Mastozoologia Neotropical, vol. 10, no. 1, p. 177-181.
GRAIPEL, ME., CHEREM, JJ., MILLER, PRM. and GLOCK,
L., 2003. Trapping small mammals in the forest understory: a
comparison of three methods.Mammalia, vol. 67, no. 4, p. 551-558. http://dx.doi.org/10.1515/mamm-2003-0409.
GRAIPEL, ME., CHEREM, JJ., MONTEIRO-FILHO, ELA. and GLOCK, L., 2006. Dinâmica populacional de marsupiais e roedores no Parque Municipal da Lagoa do Peri, Ilha de Santa Catarina, Sul do Brasil.Mastozoologia Neotropical, vol. 13, no. 1, p. 31-49.
HILBORN, R., REDFIELD, JA. and KREBS, CJ., 1976. On the reliability of enumeration for mark and recapture census of voles. Canadian Journal of Zoology, vol. 54, no. 6, p. 1019-1024. http:// dx.doi.org/10.1139/z76-114.
JOLLy, GM., 1965. Explicit estimates from capture-recapture data with both death and immigration-stochastic model.Biometrika, vol. 52, no. 1/2, p. 225-247. http://dx.doi.org/10.2307/2333826. PMid:14341276
JOLLy, GM. and DICKSON, JM., 1983. The problem of unequal catchability in mark-recapture estimation of small mammal populations.Canadian Journal of Zoology, vol. 61, no. 4, p. 922-927. http://dx.doi.org/10.1139/z83-121.
KéRy, M., GARDNER, B. and MONNERAT, C., 2010. Predicting species distributions from checklist data using site-occupancy models.Journal of Biogeography, vol. 37, no. 10, p. 1851-1862.
KREBS, CJ., 1966. Demographic changes in fluctuating populations of Microtus californicus.Ecological Monographs, vol. 36, no. 3, p. 239-273. http://dx.doi.org/10.2307/1942418.
MACKENZIE, DI. and BAILEy, LL., 2004. Assessing the fit of site-occupancy models.Journal of Agricultural Biological & Environmental Statistics, vol. 9, no. 3, p. 300-318. http://dx.doi. org/10.1198/108571104X3361.
MACKENZIE, DI., NICHOLS, JD., HINES, JE., KNuTSON, MG. and FRANKLIN, AB., 2003. Estimating site occupancy, colonization, and local extinction when a species is detected imperfectly.Ecology, vol. 84, no. 8, p. 2200-2207. http://dx.doi. org/10.1890/02-3090.
Figure 5. Pearson correlation between the
Cormack-Jolly-Seber’s estimation (CJS) and the Minimum Number Known Alive animals (MNKA) for populations of small mammals
MACKENZIE, DI. and KENDALL, WL., 2002. How should detection probability be incorporated into estimates of relative abundance?Ecology, vol. 83, no. 9, p. 2387-2393. http://dx.doi.
org/10.1890/0012-9658(2002)083[2387:HSDPBI]2.0.CO;2.
MCKELVEy, KS. and PEARSON, DE., 2001. Population estimation with sparse data: the role of estimators versus indices revisited.Canadian Journal of Zoology, vol. 79, no. 10, p. 1754-1765. http://dx.doi.org/10.1139/z01-139.
MONTEIRO-FILHO, ELA. and GRAIPEL, ME.,2006. Captura
e Marcação. In CÁCERES, NC. and MONTEIRO-FILHO, ELA. (Eds). Os marsupiais do Brasil, Biologia, Ecologia e Evolução. Campo Grande: Editora UFMS. p. 17-27.
NICHOLS, JD., 1986. On the Use of Enumeration Estimators for
Interspecific Comparisons, with Comments on a ‘Trappability’
Estimator.Journal of Mammalogy, vol. 67, no. 3, p. 590-593. http://dx.doi.org/10.2307/1381295.
NICHOLS, JD. and POLLOCK, KH., 1983. Estimation methodology in contemporary small mammal capture-recapture studies. Journal of Mammalogy, vol. 64, no. 2, p. 253-260. http://dx.doi. org/10.2307/1380555.
OTIS, D., BURNHAM, K. and WHITE, G., 1978. Statistical inference from capture data on closed animal populations.Wildlife Monographs, vol. 62, no. 10, p. 3-135.
PEEL, MC., FINLAySON, BL. and MCMAHON, TA., 2007.
updated world map of the Köppen-Geiger climate classification.
Hydrology and Earth System Sciences Discussions Discussions, vol. 4, no. 2, p. 439-473. http://dx.doi.org/10.5194/hessd-4-439-2007.
POLLOCK, KH., 1982. A capture-recapture design robust to unequal probability of capture.The Journal of Wildlife Management, vol. 46, no. 3, p. 752-757. http://dx.doi.org/10.2307/3808568.
RIBEIRO, MC., METzGER, JP., MARTENSEN, AC., PONZONI, FJ. and HIROTA, MM., 2009. The Brazilian Atlantic Forest: How much is left, and how is the remaining forest distributed? Implications for conservation.Biological Conservation, vol. 142, no. 6, p. 1141-1153. http://dx.doi.org/10.1016/j.biocon.2009.02.021.
SANTA CATARINA. Gabinete de Planejamento e Coordenação Geral – GAPLAN, 1986. Atlas de Santa Catarina. Rio de Janeiro.
SEBER, GAF., 1965. A Note on the Multiple-Recapture Census.Biometrika, vol. 52, no. 1/2, p. 249-259. http://dx.doi. org/10.2307/2333827. PMid:14341277
STATSOFT INC., 1998. Statistica for Windows. Tulsa.