YIELD COMPONENTS AND MORPHOGENESIS OF ARUANA
GRASS IN RESPONSE TO NITROGEN SUPPLY
José Lavres Jr.1; Maria Del Carmen Ferragine2; Luciana Gerdes2; Roberto Wagner Cavalcanti Raposo3; Michelle Nazaré Xavier da Costa2; Francisco Antonio Monteiro4*
1
USP/CENA - Programa de Pós-Graduação em Energia Nuclear na Agricultura, C.P. 96 - 13416-000 - Piracicaba, SP - Brasil.
2
USP/ESALQ - Programa de Pós-Graduação em Ciência Animal e Pastagens. 3
UFCG/CCT - Depto. de Engenharia Agrícola, C.P. 10.087 - 58109-970 - Campina Grande, PB - Brasil. 4
USP/ESALQ - Depto. de Solos e Nutrição de Plantas, C.P. 09 - 13418-900 - Piracicaba, SP - Brasil. *Corresponding author <[email protected]>
ABSTRACT: Areas with Aruana grass (Panicum maximum Jacq.) in Brazilian pastures, especially those used by sheep, have expanded due to yield and morphological characteristics of this grass that are favorable to these animals. Nevertheless, the knowledge concerning yield attributes of this grass in relation to nitrogen fertilization is very limited. The objective of this research was to evaluate yield and physiological attributes in this forage grass when grown in nutrient solutions containing N rates. The experiment was carried out in a greenhouse with plastic pots containing ground quartz as substrate, during the Spring season. Six N rates in the solution (14, 112, 210, 294, 378, and 462 mg L-1
), with 70% N-NO3
and 30% N-NH4+
were tested. Experimental units were set up in a completely randomized block design, with four replications.Plants were harvested at 35 days after the seedlings were transplanted to the pots and again at 28 days after the first harvest. After the second harvest, the roots were taken from the substrate. In both growing periods, dry matter yield for plant tops and roots, leaf area, number of expanded green leaves, number of tillers, leaf appearance rate, and phyllochron were significantly affected by the N rates, and the data were adjusted to a second-order model. Aruana grass required high rates of N to show maximum response in those variables. Key words: Panicum maximum, leaf area, phyllochron, leaves, tillering
COMPONENTES DE PRODUÇÃO E MORFOGÊNESE DO
CAPIM-ARUANA EM RESPOSTA AO NITROGÊNIO
RESUMO: No Brasil, as áreas de pastagens formadas com o capim-Aruana (Panicummaximum Jacq.), particularmente destinadas ao pastejo por ovinos, têm crescido devido às características produtivas e estruturais da gramínea, propícias à exploração destes rebanhos. Porém, o conhecimento do comportamento produtivo do capim-Aruana relacionado à adubação nitrogenada é escasso. Avaliaram-se atributos produtivos e fisiológicos desta gramínea forrageira, quando submetida a doses de N em solução nutritiva. O experimento foi conduzido em casa-de-vegetação, utilizando vasos contendo sílica como substrato, no período da primavera. Foram estudadas seis doses de N correspondentes a 14; 112; 210; 294; 378 e 462 mg L-1
, mantidas na proporção constante de 70%:30% entre N-NO3- e N-NH
4
+. O delineamento experimental foi o de blocos ao acaso, com
quatro repetições. As plantas foram colhidas aos 35 dias após o transplante das plântulas e aos 28 dias após o primeiro corte, procedendo-se nesta ocasião, a separação das raízes da sílica. A produção de massa seca da parte aérea e das raízes, a área foliar, o número de folhas verdes expandidas, o número de perfilhos, a taxa de aparecimento de folhas e filocrono no primeiro e segundo cortes, foram influenciados pelas doses de N, ajustando-se ao modelo quadrático de regressão. O capim-Aruana mostrou-se exigente ao fornecimento de N para expressar o seu máximo potencial nas variáveis analisadas.
Palavras-chave: Panicum maximum, área foliar, filocrono, folhas, perfilhamento
INTRODUCTION
Due to the large use and importance of the
spe-cies Panicum maximum Jacq. in livestock exploiting
ar-eas and established pastures in Brazil, several works have been conducted in the field of plant breed-ing, resulting in a number of cultivars introduced in the market, such as Centenário, Centauro, Tobiatã,
Vencedor, Aruana, and more recently, cultivars Tanzânia-1, Mombaça, and Massai (Jank, 1995; Pereira et al., 2001).
Numerous papers have reported the effect of N on the morphogenetic and structural characteristics of tropical forage grasses, such as brachiarias (notably
Brachiaria decumbens Stapf. and Brachiaria brizantha
as some Panicum maximum Jacq. cultivars, such as
Colonião, Tanzânia, and Mombaça. However, at present there is a lack of information with regard to the yield and morphophysiological behavior of some forage plants, in-cluding Aruana grass.
Aruana grass has been used especially in pastures intended for sheep exploration (Bianchini et al., 1999), since it is short-sized and has deserved attention because of its high capacity of emitting leaves and tillers, with new growth from a great number of basal buds after each grazing cycle. It is tolerant to intense grazing and has ex-cellent acceptability by the animals, and has a mean
an-nual dry mass yield that can be as high as 20 Mg ha-1
(Instituto de Zootecnia, 1989).
Cecato et al. (2000) reported a smaller leaf dry mass yield and total dry mass (stalks+leaves) of Aruana grass (despite greater tillering), when compared to culti-vars Centenário, Mombaça, Tanzânia, and Tobiatã, and
to P. maximum accessions K249 and KK8. Carvalho et
al. (2002) also reported smaller dry mass yield of Aruana grass tops in relation to cultivars Makueni, Mombaça, and Tanzânia. However, an observation must be made that the smaller yields presented by Aruana grass should not be attributed to less soil fertility requirements, but possibly to the same management adopted for cultivars with dis-tinct morphogenetic characteristics.
Some results have demonstrated the positive ef-fect of nitrogen fertilization on Aruana grass, such as those reported by Colozza et al. (2000), who verified an increase in dry mass yield of the plant tops and roots of plants, and in tillering, with supplied N. Cecato et al. (1994a; 1994b) also verified that dry mass yield of plant tops, as well as regrowth and tillering in Aruana grass were positively influenced by increased N rates. However, the knowledge about morphogenetic and yield characteristics of this grass as a response to N supplying is still incipient. Therefore, a greater understanding about the yield
poten-tial of this new P. maximum cultivar will provide support
for the adoption of management and fertilization strategies. The hypothesis upon which this work relied is
that P. maximum Jacq. cv. Aruana manifestly responds to
N, thus promoting morphogenetic and structural alterations. The present study had the objective of evaluating dry mass yield in the plant tops and roots of Aruana grass, leaf area and specific leaf area, quantifying the total number of tillers and unfolded green leaves, leaf appearance rate (and phyllochron), and the leaf blades:stalks+sheaths ratio.
MATERIAL AND METHODS
The experiment was carried out under greenhouse conditions, in Piracicaba, State of São Paulo, during the period between 04 October and 05 December, 2000. Aruana grass was submitted to six N rates (14, 112, 210,
294, 378, and 462 mg L-1) in a nutrient solution, while
keeping the N-NO3- : N-NH
4
+ ratio constant at 70%
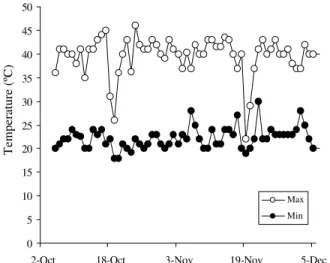
ni-trate and 30% ammonium. The solutions were prepared from a solution recommended by Sarruge (1975), modi-fied to satisfy the N rates. The experiment was set up as a randomized complete block design with four replica-tions. The maximum and minimum temperature data dur-ing the experimental period are presented in Figure 1.
Aruana grass seeds were placed to germinate on September 20, 2000, in plastic trays containing sand washed in running water and later in deionized water. Fif-teen seedlings were transplanted 14 days after sowing to individual plastic pots, 20.0 cm in diameter and with a 4.0 L capacity, containing ground quartz as substrate. Im-mediately after the seedlings were transplanted, 1.6 L of nutritive solution diluted to 25% of the corresponding rates were supplied. Initially, the solutions remained in the pots during the day and at night, and were circulated through the silica four times a day during a period of one week. After that week, the solutions were drained at night and supplied during the day, when they were circulated three times a day. Periodic thinnings were conducted un-til five plants per pot remained. The solutions contain-ing the effective N concentrations were used after the third day from seedling transplanting, and were renewed every ten days. The pots were rearranged within each block every three days.
Counts of the number of expanded green leaves were made for all plants present in each pot every three days, and the last totally expanded leaf (visible ligula) was marked. The leaf appearance rate (leaves/tiller.day) was calculated for five plants per pot, on six dates dur-ing the first growth of plants, and on eight dates in the second growth. Phyllochron (days/leaf) was calculated as the inverse of leaf appearance rate (Ferragine et al., 2001; Pinto et al., 1994; Skinner & Nelson, 1994). The num-ber of tillers and leaf area of Aruana grass plants were computed at the time of both harvests, and leaf area was determined with a digital area integrator system.
Figure 1 - Maximum and minimum temperature data during the experimental period.
0 5 10 15 20 25 30 35 40 45 50
2-Oct 18-Oct 3-Nov 19-Nov 5-Dec
Temperature (ºC)
The plants were cultivated in two growing peri-ods. The first harvest was done 35 days after the seed-lings were transplanted, at 3 cm from the plants’ root col-lar, while the second harvest (plants cut at the surface of the substrate), occurred 28 days after the first harvest. Im-mediately after the second harvest the roots were sepa-rated from the silica and washed in running water and deionized water, and recovered with two 0.25- and 1.00 mm sieves. In both harvests, the plant tops were sepa-rated into leaf blades and stalks plus sheaths.
The plant material collected in both harvests was dried in a forced air circulation oven, at a temperature of
65oC for 72 hours, and was later weighed with a
preci-sion balance.
The results were submitted to statistical analysis
using the statistical software SAS - System for Windows
6.11 (SAS Institute, 1996). The analysis of variance was carried out, and, based on the level of significance in the F test for the N rates, a regression study was done for the first and second degree components, through the GLM
pro-cedure. A means comparison test (Tukey, P < 0.05) was
carried out for leaf appearance rate and phyllochron. The correlations between variables dry mass yield in the plant tops (DMYPT), number of tillers (NT), number of ex-panded green leaves (EGL), leaf area (LA), leaf appear-ance rate (LAR), and phyllochron were obtained and tested
by the CORR procedure, using the SAS - System for
Win-dows 6.11 statistical program (SAS Institute, 1996).
RESULTS AND DISCUSSION
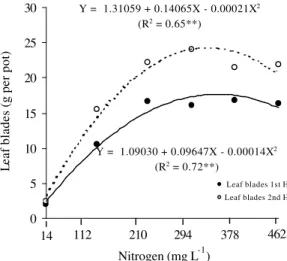
Aruana grass leaf blade yield, in the first and
sec-ond harvests, varied (P < 0.01) with the N rates in the
solution (Figure 2). The maximum leaf blade yields were
obtained with N rates of 344 and 335 mg L-1, respectively,
for the first and second harvests. As the N supplied in the solution increased, from the lowest rate to those
cor-responding to the maximum yields, in both harvests, in-creases in blade dry mass yield of 899 and 1,032% were verified for the first and second harvests, respectively, emphasizing the importance of N in the productive yield of these plants. Dry mass yield of stalks plus sheaths at the first and second harvests was influenced by N sup-ply, varying according to a quadratic regression model (Figure 3). The maximum yields occurred when the
nu-trient was supplied at 380 mg L-1 in the first harvest and
310 mg L-1 in the second. Colozza et al. (2000) and
Ferragine & Monteiro (1999) verified that dry mass yield for leaf blades and stalks plus sheaths varied with N rates in the first and second harvests of Aruana and signal grass
(Brachiaria decumbens Stapf. cv. Basilisk), respectively.
The leaf blades:stalks plus sheaths ratio was
in-fluenced (P < 0.01) by the N rate increases in the
solu-tion only in the first harvest (Figure 4), and changed ac-cording to a quadratic regression model, from 3.54 to 2.14 from the lowest to the highest N rate. Andrade et al. (2000) also verified a reduction of the leaf blades:stalks
Figure 2 - Aruana grass leaf blade dry mass yield in the first and second harvests as a function of N rates in the solution.
Y = 1.09030 + 0.09647X - 0.00014X2
(R2 = 0.72**)
Y = 1.31059 + 0.14065X - 0.00021X2
(R2 = 0.65**)
0 5 10 15 20 25 30
Nitrogen (mg L-1)
Leaf blades (g per pot)
Leaf blades 1st H Leaf blades 2nd H
462 378 294 210 112
14
Y = 0.32266 + 0.03796X - 0.00005X2
(R2 = 0.83**)
Y = 0.91737 + 0.19256X - 0.00031X2
(R2 = 0.73**)
0 5 10 15 20 25 30 35
Nitrogen (mg L-1)
Stalks + sheaths (g per pot)
S+S 1st H S+S 2nd H
14 112 210 294 378 462
Figure 3 - Aruana grass dry mass yield of stalks plus sheaths in the first and second harvests as a function of N rates in the solution.
Figure 4 - Aruana grass leaf blades : stalks plus sheaths ratio in the first harvest as a function of N rates in the solution.
Y = 3.43578 - 0.00638X + 0.0000008X2
(R2 = 0.83**)
2 3 4
Nitrogen (mg L-1)
Leaf blades : stalks + sheaths ratio
ratio in elephant grass (Pennisetum purpureum Schum cv.
Napier), related, however, to potassium fertilization in-crease. Increased forage yield, as a response to fertiliza-tion, results, among others factors, from an increase in stalk biomass, which is determinative of undesirable for-age quality alterations, such as decreased blades:stalks ratios (Gomide, 1994).
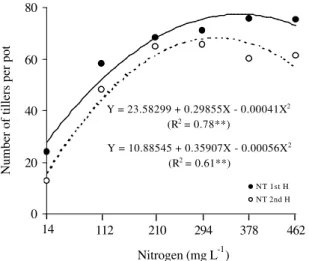
The number of tillers (NT) varied (P < 0.01)
qua-dratically with N rates in the first and second Aruana grass harvests (Figure 5). The maximum number of tillers
in the first harvest occurred at the N rate of 373 mg L-1
, while in the second harvest the maximum was verified
at the rate of 299 mg L-1.
When the points of maximum grass tillering in both harvests were compared, a superiority of 14% of the first harvest in relation to the second was verified, dif-ferently from what was reported by Colozza et al. (2000), who observed a greater number of tillers in the second harvest. This reduction in tiller density in the second har-vest, however, did not cause decreases in leaf area (Fig-ure 7) and in total number of expanded leaves (Fig(Fig-ure 6). The tiller appearance rate decreases as the leaf area in-dex (LAI) increases, as a consequence of both qualita-tive and quantitaqualita-tive reductions in the light that reaches the basal and axillary buds of plants (Simon & Lemaire, 1987). However, it is interesting to note that under pot growing conditions, there should be no restrictions for the penetration of light, and consequently for the induction of buds, which would develop into new tillers.
With regard to the number of expanded green
leaves (EGL), an effect of N supply (P < 0.01) in the
so-lution was observed in the first and second harvests (Fig-ure 6). The regression equations for expanded green leaf yield as a function of N rates were adjusted to the qua-dratic regression model, with maximum yields obtained
at N rates of 352 mg L-1 and 336 mg L-1 in the first and
second harvests, respectively.
Effects of N supply on total number of expanded green leaf in forage grasses were also reported by Benetti
et al. (1999) with Cynodon dactylon (L.) Pers. cv. Tifton
85, Schiavuzzo et al. (1999) with Marandu grass
(Brachiaria brizantha (A. Rich.) Stapf. cv. Marandu), as
well as by Garcez Neto et al. (2002) with Mombaça grass, thus expressing the photosynthetic potential of the canopy. The N supply effect on the increase of the total numbers of leaves and green leaves per tiller is also as-sociated with the reduced senescence of these organs, contributing to a longer life of the leaf (greater photo-synthetic capacity for longer periods due to limited N re-distribution toward younger tissues).
The N rates promoted Aruana grass leaf area
(LA) increases (P < 0.01) in both harvests (Figure 7). The
points of maximum leaf area were obtained with the
sup-plying of N rates of 400 mg L-1 in the first harvest and
338 mg L-1
in the second. When the points of maximum leaf area in both harvests were compared, a 28% increase
Figure 5 - Number of Aruana grass tillers per pot in the first and second harvests as a function of N rates in the solution.
Y = 10.88545 + 0.35907X - 0.00056X2
(R2 = 0.61**)
Y = 23.58299 + 0.29855X - 0.00041X2
(R2 = 0.78**)
0 20 40 60 80
Nitrogen (mg L-1)
Number of tillers per pot
NT 1st H NT 2nd H
14 112 210 294 378 462
Figure 6 - Number of Aruana grass expanded green leaves per pot in the first and second harvests as a function of N rates in the solution.
Y= 80.26607 + 1.05542X - 0.00154X2
(R2 = 0.71**)
Y= 81.85062 + 1.67861X - 0.00247X2
(R2 = 0.70**)
50 100 150 200 250 300 350 400 450
Nitrogen (mg L-1)
Number of expanded leaves per pot
EGL 1st H EGL 2nd H
14 112 210 294 378 462
Figure 7 - Aruana grass leaf area in the first and second harvests as a function of N rates in the solution.
Y = 297.92815 + 22.11408X - 0.02762X2
(R2 = 0.86**)
Y = 651.00159 + 31.98385X - 0.04729X2
(R2 = 0.70**)
100 2100 4100 6100 8100
Nitrogen (mg L-1)
Leaf area (cm
2 p
er pot)
LA 1st H LA 2nd H
in the second harvest was verified in relation to that ob-tained in the first one. Increases in leaf area of forage plants by means of N supply were reported by Paciullo et al. (1998) with elephant grass, Manarin (2000) with Mombaça grass, and Mattos (2001) and Rodrigues (2002) with signal grass.
The nutritional status of plants, as well as envi-ronmental conditions, such as temperature, light intensity, and soil moisture, in addition to genetic characteristics of the plant and management, are fundamental tools in the process of formation and maintenance of plant tissues and consequently of leaf area. According to Nabinger (1997), water and N deficiencies are among the most common factors that limit leaf area index (LAI), and a deficiency of both results in progressive reductions of photosynthesis rate in the leaves, light interception, and consequently of the plant’s leaf area.
Specific leaf area (SLA) is the ratio between leaf area and leaf dry mass. The SLA reciprocal indicates leaf thickness – the specific weight of a leaf (Benincasa, 1988). The SLA in Aruana grass varied with the N rates in the solution only in the first harvest, showing
signifi-cance (P < 0.05) for the quadratic component of the
re-gression (Figure 8). The SLA values ranged from 255.4
to 290.4 cm2 g-1, respectively, between the 14 and 462 mg
L-1 N rates. Santos Jr. (2001) verified, in Marandu grass
harvested at 35 growing days, that SLA varied from 236.8
to 280.2 cm2 g-1 with N supplied in the nutrient solution
at 28 and 378 mg L-1, respectively.
Nitrogen is an integral component of several compounds essential to plant growth processes, in addi-tion to stimulating the development of leaves, stalks, and roots. Nitrogen deficiency reduces cell division and ex-pansion, affecting leaf elongation, but promoting an in-crease in cell wall thickness (Marschner, 1995).
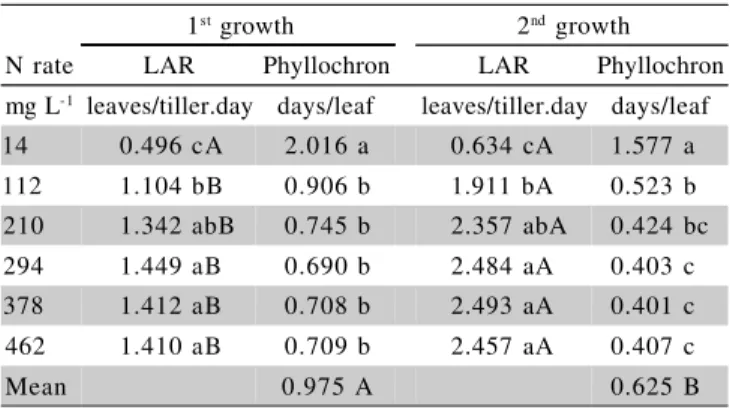
The N rates affected (P < 0.01) leaf appearance
rate (LAR) and phyllochron in both Aruana grass growth
periods (Table 1). The highest LAR observed in the first growth was 1.449 leaves/tiller.day with an N rate of 294
mg L-1, however not differing significantly from LAR
val-ues obtained with N rates of 210, 378, and 462 mg L-1.
In the second growth, the highest LAR was 2.493 leaves/
tiller.day obtained with 378 mg L-1
N supplied in the so-lution, again not differing from those obtained at 210,
294, and 462 mg L-1.
The phyllochron varied in the first growth from 2.016 to 0.709 days/leaf and from 1.577 to 0.407 days/
leafin the second growth, respectively, for the N rate from
14 to 462 mg L-1, indicating a great leaf emission
capac-ity by Aruana grass under a N sufficiency condition, which can be confirmed by the phyllochron values ob-served by Garcez Neto et al. (2002) with Mombaça grass and Ferragine et al. (2001) with signal grass.
The leaf appearance rate (LAR) was higher
(P < 0.01) in the second plant growth in relation to the
first for all N rates, except for the 14 mg L-1 rate
(P > 0.05). Higher LAR values in the second growth
probably occurred because the plants were already estab-lished, with a greater volume of roots, absorbing more water and nutrients, while during initial growth the plants concentrate great part of their energy to become estab-lished, with formation of their root system and top part. Phyllochron (based on the mean N rates) also showed
dif-ference (P < 0.01) from the first to the second growth of
plants, providing an indication, together with LAR, that a greater number of leaves are produced in the second growth and in a shorter time.
Besides acting on the phyllochron by increasing the production of new tissues, N can also cause leaf elon-gation rate changes. This effect can be greater the shorter the stalk elongation process is, enabling the leaf to be ex-posed above the sheaths of older leaves, in practice trav-eling the same course, but at higher elongation rates (Garcez Neto et al., 2002).
1st growth 2nd growth
N rate LAR Phyllochron LAR Phyllochron mg L-1 leaves/tiller.day days/leaf leaves/tiller.day days/leaf
14 0.496 cA 2.016 a 0.634 cA 1.577 a 112 1.104 bB 0.906 b 1.911 bA 0.523 b 210 1.342 abB 0.745 b 2.357 abA 0.424 bc 294 1.449 aB 0.690 b 2.484 aA 0.403 c 378 1.412 aB 0.708 b 2.493 aA 0.401 c 462 1.410 aB 0.709 b 2.457 aA 0.407 c
Mean 0.975 A 0.625 B
Table 1 - Aruana grass leaf appearance rate (LAR) and phyllochron in the first and second growth periods, as a function of N rates in the solution.
Lower case letters on the same column and upper case letters on the same row do not differ significantly by Tukey test (P < 0.05).
Figure 8 - Aruana grass specific leaf area in the first harvest as a function of N rates in the solution.
Y = 254.03507 - 0.15607X + 0.00051X2
(R2 = 0.63*)
200 250 300
Nitrogen (mg L-1)
Specific leaf area (cm
2 g
-1 )
Pinto et al. (1994) reported values of 2.35 and
4.29 days/leaf, respectively, for the grasses Setaria anceps
Stapf. ex Massey cv. Kazungula and Panicum maximum
Jacq. cv. Guiné, 21 days after emergence of the grasses, regardless of the N rates used. Ferragine et al. (2001), in an evaluation of signal grass submitted to N and K rates in the nutrient solution with respect to LAR and phyllochron in two plant growth periods, concluded that both variables were influenced by N supplied in both growth periods; no effects of the N × K interaction, or supplied K were observed. They explained that LAR in the first harvest was higher when N was supplied at the
rates of 336 and 434 mg L-1, corresponding to 0.510
leaves/tiller.day (phyllochron of 1.96 days/leaf) at both rates. Values of 0.211 (4.74 days/leaf) and 0.212 leaves/ tiller.day (4.72 days/leaf) were verified in the second
har-vest, for nitrogen rates of 336 and 434 mg L-1,
respec-tively.
The role N plays on LAR can be analyzed as a result from the combination of a series of factors, such as height of sheaths, leaf elongation, and temperature. The rate at which leaves become elongated acts by changing the pattern of appearance of leaf blades. This occurs cause of a change in the time the leaf takes from its be-ginning in the meristem until it appears above the pseudostalk formed by older leaves (Garcez Neto et al., 2002).
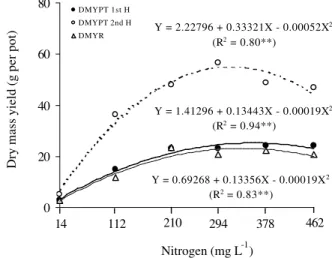
The Aruana grass dry mass yield, both in the plant tops (DMYPT) for the first and second harvests, and
in the roots (DMYR) varied (P < 0.01) with the N rates
in the nutrient solution (Figure 9). Dry mass yield of the plant tops in the first harvest was influenced by the N
sup-plied in the solution, and was significant (P < 0.01) for
the quadratic component of the regression. The point of maximum dry mass yield occurred when N was supplied
at 336 mg L-1. At the second harvest, dry mass yield in
the plant tops showed a maximum with N at 333 mg L-1.
Maximum yield in the second harvest was 61% higher than in the first one, with nearly the same N rate. Dry mass yield in the roots was obtained with N supplied at
the rate of 334 mg L-1, and was identical to the rates
ap-plied for maximum yield in the plant tops in both har-vests (Figure 9).
Under N deficiency conditions in the solution (14
mg L-1), the plant top:root ratio approached a 1:1 ratio
(Figure 9), whereas this ratio increased when N increased in the solution. Therefore, yield of the plant tops and roots increased as a result of supplied N, but with a preferen-tial allocation of the carbon partition for canopy forma-tion, thus characterizing a plasticity in biomass allocation as a function of the nutrient’s availability in the substrate. Studying Marandu grass, Monteiro et al. (1995) reported that when N was omitted, the plants dedicated the larg-est part of their dry mass yield to the root system. This mechanism has been widely pointed out in the literature as an adaptation required for plant survival, and it has been demonstrated that it is controlled both genetically and by the concentration of N in the plant (Marschner, 1995).
Yield responses of Aruana grass to supplied N were also reported by Colozza et al. (2000), who observed a maximum yield in the plant tops in the first harvest for
the N rate of 171 mg kg-1 of soil, and in the second
har-vest for the rate of 332 mg kg-1 of soil; the maximum yield
of roots was obtained at a rate of 262 mg kg-1 of soil. In
an experiment involving signal grass, Ferragine & Monteiro (1999) verified that the maximum dry mass yield for the root system would be obtained at a N supply rate
higher than 434 mg L-1 (the highest rate they studied).
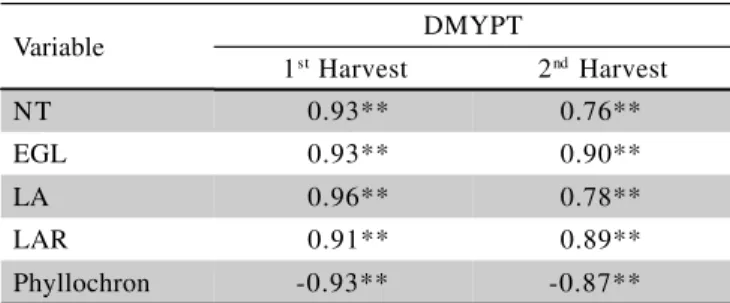
Morphophysiological correlations
The morphophysiological response variables showed positive correlations with dry mass yield in the plant tops in both harvests, except for phyllochron in the first (r = - 0.93) and second harvests (r = - 0.87) (Table 2). The higher DMYPT in the second harvest in relation to the first (Figure 9) was mainly due to the number of
ex-panded green leaves (EGL) (r = 0.90; P < 0.01) (Figure
6), leaf area, and leaf appearance rate (LAR) (r = 0.89; P
< 0.01) (Table 1), which is characteristic in this cultivar. LAR is an important indicator of the yield potential shown by buds for the generation of new tillers (site filling) in forage grasses, and is a morphophysiological attribute de-terminative of the structural characteristics of the grassland since it influences the development of leaves and tillers, and forage yield as a consequence.
In the second growth, the correlations between DMYPT and number of tillers (NT) and leaf area (LA) were, respectively, r = 0.76 and r = 0.78. In the first growth of the grass, the coefficients of correlation (r) be-tween DMYPT and LA, DMYPT and NT, DMYPT and
Y = 1.41296 + 0.13443X - 0.00019X2
(R2 = 0.94**)
Y = 2.22796 + 0.33321X - 0.00052X2
(R2 = 0.80**)
Y = 0.69268 + 0.13356X - 0.00019X2
(R2 = 0.83**)
0 20 40 60 80
Nitrogen (mg L-1)
Dry mass yield (g per pot)
DMYPT 1st H DMYPT 2nd H DMYR
14 112 210 294 378 462
EGL, and DMYPT and LAR were, respectively, 0.96, 0.93, 0.93, and 0.91 (Table 2).
Tillering potential is determined by leaf emission velocity, because during the formation of each leaf there is a correspondence with the generation of one or more axillary buds (Nabinger, 1997; 2002). The importance of tiller density is associated with other structural charac-teristics of the pasture, such as the number of leaves per tiller and leaf size, which are components that determine leaf area index (LAI). This index is the main factor that influences light interception, and pasture regrowth dy-namics as a consequence (Chapman & Lemaire, 1993).
CONCLUSIONS
The N rates promoted increases in all variables evaluated, except for the leaf blades:stalks plus sheaths ratio, which decreased as N was supplied in the solution.
Aruana grass proved to be a demanding P. maximum
cul-tivar with respect to N in order to express its maximum yield potential, as verified in all response variables that were studied.
The N supplied in the solution promoted morpho-logical and physiomorpho-logical adjustments in the plants, result-ing in maximum responses, as observed for tillerresult-ing, leaf area, total number of green expanded leaves, and also leaf appearance rate and phyllochron, which reflected as greater leaf yield, in a shorter period of time, and are morphophysi-ological attributes that determine yield in Aruana grass.
REFERENCES
ANDRADE, A.C.; FONSECA, D.M.; GOMIDE, J.A.; ALVAREZ, V.H.V.; MARTINS, C.E.; SOUZA, D.P.H. Produtividade e valor nutritivo do capim-elefante cv. Napier sob doses crescentes de nitrogênio e potássio.
Revista Brasileira de Zootecnia,v.29, p.1589-1595, 2000.
BENETTI, I.; SCHIAVUZZO, P.F.; PREMAZZI, L.M.; MONTEIRO, F.A. Aparecimento e acúmulo de folhas e produção de Tifton 85 submetido a doses de nitrogênio. In: SIMPÓSIO INTERNACIONAL DE INICIAÇÃO CIENTÍFICA DA UNIVERSIDADE DE SÃO PAULO, 1., Piracicaba, 1999. Anais. Piracicaba: ESALQ, 1999. p.313.
BENINCASA, M.M.P. Análise de crescimento de plantas; noções básicas. Jaboticabal: FUNEP, 1988. 41p.
BIANCHINI, D.; CARRIEL, J.M.; LEINZ, F.F.; RODRIGUES, C.F.C. Viabilidade de doze capins tropicais para criação de ovinos. Boletim de
Indústria Animal, v.56, p.163-177, 1999.
CARVALHO, M.M.; FREITAS, V.P.; XAVIER, D.F. Início de florescimento, produção e valor nutritivo de gramíneas forrageiras tropicais sob condição de sombreamento natural. Pesquisa Agropecuária Brasileira, v.37, p.717-722, 2002.
CECATO, U.; FAVORETTO, V.; MALHEIROS, E.B. Freqüências de corte, níveis e formas de aplicação de nitrogênio sobre as características da rebrota do capim-aruana (Panicum maximum Jacq. cv. Aruana). Revista
Unimar, v.16, p.263-276, 1994a.
CECATO, U.; FAVORETTO, V.; MALHEIROS, E.B. Influência da freqüência de corte, de níveis e formas de aplicação de nitrogênio sobre a produção e a taxa de crescimento do capim-aruana (Panicum maximum Jacq. cv. Aruana). Revista Unimar, v.16, p.203-216, 1994b.
CECATO, U.; MACHADO, A.O.; MARTINS, E.N.; PEREIRA, L.A.F.; BARBOSA, M.A.A.F.; SANTOS, G.T. Avaliação da produção e de algumas características da rebrota de cultivares e acessos de Panicum maximum Jacq. sob duas alturas de corte. Revista Brasileira de
Zootecnia, v.29, p.660-668, 2000.
CHAPMAN, D.F.; LEMAIRE, G. Morphogenetic and structural determinants of plant regrowth after defoliation. In: INTERNATIONAL GRASSLAND CONGRESS, 17., New Zealand, 1993. Proceedings.
New Zealand, 1993. p.95-104.
COLOZZA, M.T.; KIEHL, J.C.; WERNER, J.C; SCHAMMASS, E.A. Respostas de Panicum maximum cultivar Aruana a doses de nitrogênio.
Boletim de Indústria Animal, v.57, p.21-32, 2000.
FERRAGINE, M.D.C.; MONTEIRO, F.A. Combinação de doses de nitrogênio e potássio na nutrição mineral de capim-braquiária. Boletim
de Indústria Animal, v.56, p.25-33, 1999.
FERRAGINE, M.D.C.; MONTEIRO, F.A.; SILVA, S.C. Leaf appearance rate in Brachiaria decumbens grown in nitrogen and potassium rates. In: INTERNATIONAL GRASSLAND CONGRESS, 19., São Pedro, 2001. Proceedings. Piracicaba: FEALQ, 2001. p.69-70.
GARCEZ NETO, A.F.; NASCIMENTO JR., D.; REGAZZI, A.J.; FONSECA, D.M.; MOSQUIM, P.R.; GOBBI, K.F. Respostas morfogênicas e estruturais de Panicum maximum cv. Mombaça sob
diferentes níveis de adubação nitrogenada e alturas de corte. Revista
Brasileira de Zootecnia,v.31, p.1890-1900, 2002.
GOMIDE, J.A. Formação e utilização de capineira de capim-elefante. In: CARVALHO, M.M.; ALVIM, M.J.; XAVIER, D.F.; CARVALHO, L.A. (Ed.) Capim-elefante: produção e utilização. Coronel Pacheco: EMBRAPA, 1994. p.81-115.
INSTITUTO DE ZOOTECNIA. “Capim Aruana” (Panicum maximum cv.
Aruana IZ-5). Nova Odessa, 1989. (Folder de pré-lançamento) JANK, L. Melhoramento e seleção de variedades de Panicum maximum.
In: SIMPÓSIO SOBRE MANEJO DA PASTAGEM, 12., Piracicaba, 1995. Anais. Piracicaba: FEALQ, 1995. p.21-58.
MANARIN, C.A. Respostas fisiológicas, bioquímicas e produtivas do capim-Mombaça a doses de nitrogênio. Piracicaba: USP/ESALQ, 2000. 58p. (Dissertação-Mestrado).
MARSCHNER, H. Mineral nutrition of higher plants.2.ed. New York: Academic Press, 1995. 889p.
MATTOS, W.T. Avaliação de pastagem de capim-braquiária em degradação e sua recuperação com suprimento de nitrogênio e enxofre. Piracicaba: USP/ESALQ, 2001. 97p. (Tese-Doutorado).
MONTEIRO, F.A.; RAMOS, A.K.B.; CARVALHO, D.D.; ABREU, J.B.R.; DAIUB, J.A.S.; SILVA, J.E.P.; NATALE, W. Cultivo de Brachiaria brizantha Stapf. cv. Marandu em solução nutritiva com omissões de
macronutrientes. Scientia Agricola, v.52, p.135-141, 1995.
NABINGER, C. Eficiência do uso de pastagens: disponibilidade e perdas de forragem. In: SIMPÓSIO SOBRE MANEJO DA PASTAGEM, 14., Piracicaba, 1997. Anais. Piracicaba: FEALQ, 1997. p.213-251.
NABINGER, C. Manejo da desfolha. In: SIMPÓSIO SOBRE MANEJO DA PASTAGEM, 19., Piracicaba, 2002. Anais. Piracicaba: FEALQ, 2002. p.133-158.
Table 2 - Relation between Aruana grass dry mass yield in the plant tops (DMYPT), in the first and second harvests, and number of tillers (NT), number of expanded green leaves (EGL), leaf area (LA), leaf appearance rate (LAR), and phyllochron.
**is significant at 0.01.
Variable DMYPT
1st Harvest 2nd Harvest
NT 0.93** 0.76**
EGL 0.93** 0.90**
LA 0.96** 0.78**
LAR 0.91** 0.89**
PACIULLO, D.S.C.; GOMIDE, J.A.; RIBEIRO, K.G. Adubação nitrogenada do capim-elefante cv. Mott. 1. Rendimento forrageiro e características morfofisiológicas ao atingir 80 e 120 cm de altura. Revista Brasileira
de Zootecnia,v.27, p.1069-1075, 1998.
PEREIRA, A.V.; VALLE, C.B.; FERREIRA, R.P.; MILES, J.W. Melhoramento de forrageiras tropicais. In: NASS, L.L.; VALOIS, A.C.C.; MELO, I.S.; VALADARES-INGLIS, M.C. (Ed.) Recursos genéticos e
melhoramento – plantas. 1.ed. Rondonópolis: Fundação MT, 2001.
p.549-601.
PINTO, J.C.; GOMIDE, J.A.; MAESTRI, M.; LOPES, N.F. Crescimento de folhas de gramíneas tropicais, cultivadas em vasos, com duas doses de nitrogênio. Revista da Sociedade Brasileira de Zootecnia,v.23, p.327-332, 1994.
RODRIGUES, R.C. Calcário, nitrogênio e enxofre para a recuperação do capim-braquiária cultivado em solo proveniente de uma pastagem degradada. Piracicaba: USP/ESALQ, 2002. 141p. (Dissertação-Mestrado).
SANTOS JR., J.D.G. Dinâmica de crescimento e nutrição do capim-Marandu submetido a doses de nitrogênio. Piracicaba: USP/ESALQ, 2001. 79p. (Dissertação-Mestrado).
SARRUGE, J.R. Soluções nutritivas. Summa Phytopathologica, v.1, p.231-233, 1975.
SAS Institute. SAS/STAT. User’s guide,version 6.11. 4.ed. Cary: Statistical Analysis System Institute, 1996. v.2, 842p.
SCHIAVUZZO, P.F.; LAVRES JR., J.; MONTEIRO, F.A. Respostas fisiológicas do capim-marandu ao suprimento de nitrogênio. In: SIMPÓSIO INTERNACIONAL DE INICIAÇÃO CIENTÍFICA DA UNIVERSIDADE DE SÃO PAULO, 1., Piracicaba, 1999. Anais.
Piracicaba: ESALQ, 1999. p.313.
SIMON, J.; LEMAIRE, G. Tillering and leaf area index in grasses in the vegetative phase. Grass and Forage Science, v.42, p.373-380, 1987. SKINNER, R.H.; NELSON, C.J. Role of leaf appearance rate and coleoptile
tiller in regulating tiller production. Crop Science, v.34, p.71-75, 1994.