Meal Frequency in
Drosophila melanogaster
Michael J. Williams*, Philip Goergen, Jayasimman Rajendran, Galina Zheleznyakova, Maria G. Ha¨gglund,
Emelie Perland, Sonchita Bagchi, Argyro Kalogeropoulou, Zaid Khan, Robert Fredriksson, Helgi B. Schio¨th
Functional Pharmacology, Department of Neuroscience, Uppsala University, Uppsala, Sweden
Abstract
In all animals managing the size of individual meals and frequency of feeding is crucial for metabolic homeostasis. In the current study we demonstrate that the noradrenalin analogue octopamine and the cholecystokinin (CCK) homologue
Drosulfakinin(Dsk) function downstream ofTfAP-2andTiwaz(Twz) to control the number of meals in adult flies. Loss of
TfAP-2orTwzin octopaminergic neurons increased the size of individual meals, while overexpression ofTfAP-2significantly decreased meal size and increased feeding frequency. Of note, our study reveals thatTfAP-2andTwzregulate octopamine signaling to initiate feeding; then octopamine, in a negative feedback loop, induces expression of Dsk to inhibit consummatory behavior. Intriguingly, we found that the mouseTfAP-2andTwzhomologues, AP-2band Kctd15, co-localize in areas of the brain known to regulate feeding behavior and reward, and a proximity ligation assay (PLA) demonstrated that AP-2b and Kctd15 interact directly in a mouse hypothalamus-derived cell line. Finally, we show that in this mouse hypothalamic cell line AP-2band Kctd15 directly interact with Ube2i, a mouse sumoylation enzyme, and that AP-2bmay itself be sumoylated. Our study reveals how two obesity-linked homologues regulate metabolic homeostasis by modulating consummatory behavior.
Citation:Williams MJ, Goergen P, Rajendran J, Zheleznyakova G, Ha¨gglund MG, et al. (2014) Obesity-Linked HomologuesTfAP-2andTwzEstablish Meal Frequency inDrosophila melanogaster. PLoS Genet 10(9): e1004499. doi:10.1371/journal.pgen.1004499
Editor:Gregory P. Copenhaver, The University of North Carolina at Chapel Hill, United States of America
ReceivedDecember 3, 2013;AcceptedMay 27, 2014;PublishedSeptember 4, 2014
Copyright:ß2014 Williams et al. This is an open-access article distributed under the terms of the Creative Commons Attribution License, which permits unrestricted use, distribution, and reproduction in any medium, provided the original author and source are credited.
Funding:This study was supported by the Swedish Research Council, as well as the A˚hle´ns Foundation, The Swedish Brain Research Foundation, The National Research Fund of Luxembourg, The Novo Nordisk Foundation, Carl Tryggers Stiftelse, Stiftelsen Olle Engkvist Byggma¨stare and Lars Hiertas Minne. The funders had no role in study design, data collection and analysis, decision to publish, or preparation of the manuscript.
Competing Interests:The authors have declared that no competing interests exist.
* Email: Michael.Williams@neuro.uu.se
Introduction
The human genes TFAP2B(encoding AP-2b) andKCTD15
were strongly linked to obesity in multiple genome-wide associ-ation studies (GWAS) [1–4], though it is still not understood how they regulate obesity. In the fruit fly Drosophila melanogaster, TFAP2Band KCTD15 are both highly conserved, encoded by
TfAP-2 and Tiwaz (Twz), respectively [5–7]. Recently, it was shown in zebrafish embryos that Kctd15 interacts directly with AP-2a(Tfap2a) to inhibit AP-2afunction, and inDrosophilathere is evidence for an association betweenTfAP-2andTwz[6,8,9]. TfAP-2 and Twz had a strong interaction in a large scale yeast two-hybrid screen using almost the entire Drosophila proteome [9]. Moreover, we have shown in adult males thatTfAP-2and
Twz genetically interact to control aggressive behavior by regulating octopamine production and secretion, which in turn regulates the expression of the Drosophila cholecystokinin(CCK) homologDrosulfakinin(Dsk) [6]. Interestingly, we demonstrated that overexpression of Dsk was sufficient to induce aggressive behavior in males.
CCK, a mammalian gastrointestinal hormone, is secreted by the gut when nutrients enter the lumen. After being released CCK binds to the cholecystokinin A receptor (CCKAR) located on vagal sensory terminals, this pathway delivers satiation signals to the
nucleus of the solitary tract (NTS) to inhibit feeding [10,11]. Similar to mammalian CCK, inDrosophilaadultsDskis necessary to inhibit overeating after starvation [12]. Furthermore, it was reported thatDskis necessary in larvae and adultDrosophila to determine food palatability [12]. More recently, it was determined that octopamine also has an important role in determining the palatability of food [13]. These results led us to ask the following questions: AreTfAP-2andTwzinvolved in regulatingDrosophila
adult feeding behavior? DoesDskregulate normal ab libfeeding behavior? Do octopamine and Dsk interact to regulate feeding in adult flies?
Here, using genetic tools to manipulate their expression, we have investigated the function of TfAP-2 and Twz in the regulation of feeding behavior. Our data suggest that TfAP-2
Results
Starvation and diet affectTfAP-2andTwztranscription
Previously, we demonstrated thatTfAP-2andTwzfunction in octopaminergic neurons to regulate the expression of the
Drosophila cholecystokinin (CCK) homologue Drosulfakinin
(Dsk), via octopamine signaling [6]. It was reported that Dsk is involved in regulating consummatory behavior [12], to understand if TfAP-2 and Twz could also be involved in commsumatory behavior we performed qPCR to determine their transcript levels after different dietary regiments. Intriguingly, compared to flies fed
ab lib, starving males for 24 h significantly increased TfAP-2
expression (1.66-fold, SE60.07, P,0.005) (Figure 1A), but not
Twzexpression. Starving the males for 48 h significantly increased the expression of both genes (Figure 1A). Next, we determined if macronutrient content influenced TfAP-2 and Twz expression. The transcript levels ofTfAP-2andTwzin males fed a normal diet (10 g?dl21:10 g?dl21 sucrose:brewer’s yeast S:Y) were set as 100%, represented as 1 on the graph (Figure 1B). Keeping males for 5 days on a the low calorie diet (2.5 g?dl21:2.5 g?dl21 S:Y) increased the expression of TfAP-2, but not significantly (1.56-fold, SE 60.23, P = 0.056). Feeding males a high calorie diet (40 g?dl21:40 g?dl21 S:Y) or just a high protein diet (10 g?dl21:40 g?dl21 S:Y) significantly reduced the expression of
TfAP-2 (high calorie diet: 0.66-fold SE 60.07, P,0.05; high protein diet: 0.37-fold, SE60.05, P,0.005). The high sugar diet (40 g?dl21:10 g?dl21 S:Y) also decreasedTfAP-2expression, but not significantly (0.60-fold, SE 61.26, P = 0.059) (Figure 1B). None of the diets had a considerable effect on Twzexpression (Figure 1B). From these results it is evident thatTfAP-2transcript levels are up-regulated under conditions of dietary restriction and down-regulated when flies are fed a high calorie diet; whileTwz
transcription is only influenced by severe starvation.
We already established that Twz was necessary for TfAP-2
expression in octopaminergic neurons (Text S1, Figure S1A) [6]. To understand ifTwzwas necessary for the increase observed in
TfAP-2 expression when flies were starved or raised on a low calorie diet, we knocked down Twz in octopaminergic neurons and performed qPCR analysis. The transcript levels ofTfAP-2in males fedab libon a normal diet (10 g?dl21:10 g?dl21S:Y) was set as 100%, represented as 1 on the graph (Figure 1C). As seen previously, starving control males (Tdc2-GAL4+/2) for 24 h significantly increased TfAP-2 expression (1.72-fold, SE 60.07, P,0.005), whereas keeping them for 5 days on a low calorie diet (2.5 g?dl21:2.5 g?dl21S:Y) also increasedTfAP-2 levels, but not significantly (Figure 1C). Interestingly, knocking down Twz
expression in octopaminergic neurons was sufficient to significant-ly inhibitTfAP-2expression in starved flies, as well as flies raised on a low calorie diet (Figure 1C).
Previously we have reported that overexpression ofTfAP-2in octopaminergic neurons is sufficient to induce the expression of two gene necessary for octopamine production and secretion,
Tyraminebhydroxylase(Tbh) andVesicular monoamine transport-er(Vmat) [6]. Since starvation had a significant effect onTfAP-2
transcription, to understand if starvation influencedTbhandVmat
transcriptional levels we performed qPCR analysis on adult males starved for 24 h or 48 h. Intriguingly, compared to flies fedab lib, starving males for 24 h significantly increased Vmat expression (1.59-fold, SE60.11, P,0.05) (Figure 1D). By 48 h of starvation
Vmatexpression was back to control levels. Starving males for 48 h significantly decreased Tbh expression levels (0.48-fold, SE
60.03, P,0.05) compared to controls. Next, we determined if macronutrient content influencedTbhorVmatexpression. While none of the diets had a considerable effect onVmatexpression, a slight increase inTbhexpression was observed in flies fed a low calorie diet, and a significant decrease was observed in flies fed a high calorie diet (0.79, SE 60.05, P,0.05) (Figure 1E). From these results it appears that starvation conditions regulate bothTbh
and Vmattranscription, but onlyTbh is regulated by macronu-trient content.
TfAP-2andTwzregulate feeding after starvation
TheDrosophila CCKhomologueDskis necessary to limit meal size after starvation [12], and we saw that bothTfAP-2andTwz
transcript levels were increased under starvation conditions (Figure 1A). To discover ifTfAP-2 and Twz could be involved in regulating consummatory behavior after starvation we per-formed a re-feeding assay. Normally flies re-introduced to food after overnight starvation will eat for ,20 minutes [14]. We
allowed starved flies to feed on normal food for 20 minutes before letting them feed for a further 10 minutes on normal food containing blue food dye. Overeaters were determined as those males having blue food in their guts when observed under a stereomicroscope [12,14] (Figure 2A). Only 3% (SE62) of Tdc2-GAL4+/2control flies ate the colored food, indicating that most control flies were satiated after 20 minutes, while 25% (SE67.7, P,0.05) ofTfAP-2RNAi1and 22% (SE
66.5, P,0.05) of TfAP-2RNAi2 flies overate; 21% (SE65.3, P,0.05) of TwzRNAi1 and 19% (SE64.8, P,0.05) ofTwzRNAi2males overate (Figure 2B). Intriguingly, 50% (SE64.8, P,0.005) ofTfAP-2OEmales overate
after being starved for 16 h, while only 10% (SE64.2, P,0.05) of theTfAP-2OE;TwzRNAi1flies continued to eat beyond the initial 20 minutes (Figure 2B). Similar results were obtained using green food dye; to exclude any possible effects caused by the blue food coloring (Figure 2C). Interestingly, similar to loss of Dsk in the insulin-producing cells, knocking down Tfap-2 or Twz in octopaminergic neurons causes them to overeat after starvation, indicating they may be upstream ofDskin regulating consumma-tory behavior. Of note, when Tfap-2 was overexpressed in octopaminergic neurons an even stronger overeating phenotype was observed than with loss ofTfap-2.
TfAP-2andTwzare necessary for proper consummatory behavior
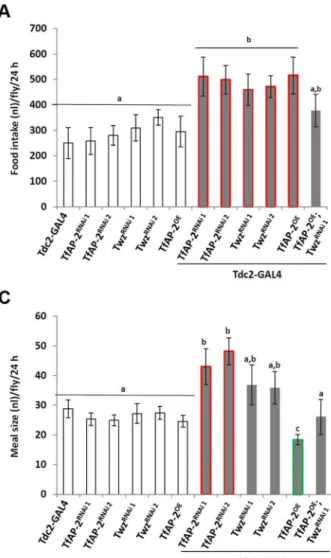
To understand ifTfAP-2andTwzwere involved in regulating normal consummatory behavior in adults, a CAFE assay was performed to measure how much food flies fedad lib consumed during a 24 h period [15]. WhileTdc2-GAL4+/2control flies ate 270 nl (SE 660.9), TfAP-2RNAi1 and TfAP2RNAi2 knockdown
flies ate significantly more, 511.8 nl (SE 676.7, P,0.005) and Author Summary
The size of individual meals and feeding frequency are important for homeostatic control. Due to the complex neuroendocrine system regulating human food intake it is difficult to uncover the mechanisms underlying eating disorders. The genetically tractable model system Dro-sophila melanogasterhas a comparatively simple brain; yet, similar to humans, its eating behavior can adapt to respond to nutritional needs. Our study describes how the obesity-linked homologues TfAP-2 (human TFAP2B) and Tiwaz (human KCTD15) regulate a unique feedback system involving noradrenalin-like octopamine and the
CCKhomologDsk, that exert positive and negative effects on Drosophila feeding behavior. Our findings provide insight into how two conserved obesity-linked genes regulate feeding behavior in order to maintain metabolic balance.
499.3 nl (SE 661.1, P,0.05), respectively (Figure 3A). Similar results were obtained when we knocked down Twz (TwzRNAi1: 460.2 nl, SE661.1, P,0.005;TwzRNAi2: 472 nl, SE643.3, P,
0.005). Of note, overexpressingTfAP-2specifically in octopami-nergic neurons also induced flies to eat significantly more than controls (490 nl, SE673, P,0.005) (Figure 3A). The increase in meal size due to TfAP-2 overexpression was rescued by simultaneously knocking downTwz(TfAP2OE;TwzRNAi1: 290 nl, SE663.3, P = 0.86).
To observe each genotype’s consummatory behavior, individual CAFE assays were videoed, allowing us to determine both the number of feeding bouts (fb) and the average meal size. Controls had 9 fb per fly (SE 61.1) over a 24 h period, while flies overexpressingTfAP-2in octopaminergic neurons had 28 fb (SE
65.1, P,0.005) (Figure 3B). Compared to TfAP-2OE males,
TfAP-2OE;TwzRNAi1males had significantly fewer feeding bouts
per fly (14 fb, SE63.2, P,0.005). Meal size was also affected by the various genotypes. Control flies ate on average 29 nl per meal (SE 63.0), while TfAP-2RNAi1 and TfAP-2RNAi2 knockdown males ate significantly larger meals, 43 nl (SE66.0, P,0.05) and 48.2 nl (SE64.5, P,0.05), respectively.TwzRNAi1andTwzRNAi2
males ate slightly, but not significantly, larger meals (TwzRNAi1: 36.8 nl, SE 66.7, P = 0.3; TwzRNAi2: 35.9 nl, SE 65.5) (Fig-ure 3C). Overexpression of TfAP-2 in octopaminergic neurons induced a significant reduction in average meal size (18 nl, SE
62.0, P,0.005) (Figure 3C), which was rescued by simultaneously knocking down Twz (TfAP2OE;TwzRNAi1: 26 nl, SE
66.0, P = 0.68). The increase in feeding bouts observed whenTfAP-2
was overexpressed in octopaminergic neurons might explain overeating after starvation, since overexpression of TfAP-2
induced flies to feed.
TfAP-2andTwzregulate feeding through octopamine signaling
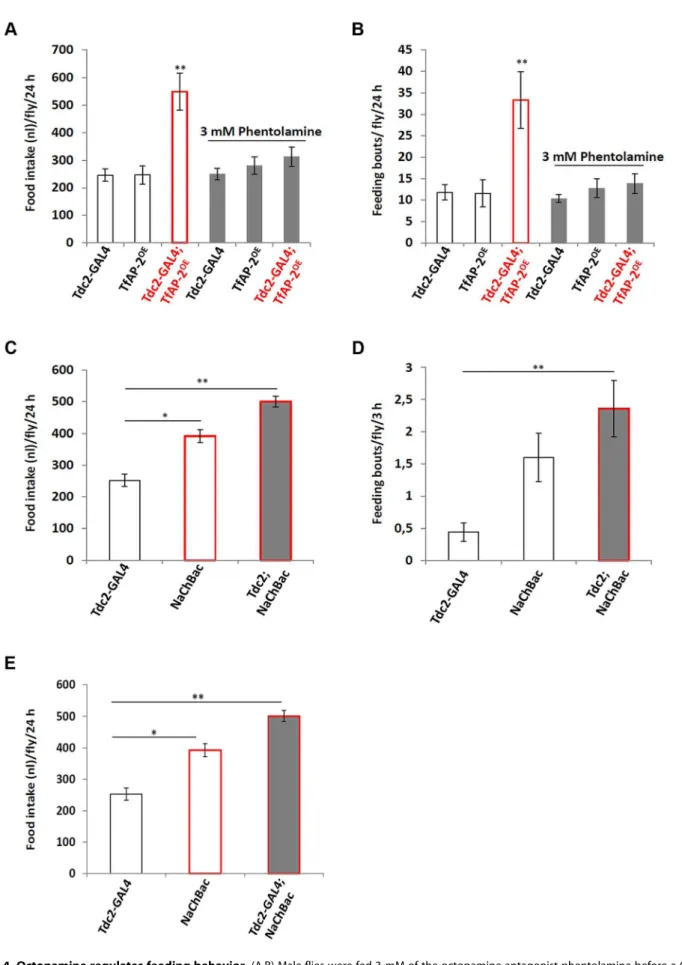
To determine if TfAP-2 and Twz were regulating feeding through octopamine signaling, we fed flies 3 mM of the octopamine antagonist phentolamine, a concentration known to reduce TfAP-2OE induced hyperactivity to control levels, while not reducing the activity of controls [6]. A CAFE assay was performed to determine the total food intake and the average number of feeding bouts per fly over 24 h. WhileTdc2-GAL4+/2 and TfAP-2OE+/2 control flies ate 246.4 nl (SE 622.2) and
Figure 1. Diet regulatesTfAP-2andTwztranscript levels.(A) Relative levels ofTfap-2orTwztranscript in the heads of flies starved either for 24
or 48 h. (B) Relative levels ofTfap-2orTwztranscript in the heads of flies kept on various diets for 5 days. (A–B) RNA was collected from the heads of
50, 5–7 day old, males for each genotype. qPCR was repeated at least 7 times for each transcript. (C) Relative levels ofTfap-2transcript in the heads of
control andTwzknockdown flies starved either for 24 h or kept on a low calorie diet (2.5 g?dl21
:2.5 g?dl21
sucrose:brewer’s yeast) for 5 days. RNA was collected from the heads of 50, 5–7 day old, males for each genotype. qPCR was repeated at least 7 times for each transcript. (D) Relative levels of
TbhorVmattranscript in the heads of flies starved either for 24 or 48 h. (E) Relative levels ofTbhorVmattranscript in the heads of flies kept on
various diets for 5 days. (For all assays n = 10 qPCR runs; Different letters indicate similar groups (i.e. ‘a’ is significantly different than ‘b’ or ‘c’ and so
on, one-way ANOVA with Bonferroni post hoc test for multiple comparisons, P,0.05). A single asterisk indicates significant difference in two-way
ANOVA, P,0.05, while a double asterisk indicates significant difference in two-way ANOVA, P,0.005). Error bars represent the SE (SEM).
246.8 nl (SE632.9) respectively, similar to before, overexpressing
TfAP-2in octopaminergic neurons significantly increased the total food intake to 548.8 nl (SE 666.3, P,0.005). Feeding 3 mM phentolamine had no significant affect on the total food intake of control flies, but significantly reduced the total intake ofTfAP-2OE
males to control levels (312.5 nl, SE634.7, P = 0.573) (Figure 4A). Overexpressing TfAP-2 in octopaminergic neurons significantly increased the number of feeding bouts (33.3 fb, SE 66.6, P,
0.005), while TfAP-2OE flies fed 3 mM phentolamine only had
13.9 fb (SE62.3, P = 0.642 compared toTdc2-GAL4+/2controls) (Figure 4B). Interestingly, feeding control flies 3 mM phentol-amine had no significant affect on the number of feeding bouts. Finally, in order to determine if octopamine had a direct effect on consummatory behavior, we expressed a UAS-transgene for the voltage-activated, bacterial sodium channel NaChBac [16] in
octopaminergic neurons using the Tdc2-GAL4 driver and then performed a CAFE assay as before. Of notable interest, overexpressing NaChBac in octopaminergic neurons significantly increased total food intake over a 24 h period (501.1 nl, SE616.9, P,0.005) compared to the Tdc2-GAL4+/2 control males (252.3 nl, SE 618.9) (Figure 4C). We noticed that flies usually feed within the first 3 h after lights on, so we videoed the flies during this time and counted the number of feeding bouts. Overexpressing NaChBac in octopaminergic neurons also signif-icantly increased the number of feeding bouts over a 3 h period (2.36 fb, SE 60.43, P,0.05) compared to the Tdc2-GAL4+/2 control males (0.44 feeding bouts, SE60.14) (Figure 4D). In the CAFE assay the UAS-NaChBac control line increased both total food intake and feeding bouts, indicating that this line has low levels of expression even without the GAL4 driver. These results
Figure 2.TfAP-2andTwzregulate feeding behavior after starvation.(A) Ingested dyed-food was visually detected in the abdomen of adult
males. (B and B1) After being starved for 16 h male flies were first fed normal food (5% sucrose, 5% yeast and 1% agarose) for 20 minutes, then
switched to normal food containing (B) 2% blue food coloring or (C) 2% green food coloring for 10 minutes. After this time the number of flies with blue guts was counted. This assay was repeated at least 5 times with 20 males used for each replicate. (B and C: Different letters indicate similar
groups (i.e. ‘a’ is significantly different from ‘b’ or ‘c’ and so on, one-way ANOVA with Bonferroni post hoc test for multiple comparisons, P,0.05).
Error bars represent the SE (SEM). doi:10.1371/journal.pgen.1004499.g002
indicate that TfAP-2 induced feeding behavior requires octopa-mine signaling. Furthermore, increasing octopaoctopa-mine signaling is sufficient to induce consummatory behavior in adult males.
Next to ascertain if octopamine signaling was directly influenc-ing Dsk transcript levels we expressed the voltage-activated, bacterial sodium channel NaChBac [16] in octopaminergic neurons using the Tdc2-GAL4 driver and performed qPCR to observeDsklevels (Figure 4E). TheDsktranscript levels of Tdc2-GAL4+/2males was set as 100%, represented as 1 on the graph. Compared toTdc2-GAL4+/2 controls (SE 60.06), males where NaChBac was overexpressed in octopaminergic neurons had significantly moreDsktranscript (1.75-fold, SE60.04, P,0.005) (Figure 4E). From this result we conclude that activating octopaminergic neurons is sufficient to induceDsk expression in the CNS.
Dsk inhibits feeding behavior
Overexpression ofDsk in the insulin-producing cells (IPCs) is sufficient to mimicTfAP-2OEinduced male aggression phenotypes
[6]. To discover if overexpression ofDskcould mimicTfAP-2OE
feeding phenotypes we performed a CAFE assay on flies fedab lib.
Dskwas overexpressed in the IPCs (Dilp2-GAL4), as well as pan-neuronally (elav-GAL4), and the feeding behavior phenotype was compared to males where TfAP-2 was either knocked down (TfAP-2RNAi) or overexpressed (TfAP-2OE) in octopaminergic neurons. Similar to what was observed before knocking down or overexpressing TfAP-2 increased total food intake. However, overexpressingDskpan-neuronally or specifically in the IPCs had no affect on the amount of food adult males consumed (Figure 5A). Also, flies overexpressing Dsk in either the IPCs (11.2 fb, SE62.3, P = 0.93) or pan-neuronally (6.2 fb, SE61.4, P = 0.23) had no significant change in the number of feeding bouts, when compared to controls (8.7 fb, SE61.4) (Figure 5B). Unlike TfAP-2OE males, which had an average meal size of 18.4 nl (SE61.7, P,0.005), control flies ate on average 28.5 nl per meal (SE63.1) and males overexpressingDskin IPCs or pan-neuronally ate normal size meals, 32.1 nl (SE64.8, P = 0.56) and 37.8 nl (SE65.4, P = 0.16), respectively (Figure 5C).
Figure 3.TfAP-2andTwzregulate normal feeding behavior.(A–C) A CAFE assay was used to assess total food intake (A), the average number of feeding bouts (B) and meal size (C) over a 24 h period in 5–7 days old adult males. Five males were used for each replicate and the assay was repeated at least 10 times for each genotype. In A and C, different letters indicate similar groups (i.e. ‘a’ is significantly different than ‘b’ or ‘c’ and so
on. A non-parametric Kruskal-Wallis ANOVA was performed with Dunn’s post hoc test for multiple comparisons, P,0.05), in B a double asterisk
indicates significant difference (A non-parametric Kruskal-Wallis ANOVA was performed with Dunn’s post hoc test for multiple comparisons, P,0.005)
Figure 4. Octopamine regulates feeding behavior.(A,B) Male flies were fed 3 mM of the octopamine antagonist phentolamine before a CAFE assay was performed to assess total food intake (A) and the average number of feeding bouts (B) over a 24 h period in 5–7 days old adult males. Five males were used for each replicate and the assay was repeated at least 10 times for each genotype (A non-parametric Kruskal-Wallis ANOVA was
performed with Dunn’s post hoc test for multiple comparisons, P,0.005). (B,C) Overexpression of a bacterial sodium channel in octopaminergic
Starvation had a significant effect onTfAP-2transcription and to a lesser degree onTwzexpression (Figure 1A). To understand if starvation influenced Dsk transcriptional levels we performed qPCR analysis on adult males starved for 24 h or 48 h. Compared to flies fed ab lib, starving males for 24 h significantly increased
Dsk expression (1.42-fold, SE 60.10, P,0.05 compared to controls), yet after 48 h of starvationDskexpression was back to control levels (Figure 5D). Finally, we determined if macronutrient content influenced Dsk expression, but none of the diets had a considerable affect, though a slight increase in Dsk expression was observed in flies fed a low calorie diet, and a decrease in expression was observed in flies fed a high proteins diet (Figure 5E). From these results is appears dietary conditions regulateDsk transcrip-tion in a manner similar toVmat.
Octopamine and Dsk signal in a negative feedback-loop
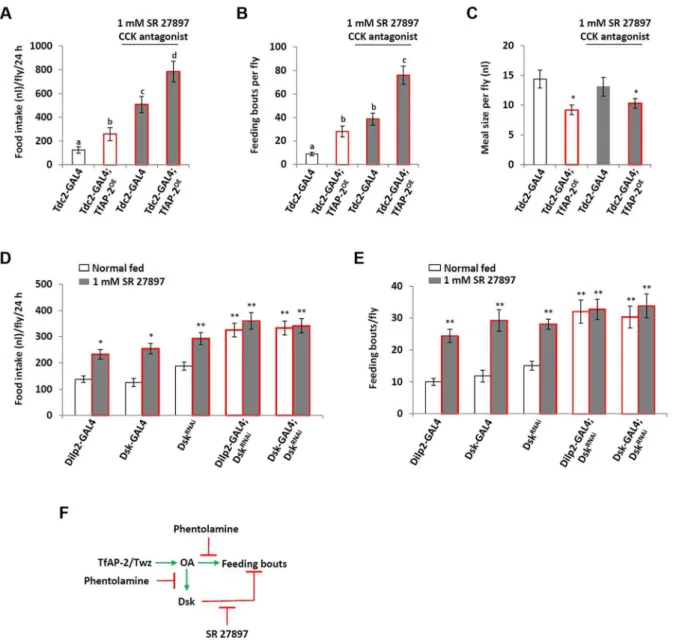
Overexpressing Dsk pan-neuronally (elav-GAL4) induced a slight, albeit not significant, decrease in the number of feeding bouts compared to controls (Figure 5B). This, along with the earlier study that determined loss of Dskcaused starved flies to overeat, could mean Dsk actually signals to inhibit feeding behavior [12]. In order to understand ifTfAP-2was regulating feeding behavior throughDskin a negative feedback loop, we fed control (Tdc2-GAL4+/2) and TfAP-2OE
males the mammalian CCK antagonist SR 27897 before performing a CAFE assay [17,18]. The CCK antagonist significantly increased total food intake in adult males (507.3 nl, SE668.2, P,0.005), compared to controls fed normal food (124.7 nl, SE 655.4). Similar to what was observed previously,TfAP-2OEmales ate significantly more
food (258.3 nl, SE 61.4, P,0.005) than controls (Figure 6A). Feeding these males the CCK antagonist had an additive effect, causing a drastic increase in total food intake (786.1 nl, SE688, P,0.005). The CCK antagonist also significantly increased the number of feeding bouts in Tdc-GAL4+/2 controls (38.6 fb, SE
65.2, P,0.005), which was more similar toTfAP-2OEmales (28 fb, SE 64.7, P,0.005 compared to controls) and significantly higher than controls (8.7 fb, SE 61.4) (Figure 6B). Feeding the antagonist to TfAP-2OE males increased the number of feeding
bouts even further to 76 (SE67.9, P,0.005). The antagonist SR 27897 had no effect on the meal size of either control or TfAP-2OEmales (Figure 6C).
To verifyDskfunction in feeding behavior, as well as determine if the mammalian CCK antagonist SR 27897 was actually inhibiting Drosophila Dsk signaling, we fed flies 1 mM SR 27897 where Dsk was knocked down in either the IPCs using theDilp2-GAL4driver or in allDskexpressing cells using the Dsk-GAL4driver [19,20] and performed a CAFE assay.Dilp2-GAL4, Dsk-GAL4and UAS-DskRNAiheterozygous controls ate 137.5 nl (SE 612.3), 125.5 nl (SE 615.3) and 187.5 nl (SE 615) respectively, feeding these controls 1 mM SR 27897 significantly increased their total food intake over a 24 h period (Dilp2-GAL4, 232.8 nl, SE618.7, P,0.05;Dsk-GAL4, 254.2 nl, SE620.3, P,
0.05; UAS-DskRNAi, 292.9 nl, SE
623.4, P,0.05). Knocking downDskin the IPCs (Dilp2-GAL4) or in allDskexpressing cells (Dsk-GAL4) significantly increased the total food intake over a 24 h period, but feeding these flies the CCK antagonist SR 27897
did not further increase total intake (Figure 6D). The heterozygous controlsDilp2-GAL4, Dsk-GAL4and UAS-DskRNAihad 10 (SE
61.1), 11.8 (SE61.8) and 15 (SE61.4) feeding bouts over a 24 h period, respectively (Figure 6E). Feeding these controls 1 mM SR 27897 significantly increased the number of feeding bouts ( Dilp2-GAL4+/2: 24.4 fb, SE62.1, P,0.005;Dsk-GAL4+/2: 29.2 fb, SE
63.4, P,0.005; UAS-DskRNAi+/2: 28.1, SE 61.6, P,0.005). Knocking down Dsk in the IPCs or in all Dsk expressing cells significantly increased the number of feeding bouts (Dilp2-GAL4; DskRNAi: 32 fb, SE63.6, P,0.005;Dsk-GAL4;DskRNAi: 30.3 fb, SE63.4, P,0.005), but feeding these flies the CCK antagonist did not further increase feeding bouts (Dilp2-GAL4;DskRNAi: 32.7 fb, SE63.2, P = 0.885;Dsk-GAL4;DskRNAi: 33.8 fb, SE
63.8, P,
0.861) (Figure 6E). From the above data we present the following model: TfAP-2 and Twz regulate the production and secretion of octopamine, which in turn initiates feeding, while at the same time, in a negative feedback loop, octopamine induces the expression ofDskto inhibit feeding frequency (Figure 6F).
Co-localization of the neuronally expressed AP-2band Kctd15 in the mouse brain
To ascertain if, similar toDrosophila, the mammalian Tfap2b
(encoding AP-2b) and Kctd15 genes could be involved in regulating feeding behavior, immunohistochemistry was per-formed to investigate if AP-2b and Kctd15 co-localized in the mouse brain, and known markers for neurons and glial cells were used to investigate in what cell type they were expressed, see Figure 7. AP-2band Kctd15 had similar expression patterns with high and exclusive expression in parts of cerebral cortex, cerebellum and hypothalamus. Overlapping expression was seen for AP-2band Kctd15 in the arcuate hypothalamic nucleus (Arc) and the ventromedial hypothalamic nucleus (VMH) (Figure 7A). Co-localization of AP-2band Kctd15 immunoreactivity was also seen in the core of the accumbens nucleus (AcbC) in ventral striatum (Figure 7B). These are all areas that are known to be involved in the regulation of food intake [21,22]. The neuron-specific enolase (NSE) was used to visualize the neuronal expression of AP-2b and Kctd15. Interestingly, overlapping expression was seen for AP-2b and the neuronal marker NSE [23] in cerebral cortex (Figure 7C). Kctd15 showed a similar pattern with strong co-localization with NSE in cerebral cortex (Figure 7D). The expression of the astrocyte marker glial fibrillary acidic protein (GFAP) [24] did not overlap with neither AP-2bnor Kctd15 in the brain (Figure 7E and 7F, respectively). To conclude, AP-2band Kctd15 immunoreactivity co-localize in specific areas of the mouse brain and are localized to neurons.
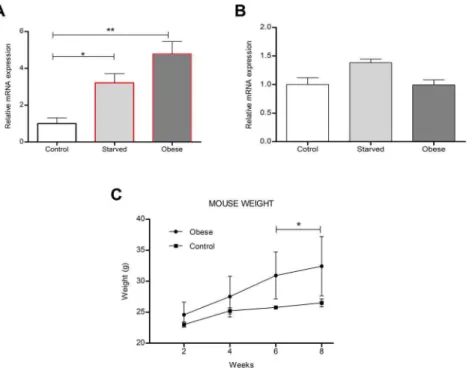
Regulation of Tfap2b and Kctd15 by food intake in mouse hypothalamus
To study how the dietary status influenced the mRNA expression of Kctd15 and Tfap2b in the hypothalamus, mice were assigned to different food restrictions; 1) fed normal chow-, 2) fed normal chow, but food-deprived for 24 h- and 3) fed high fat diet to induce obesity before analyses. The expression levels of
Tfap2bandKctd15in normal chow fed mice were sat at 100%, represented as 1 in the graphs (Figure 8A and 8B). Both genes neruons influences feeding behavior. A CAFE assay was used to assess total food intake over a 24 h period (C) and the average number of feeding bouts (D) over a 3 h period, during the first 3 h after lights-on, in 5–7 days old adult males. Five males were used for each replicate and the assay was
repeated at least 10 times for each genotype (one-way ANOVA with a Dunn’s post hoc test for multiple comparisons, *,0.05, ** P,0.005). Error bars
represent the SE (SEM). (E) Relative level ofDskexpression in males where NaChBac was overexpressed in octopaminergic neurons. (n = 10 qPCR
runs). In E a double asterisk indicates significant difference one-way ANOVA with a Dunn’s post hoc test for multiple comparisons, * P,0.05, ** P,
0.005).
were up-regulated by fasting, but only Tfap2b was significantly changed, with relative expression at 3.22 (SD60.50, P.0.05) for
Tfap2b and 1.38 (SD 60.06) for Kctd15 (Figure 8A). Further,
Tfap2bwas also affected by the high-fat diet with up-regulated relative expression levels at 4.78 (SD 60.67, P.0.01), while
Kctd15was unaffected by obesity (0.9960.09 (6SD) (Figure 8B). Mice fed a high-fat diet for 6–8 weeks had significantly higher weight than mice fed normal chow (Figure 8C). Hence dietary status affects the expression ofTfap2band to a much lesser extent
Kctd15, in the hypothalamus in mice, this is similar to what was observed for the Drosophila homologues TfAP-2 and Twz
(Figure 1A and 1B)
AP-2band KCTD15 directly interact in hypothalamus cells
To ascertain if AP-2band Kctd15 can directly interactin vivo, a proximity ligation assay (PLA) was performed using mHypoE-N25/2 cells. PLA can readily detect and localize proteins with single molecule resolution, allowing for the determination of directly interacting proteins [25]. Using this method, PLA signals were observed evenly distributed throughout the mHypoE-N25/2 cells, where both AP-2b and Kctd15 primary antibodies were added (Figure 9A, red dots), while no signals were observed in the control cells lacking primary antibodies (Figure 9A1). All cells were counter stained with DAPI to highlight the nuclei (blue staining). In mice AP-2b interacts with the sumoylation enzyme Ube2i [26] and inDrosophilaTwz interacts directly with theDrosophila
Ube2i homologue Lesswright (Lwr) [9]. Furthermore, mouse
AP2cis sumoylated [26] and we have evidence that mouse AP-2b
is also sumoylated (Figure 9D). Western blot analysis of mouse proteins recovered from the entire brain was performed using an anti-AP-2bantibody. Two bands were visible on the gel, the lower band corresponded to the predicted size of AP-2b (48 kDa), the upper band corresponded to sumoylated AP-2b (,60 kDa)
(Figure 9D). This result led us to perform a proximity ligation assay (PLA) using mHypoE-N25/2 cells to understand if Kctd15 and AP-2bdirectly interact with Ube2i. Using this method PLA signals were observed in punctate points throughout the mHypoE-N25/2 cells, when either AP-2b or Kctd15 primary antibodies were added together with Ube2i antibodies (Figure 9B and 9C respectively, red dots), while no signals were observed in cells lacking primary antibodies (Figure 9B1and 9C1respectively).
Discussion
Previously we have shown that the obesity-linked homologues
TfAP-2andTwzinteract genetically to positively regulate TfAP-2 activity [6]. This interaction could be regulated by orexigenic signals, including starvation or low macronutrient meal content (see figures 1A–C). In order to increase octopamine signaling,
TfAP-2overexpression induces the expression of genes involved in producing and secreting octopamine, for example Tyramine b hydroxylase(Tbh) andVesicular monoamine transporter(Vmat) [6]. Octopamine signaling initiates consummatory behavior, and in a negative feedback loop to prevent overeating, signals to induce the
Figure 5.Dskoverexpression does not affect feeding behavior.(A–C) A CAFE assay was used to assess the total food intake (B), the average number of feeding bouts (C) and meal size (D) over a 24 hour period in 5–7 days old adult males. Five males were used for each replicate and the
assay was repeated at least 10 times for each genotype. (D) Relative levels ofDsktranscript in the heads of flies starved either for 24 or 48 h. (E)
Relative levels ofDsktranscript in the heads of flies kept on various diets for 5 days. (D,E) RNA was collected from the heads of 50, 5–7 day old, males
for each genotype. qPCR was repeated at least 7 times for each transcript. (A,B and D: A single asterisk indicates significant difference, a non-parametric Kruskal-Wallis ANOVA was performed with Dunn’s post hoc test for multiple comparisons with Dunn’s post hoc test for multiple
comparisons, P,0.05, while a double asterisk indicates significant difference P,0.005). (C: Different letters indicate similar groups (i.e. ‘a’ is
significantly different than ‘b’ or ‘c’ and so on, A non-parametric Kruskal-Wallis ANOVA was performed with Dunn’s post hoc test for multiple
comparisons, P,0.05). Error bars represent the SE (SEM).
doi:10.1371/journal.pgen.1004499.g005
expression of Dsk; the Dsk anorexigenic signal then inhibits feeding. Intriguingly, we demonstrate that loss of TfAP-2 or overexpression ofTfAP-2in octopaminergic neurons induces an overeating phenotype, but by different mechanisms. Knocking downTfAP-2caused flies to eat larger meals, but did not influence the number of meals per day; while ovexpressing TfAP-2
significantly increased the number of meals taken per day. The overexpression phenotype can be explained by our model (see figure 6F). Increased octopamine signaling would induce flies to eat, but at the same time increase Dsk signaling to inhibit feeding. This feedback loop would lead to an increase number of feeding
bouts, due to octopamine signaling, but premature cessation of food intake due to increasedDskexpression. The increased meal size due to loss of TfAP-2 is harder to explain, but points to parallel pathways involved on regulating meal size. It was recently reported that similar to Dsk, another neuropeptide Crustacean cardioactive peptide (Ccap),Drosophila vasopressin/oxytocin ho-mologue, is also expressed in the insulin-producing cells [27]. Intriguingly we have evidence that Ccap is involved regulating meal size in adultDrosophila(M. Williams, unpublished observa-tions), both vasopressin and oxytocin have been shown to regulate meal size in mammals [28–30]
Figure 6. Dsk signals to inhibit feeding.(A–C) Male flies were fed 1 mM of the CCK antagonist SR 27897 before a CAFE assay was performed. (A)
Feeding control andTfAP-2OEmales SR 27897 increased total food intake, (B) and the number of feeding bouts, but (C) did not have an effect on the
average meal size. Five males were used for each replicate and the assay was repeated at least 10 times (D,E) Knocking downDskin either the
insulin-producing cells or all Dsk expressing cells inhibits the increase in total food intake (D) and feeding bouts (E) observed when flies are fed 1 mM of the CCK antagonist SR 27897. (F) Schematic drawing of octopamine and Dsk feedback lop to regulate the number of feeding bouts. Phentolamine is an octopamine antagonist, SR 27897 is a mammalian CCK antagonist. In A and B, different letters indicate similar groups (i.e. ‘a’ is significantly different
than ‘b’ or ‘c’ and so on, A non-parametric Kruskal-Wallis ANOVA was performed with Dunn’s post hoc test for multiple comparisons, P,0.05). In C a
single asterisk indicates significant difference from theTdc2-GAL4normal fed control (A non-parametric Kruskal-Wallis ANOVA was performed with
Dunn’s post hoc test for multiple comparisons, P,0.05). In D and E a double asterisk indicates significant difference from theDilp2-GAL4normal fed
control (A non-parametric Kruskal-Wallis ANOVA was performed with Dunn’s post hoc test for multiple comparisons, P,0.005). Error bars represent
the SE (SEM).
A recent paper demonstrated that theDrosophilanoradrenalin analogue octopamine was involved in regulating consummatory behavior in larvae [13]. In that particular study it was determined that octopamine drives the response for continual eating of palatable food, unlike the NPY-like system that was shown to initiate eating of less palatable food under adverse conditions [31,32]. Of note, chronic infusion of the mammalian octopamine analogue noradrenalin into the ventromedial hypothalamic nucleus (VMH) of rats induces obesity, most likely due to hyperphagia and increased levels of circulating insulin and triglycerides [33,34]. Furthermore, dietary amino acid deficiency inhibited noradrenalin release within the VMH, probably stimulated by an aversion response to inhibit consummatory behavior [35]. Interestingly, we found that in theDrosophilaCNS or mouse hypothalamus starvation and low macronutrient meal content induced the expression ofTfAP-2(see figure 1A and 1B) orTfap2b(see figure 8A and 8B). Furthermore, when we stained mouse brains to look for possible Tfap2b(encoding AP-2b) and
Kctd15interactions, we observed a strong co-localization of AP-2b
and Kctd15 within neurons located in the VMH. Moreover, overexpressing TfAP-2 in Drosophila octopaminergic neurons induces hyperphagia, which could be rescued by an octopamine antagonist. Finally, hyperactivating octopaminergic neurons is
sufficient to induce hyperphagia in adult maleDrosophila. These findings suggest that in flies and mammals the initiation and cessation of consummatory behavior is controlled by a conserved signaling system.
CCK, a mammalian gastrointestinal hormone secreted by the gut when nutrients enter the lumen, binds to the cholecystokinin A receptor (CCKAR) located on vagus sensory terminals. The vagus nerve then delivers satiation signals to the nucleus of the solitary tract (NTS) [10,11]. Under some experimental conditions exogenous CCK signaling elicits satiety and reduces meal size in several species [36–41]. Interestingly, our experiments show that although feeding wild-type flies a CCK antagonist has no affect on meal size, there is a significant increase in the number of feeding bouts (see figure 6B). Moreover, feedingTfAP-2 overexpressing males, which already undergo significantly more feeding bouts than controls, a CCK antagonist had an additive effect. Finally, knocking down the Drosophila CCK homologue in the insulin-producing cells (IPCs) was sufficient to induce hyperphagia (see figure 6D and 6E). This differs somewhat to what is observed in mammals, where inhibition of CCK increases meal size. Although there have been no studies reporting the effect of noradrenalin on CCK transcription or signaling, it has been shown that CCK signaling to the VMH can inhibit noradrenalin
Figure 7. Co-localization of AP2band KCTD15 immunoreactivity in hypothalamus and striatum.Immunohistochemistry performed on
sections from mouse brain with the nucleus marker DAPI labeled in blue. (Row A) The first row show extensively overlapping expression of AP2b(red)
and KCTD15 (green) in Arc and VMH in hypothalamus close to the third ventricle (3V) (Bregma21.58). (Row B) AP2bimmunoreactivity (red) was
highly overlapped with the KCTD15 immunoreactivity (green) in AcbC in the ventral striatum (Bregma 1.10). (Row C) The neuronal marker NSE (green)
and AP2b(red) co-localized in the cerebral cortex (Cx) (Bregma 1.10). (Row D) The protein expression of NSE (green) and KCTD15 (red) overlapped in
the cerebral cortex (Bregma21.46). (Row E) The immunoreactivity of the astrocyte marker GFAP (green) did not overlap with the expression of AP2b
(red) in the hypothalamus, close to the third ventricle (3V) (Bregma21.46). (Row F) The astrocyte marker GFAP (green) did not overlap with KCTD15
(red) in the hypothalamus (Bregma21.34). Pictures were taken with 206magnification.
doi:10.1371/journal.pgen.1004499.g007
Figure 8. Diet regulates mouse hypothalamic Tfap2b andKctd15 transcript levels. (A,B) Relative level of (A) Tfap2Band (B) Kctd15
expression in the hypothalamus from starved or obese male mice (n = 10 qPCR runs; one-way ANOVA with Bonferroni post hoc test for multiple
comparisons, * P,0.05, ** P,0.005). (C) Mice were either fed a normal or high fat diet for 8 weeks. By week six mice raised on a high fat diet were
significantly higher in weight than control mice (Two-way ANOVA with P,0.05 was calculated to ensure that the obese mice were significantly
release [42]. It could be that CCK released from the gut inhibits meal size, while CCK functions within the hypothalamus to block noradrenalin release, thus inhibiting the number of feeding bouts. Previously, we reported that overexpression of TfAP-2 or feeding Drosophila the octopamine analogue chlordimeform is sufficient to induceDsktranscription, and thatDskinduction by
TfAP-2overexpression could be blocked by feeding these flies an octopamine antagonist [6]. Here we demonstrate that specifically activating octopaminergic neurons using a bacterial sodium channel is sufficient to induce hyperphagia (see figure 4C and 4D). Also, a recent study demonstrated that octopamine signaling induced fervent feeding behavior when larvae were presented with palatable food [13]. Furthermore, it was shown that Dsk is necessary to inhibit well-fed larvae or adults from eating less palatable foods [12]. In both flies and mammals it is possible that there exists a conserved negative feedback loop to inhibit overeating, as well as allow for the differentiation between palatable or non-palatable foods.
Our results indicate that there is an epistatic interaction between TfAP-2 and Twz. In all the assays performed, where
TfAP-2 was overexpressed, loss of Twz was able to rescue the
TfAP-2 overexpression phenotypes. Also, we have previously
reported, and again shown here thatTwzis necessary for proper
TfAP-2transcription [6]. Furthermore, in mHypoE-N25/2 cells, which are derived from the mouse hypothalamus, a proximity ligation assay showed that throughout the cytoplasm mouse AP-2b
and Kctd15 interact directly (see figure 9A). The question is what is the function of this interaction? In a yeast two-hybrid screen, using a human brain cDNA library, KCTD1 was identified as a binding partner for AP-2a, a paralogous protein to AP-2b. Transient transfection assays, using AP-2-binding site containing promoters, established that KCTD1 actively repressed AP-2a -mediated transactivation, demonstrating that the function of KCTD1 was to inhibit TFAP2a activity. This is not what we observed for Drosophila TfAP-2 and Twz, where Twz was required for TfAP-2 activity. Mouse AP-2b interacts with Ube2i [26], a sumoylation enzyme, and in Drosophila Twz interacted directly with theDrosophilaUbe2i homologue Lesswright (Lwr) in a large-scale yeast two-hybrid screen [9]. We show that in mHypoE-N25/2 cells mouse AP-2b and Kctd15, both directly interact with the sumoylation enzyme Ube2i. It is possible that Twz/Kctd15 acts like a scaffold where TfAP-2/AP-2b is either sumoylated or ubiquitinated, as many KCTD family members also interact with the ubiquitination apparatus [43,44]. This
post-Figure 9. Detection of AP-2band Kctd15 interactions in mHypoE-N25/2 cells using PLA.The images were acquired in single z-plane. PLA
signals are shown in red (increased intensity projection) and the nuclei in blue (as stained by DAPI). Pictures were taken with 206magnification. (A)
PLA interaction between AP2band Kctd15, (A1) negative control without primary antibodies. Detection of AP-2b, Kctd15 and Ube2i interactions in
mHypoE-N25/2 cells using PLA. The images were acquired in single z-plane. PLA signals are shown in red (increased intensity projection) and the
nuclei in blue (as stained by DAPI). Pictures were taken with 206magnification. (B) PLA interaction between AP-2band Ube2i, (B1) negative control
without primary antibodies. (C) PLA interaction between Kctd15 and Ube2i, (C1) negative control without primary antibodies. (D) Western analysis of
mouse proteins, recovered from the entire brain, was performed using an anti-AP-2bantibody. Two bands were visible on the gel, the lower band
corresponded to the predicted size of AP-2bof 48 kDa, while the upper band corresponds to sumoylated AP-2b, which should be should be
,60 kDa.
doi:10.1371/journal.pgen.1004499.g009
translational modification might be required for TfAP-2/AP-2b
activation. In both Drosophila CNS and mouse hypothalamus
TfAP-2 andTfap2btranscription levels went up after starvation. InDrosophilathis increase in transcription requiredTwz. It could be that satiation levels regulate TfAP-2/Tfap2b and Twz/Kctd15 interactions, which in turn regulates TfAP-2/Tfap2b post-translational modification to increase TfAP-2/Tfap2b activity. During starvation or in conditions of dietary restriction TfAP-2 and Twz could interact to activate 2 and thus induce TfAP-2 expression (see figure 1A and 1C). Furthermore under extreme conditions, more Twz may be needed, this is supported by the fact that Twz was transcriptionally induced only after 48 h of starvation. We have demonstrated previously thatTwzexpression does not require TfAP-2 [6]. Although we have not demonstrated it, in the mouse hypothalamus under low nutritive conditions Tfap2b and Kctd15 could interact to initiate sumoylation and activation of Tfap2b, which could in turn induce consummatory behavior.
In conclusion, our data suggests that the human obesity-linked genes TFAP2B and KCTD15 could directly interact in regions of the brain known to regulate feeding behavior. We demonstrated that not only do theDrosophilahomologues genetically interact, but in a mouse hypothalamic cell line the mouse homologues physically interact. Furthermore, AP-2band Kctd15 co-localize in regions of the mouse hypothalamus known to regulate feeding behavior. In this model Kctd15 could act like a scaffold where AP-2bwould bind to be either sumoylated, in a fashion similar to the Kctd1 and AP-2a, or possibly ubiquitinated. This post-translational modification would then change AP-2b function and allow it to induce noradrenalin signaling to induce consummatory behavior.
Materials and Methods
Fly stocks and maintenance
w*, P{w[+mW.hs] = GawB}elav[C155], w*; P{w[+mC] =
Tdc2-GAL4.C}2,y1 w[*]; P{w[+mC] = UAS-AP-2.PB}a4-2,y1 w*; P{w[+mC] = UAS-NaChBac-EGFP}4and the RNAi linesy1 v1; P{TRiP.JF01908}attP2 Dsk, y1 v1; P{TRiP.J-F03500}attP2 Tfap-2 (referred to as TfAP2RNAi2) and y1 v1; P{TRiP.JF01867}attP2 Twz (referred to as TwzRNAi2) were received from the Bloomington Stock Center (Table 1).TfAP-2 (y1w3; P{KK109052}VIE-260B, referred to as TfAP-2RNAi1) and Twz (y1w3; P{KK107922}VIE-260B, referred to as
TwzRNAi1) RNAi flies were obtained from the Vienna Drosophila
RNAi Centre (VDRC, Vienna, Austria) (Table 1).w; Dilp2-GAL4
was a gift from Dr. Eric Rulifson [45];w; Dsk-GAL4andw; UAS-Dsk line were a gift from Dr. Barry Ganetzky [19,20]. All flies, unless otherwise stated, were maintained on enriched Jazz mix standard fly food (Fisher Scientific). Flies were maintained at 25uC in an incubator at 60% humidity on a 12:12 light:dark cycle. Flies crossed to GAL4 drivers and controls were raised at 18uC until the adults emerged; once collected adults were raised at 29uC for the appropriate times. In all assays, the GAL4 drivers and UAS transgenic flies were crossed to w1118flies and their F1 progeny
used as controls.
Capillary feeding (CAFE) and antagonist assay
This method was modified from Ja et al. 2007 [15]. A vial, 9 cm by 2 cm (height6diameter), containing 1% agarose (5 cm
high) to provide moisture and humidity for the flies, was used for this assay. A calibrated capillary glass tube (5ml, VWR International) was filled with liquid food which contains 5% sucrose, 5% yeast extract and 0.5% food-coloring dye. Mineral oil was used to prevent the liquid food from evaporating. The vial
was covered with paraffin; a capillary tube was inserted from the top through the paraffin. The experimental set up was kept at 25uC and activity was recorded for 24 h using a HD camera (Panasonic SDS90). The initial and final food level in the capillary tube was marked to determine total food intake. Number of feeding bouts per fly was counted from the recording; average meal size was calculated by dividing the total food intake by the number of feeding bouts. Five 5–7 day old males per vial were used for this assay.
Feeding after starvation
Twenty 5–7 day old males were maintained in a vial containing 1% agarose for 16 h. They were then transferred to normal food vials (5% sucrose, 5% yeast extract and 1% agarose) and allowed to feed for 20 minutes, then transferred to a second food vial containing normal food (5% sucrose, 5% yeast extract and 1% agarose) and 2% blue or green food-coloring dye (Dr. Oetker) and allowed to feed for 15 minutes. After this time the abdomen of each fly was observed using dissecting microscope (DV4, Zeiss) and the color of the gut was scored. The percentage of overeaters was calculated by dividing those with blue colored guts by the total number of flies observed.
Antagonist assays
Newly eclosedTfAP-2overexpressing male flies were collected and isolated on normal food for 3 days. After this time they were fed by CAFE assay method [15]. Calibrated capillary glass tubes (5ml, VWR) were filled with either 1 mM SR 27897 [17,18] or 3 mM of Phentolamine [46], prepared in liquid food (5% of sucrose and 5% yeast extract), a layer of mineral oil was used to prevent the liquid food evaporation from the capillary tube. These tubes were inserted from the top through paraffin film into the chambers. After 2–3 days of feeding the flies were used for the various assays performed.
RNA purification
The phenol-chloroform method was used for RNA extraction from tissue samples [47]. Fifty fly heads were homogenized with 800ml TRIzol (Invitrogen, USA), 200ml Chloroform (Sigma-Aldrich) was added and samples were centrifuged at 12000 rpm for 15 minutes at 4uC. The aqueous layer, which contained RNA, was separated and 500ml isopropanol (Solvaco AB, Sweden) was added.The RNA was precipitated by storing the samples at 2
32uC for 2 h. Samples were centrifuged at 12000 rpm for 10 minutes at 4uC, to collect the RNA pellets, which were then washed with 75% ethanol (Solvaco AB, Sweden) to remove the organic impurities. Samples were allowed to air dry to remove any traces of ethanol. Dried RNA pellets were dissolved in 21.4ml of RNAse free water (Qiagen GmBH, Germany) and 2.6ml of DNAse incubation buffer (Roche GmBH, Germany). The samples were incubated at 75uC for 15 minutes to ensure complete dissolution of RNA-pellets. 2ml of DNAse I (10 U/ml, Roche GmBH, Germany) was added to each sample, and incubated at 37uC for 3 hr to remove DNA contamination. DNAse was deactivated by incubating the samples at 75uC for 15 minutes. Removal of DNA was confirmed by PCR using Taq polymerase (5 U/ml, Biotools B & M Labs, Spain), followed by agarose gel
electrophoresis. The RNA concentration was measured using a nanodrop ND 1000 spectrophotometer (Saveen Werner).
cDNA synthesis
M-MLV Reverse Transcriptase (200 U/ml, Invitrogen, USA) by
following manufactures instructions. cDNA synthesis was con-firmed by PCR followed by agarose gel electrophoresis.
qRT-PCR
Relative expression levels of three housekeeping genes (EF-1, Rp49&RpL11) and of the genes of interest were determined with quantitative RT-PCR (qPCR). Each reaction, with a total volume of 20ml, contained 20 mM Tris/HCl pH 9.0, 50 mM KCl, 4 mM MgCl2, 0.2 mM dNTP, DMSO (1:20) and SYBR Green (1:50000). Template concentration was 5 ng/ml and the
concen-tration of each primer was 2 pmol/ml. Primers were designed with
Beacon Designer (Premier Biosoft) using the SYBR Green settings. All qPCR experiments were performed in duplicates; for each primer pair a negative control with water and a positive control with 5 ng/ml of genomic DNA were included on each plate. Amplifications were performed with 0.02mg/ml Taq DNA polymerase (Biotools, Sweden) under the following conditions: initial denaturation at 95uC for 3 min, 50 cycles of denaturing at 95uC for 15 sec, annealing at 52.8–60.1uC for 15 sec and extension at 72uC for 30 sec. Analysis of qPCR data was performed using MyIQ 1.0 software (Bio-Rad) as previously reported [48]. Primer efficiencies were calculated using Lin-RegPCR [49] and samples were corrected for differences in primer efficiencies. The GeNorm protocol described by Vande-sompele et al. [50] was used to calculate normalization factors from the expression levels of the housekeeping genes. Grubbs’ test was performed to remove outliers. Differences in gene expression between groups were analyzed with ANOVA followed by Fisher’s PLSD test where appropriate. P,0.05 was used as the criterion of statistical significance. The following primers were used:EF-1F: 59-GCGTGGGTTTGTGATCAGTT-39, R: 59 -GATCTTCTC-CTTGCCCATCC-39; Rp49 F: 59 -CACACCAAATCTTACA-AAATGTGTGA-39, R: 59-AATCCGGCCTTGCACATG-39;
RpL11 F: 59-CCATCGGTATCTATGGTCTGGA-39, R: 59 -CATCGTATTTCTGCTGGAACCA-39, TfAP-2 F: 59 -CTAA-GAGCAAGAACGGAG-39, R: 59 -AACCAAGGATGTCAG-TAG-39; Tiwaz F: 59-GCCACATTCTGAACTTTATG-39, R: 59-CACCAAATAGTTGCCATT-39; Dsk F: 59 -CCGATCC-CAGCGCAGACGAC-39, R: 59 -TGGCACTCTGCGACC-GAAGC-39
Mouse experimental procedures
Ethical statement. All animal procedures were approved by the local ethical committee in Uppsala and followed the guidelines of European Communities Council Directive (86/609/EEC).
Tissue collection and sectioning- Adult, male C57BL/6J mice (Taconic M&B, Denmark) were anesthetized with an intraperito-neally injection of sodium pentobarbital (90 mg/kg IP; Apoteks-bolaget, Sweden). Transcardial perfusion was performed through the left ventricle with phosphate-buffered saline (PBS), followed by 4% formaldehyde (HistoLab, Sweden), and brains were excised. Tissues were stored in 4% formaldehyde over night and sections were made by fixation in zinc-formalin (Richard-Allan Scientific, USA) for 18–24 h at 40uC, before dehydration and paraffin infusion with a Tissue-Tek vacuum infiltration processor (Miles Scientific, USA). Sections were cut (7mm) using a Microm 355S STS cool cut microtome, mounted on Superfrost Plus slides (Menzel-Gla¨ser, Germany), dried over night at 37uC and stored at 4uC.
Fresh tissue collection. 17 adult male C57BL/6J mice (Taconic M&B, Denmark) were used for fresh dissection of the hypothalamus. The animals were maintained in a temperature-controlled room on a 12-h light-dark cycle where they had free
Table 1. Information about RNAi lines, including possible number of off-target genes. Trans-Formant ID Construct ID Library CG number Gene On targets Off targets s19 CAN repeats 101552 109052 KK CG7807 TfAP-2 1 0 1 2 110265 107922 KK CG10440 Tiwaz 1 3 0.99 3 P{TRIP.J03500} JF03500 TRIP-1 CG7807 TfAP-2 1 0 1 2 P{TRIP.JF01852} JF01852 TRIP-1 CG10440 Tiwaz 1 0 1 2 doi:10.1371/journal.pg en.1004499.t001
access to food and water at all times unless anything else stated. Six mice were fed normal chow until dissection; additional six mice were given chow, but were food deprived for 24 h before dissection to study starvation effects on gene expression. For diet-induced obesity, five mice were fed high fat western diet (R638, Lantma¨nnen, Sweden) during eight weeks prior dissection. The diet-induced obesity mice weight was monitored weakly and compared with normal chow fed mice. Two-way ANOVA with P,0.05 was calculated to ensure that the obese mice were significantly heavier than the controls at the day of dissection. Mice were sacrificed by cervical dislocation during the light period and all dissections were performed on ice. A coronal brain matrix (Alto, 1 mm) was used to facilitate the excised of the hypothal-amus. Tissues were placed in RNA-later (Invitrogen) for 2 h at RT before frozen at280uC.
RNA extraction. Tissue collected from mice on the same diet was pooled before RNA extraction. RNA was extracted using Absolutely RNA Miniprep Kit (Agilent Technologies, USA). Briefly, the tissue was mixed with Lysis Buffer,b-mercaptoethanol and 1 mm RNAse free glass beads before homogenized using a Bullet blender (Averill Park, USA). The homogenate was spun through a prefilter spin cup in a Heraesus Fresco 21 centrifuge at maximum speed at RT, before mixed with 70% ethanol (Solveco, Sweden) in a 1:1 ratio to precipitate the RNA. The solution was centrifuged through a RNA binding spin cup, followed by salt buffer washes. DNase Digestion buffer and RNase-Free DNase 1 were then added to the RNA binding spin cup and allowed to incubate for 15 min at 37uC followed by additional washes in salt buffer prior to RNA elution. Concentration was measured using a nanodrop ND-1000 spectrophotometer.
cDNA synthesis. Extracted RNA was used as template for cDNA synthesis. 2mg RNA was added to a 26RT buffer and 206RT enzyme master mix (High Capacity RNA-to-cDNA Kit,
Applied Biosystem, USA), final volume was adjusted to 20mL with
DEPC-treated water. Samples were incubated for 37uC for 60 min followed by 95uC for 5 min. The cDNA was diluted to 5 ng/ml template in sterile water.
Primer design and qPCR. All primers were designed using Beacon primer design 8 (Premier Biosoft). For sample amplifica-tion following primers were used KCTD15 F: 59 -CACCAAG-TACCCTGACTC-39, R 59 -AATAATGTTGCTTGAGACT-GT-39 and Tfap2b: F 59-TTACAGTCCTATACTCTCC-39, R 59-CTACGCTTCAGTCTTTAG-39. Three different reference genes were run: GADPH: F 59 -GCCTTCCGTGTTCCTACC-39, R 59-GCCTGCTTCACCACCTTC-39, mRPL19: F 59 -AATCGCCAATGCCAACTC-39, R 59 -GGAATGGACAGT-CACAGG-39 and histone H3b: F 59 -CCTTGTGGGTCT-GTTTGA-39, R 59-CAGTTGGATGTCCTTGGG-39.
For each qPCR reaction iQ SYBR Green supermix (Bio-rad, Sweden) was used, to which 5ml cDNA (5 ng/ml template) and
100 pmol/ml of each primer was added. Final volume was adjusted to 20mL with water. Each sample was run in triplicate, a negative control for each primer pair and a positive control was included on each plate. All experiments were repeated twice. iCycler real-time detection instrument (Bio-Rad Laboratories) were used and the reaction followed these conditions: initial denaturation for 30 sec at 94uC followed by 45 cycles of 10 sec at 94uC, 30 sec at 53–63uC (optimal temperature for each primer pair) and 30 sec at 72uC. Thereafter a melting curve was performed by 81 cycles of 10 sec intervals where the temperature increased 0.5uC per cycle, starting from at 55uC.
Analyses were performed as previously described under the qRT-PCR section. MyIQ 1.0 software was used to analyse the
qPCR data and primer efficiency was calculated using Lin-RegPCR. Grubbs test was performed to remove outliers in the primer efficiency calculations before correcting the samples for primers efficiency. A normalization factor was obtained by using the expression levels of the housekeeping genes for calculations in GeNorm. The normalization factor was then used to calculate the relative mRNA expression in the samples. Differences in gene expression between the diets were analysed with one-way ANOVA, where Bonferroni’s multiple comparison test was used for post-hoc analysis. P.0.05 was used as significance.
Fluorescent immunohistochemistry on paraffin embedded sections. Sections were deparaffinized in X-trasolv (Medite histotechnik, Germany), rehydrated through a series of ethanol solutions ending up in water, followed by PBS washes. Antigen retrieval was performed by heating the sections to 100uC in 0.01 M citric acid pH 6.0 (Sigma-Aldrich, USA). After PBS washes, sections were incubated with 1u antibodies overnight at 4uC. After PBS rinsing, sections were incubated for two h in 2u
diluted in supermix. Sections were washed in PBS, stained with DAPI (1:1250, Sigma-Aldrich, USA) and mounted in DTG media with antifade (diazabicyclo(2.2.2)octane in glycerol). Pictures were taken using a fluorescent microscope (Zeiss Axioplan2 imaging) connected to a camera (AxioCam HRm) with the Carl Zeiss AxioVision version 4.7 software.
Antibodies for immunohistochemistry
Primary antibodies. Rabbit-anti-AP2b(1:100, Abcam, En-gland), mouse-anti-KCTD15 (1:100, Abcam, EnEn-gland), chicken-anti-NSE (1:200, Abcam, England) or chicken-a-GFAP (1:800, Abcam, England) antibodies diluted in supermix (Tris-buffered saline, 0.25% gelatin, 0.5% Triton X-100).
Secondary antibodies. Goat-anti-mouse-594, goat-chicken-488, goat-rabbit-594 or goat-mouse-488 anti-bodies (1:200, Invitrogen, USA).
Proximity ligation assay (PLA)
The immortalized embryonic mouse hypothalamus cell line N 25/2 were grown (Detailed methods on cell culture maintenance can be found in SI Experimental procedures) on glass slides (coated with 10mg/ml poly-L-lycine) were
fixed in 4% paraformaldehyde (Sigma-Aldrich, USA) for 15 min and rinsed with PBS. The Duolink II fluorescence kit (orange detection reagents, Olink Biosciences, Sweden) was used to run in situ proximity assay (PLA) on the fixed cells according to manufacturer’s instruction. Primary rabbit-anti-AP2b, mouse-anti-KCTD15, goat-anti-UBC9 antibodies (Ab-cam, England) were diluted 1:100, 1:100, 1:200 correspon-dently in Antibody Diluent supplied by the kit. Negative controls were run without primary antibodies. Protein inter-actions were detected with PLA probes in combination anti-rabbit PLUS and anti-mouse MINUS, anti-anti-rabbit PLUS and anti-goat MINUS or anti-mouse PLUS and anti-goat MINUS. Slides were mounted using Duolinkin situMounting Medium with DAPI. Pictures were taken using a fluorescent microscope (Zeiss Axioplan2) connected to a camera (AxioCam HRm) with the Carl Zeiss AxioVision version 4.7 software (Carl Zeiss, Germany).
Cell culture
humidified atmosphere with 5% CO2 in air at 37uC. Growth medium was changed every 2 days and cells were split with trypsin regularly with a ratio of 1:2–1:3 usually every 3 days.
Western analysis
We performed a western blot analysis of AP-2bin brain tissue from adult, male C57Bl6/J mice (Taconic M&B, Denmark). Briefly, the tissue was homogenized in homogenization buffer (50 mM Tris, 150 mM NaCl, 4 mM MgCl, 0.5 mM EDTA, 2% Triton X-100 and 1 mM Protease inhibitor PMSF (Sigma-Aldrich, USA) diluted in isopropanol). Protein concentrations were determined by protein assay DC (Bio-Rad, Hercules, USA) according to the manufacturer’s instructions. Equal amounts of protein (200mg or 13mg/ml) were separated, together with PageRuler prestained protein ladder (Fermentas, Canada), on a Mini-Protean TGX gel (4–10%, Bio-Rad, Hercules, USA) in running buffer (0.1% SDS, 0.025 Tris base and 0.192 M glycine) by gel electrophoresis. The proteins were transferred to a Immobilon-P polyvinylidene fluoride (PVDF) membrane (Milli-pore, Billerica, USA) in transfer buffer (0.025 Tris base, 0.192 M glycine and 20% methanol) and pre-blocked for 1 h in blocking buffer (5% non-fat dry milk (Bio-RAD, Hercules, USA) diluted in 1.5 M NaCl, 0.1 M Tris, 0.05% Tween-20, pH 8.0). The membrane was cut in the middle, giving two membranes with equally loaded protein samples. One half of the membrane was hybridized with the primary antibody against AP-2b (diluted 1:200, rabbit-anti-AP2b, Abcam, England). The other half of the membrane was hybridized with AP-2bprimary antibody that was pre-blocked with excess of the same synthetic peptide (sequence (NH2-) MHSPPRDQAA IMLWKLVENV KYEDIYEDRH DGVPSHSSRL SQLGSVSQGP (-CONH2), Abcam, England) that was used to generate the antibody. The hybridization was then performed overnight at 4uC. After washes in water, the membranes were incubated for 1 h with horseradish peroxidase conjugated secondary antibody (diluted 1:10000, goat-anti-rabbit, Invitrogen, USA) followed by detection with the enhanced chemiluminescent (ECL) method. The membranes were incubated for 3 min in a 1:1 mixture of luminol/enhancer and peroxidase buffer solutions (Immun-Star HRP, Bio-Rad, Hercules, USA) and developed on High performance chemiluminescence film (GE healthcare, Waukesha, USA).
Statistical analysis
Mean and standard error from all replicates of each experiment was calculated. All analysis was performed with GraphPad Prism 4, and used ANOVA with appropriate post hoc analysis for multiple comparisons. The type of analysis performed for each assay is specified in the appropriate Figure legend.
Supporting Information
Figure S1 (A–B) Relative level ofTfAP-2andTwzexpression in octopaminergic neurons in males kept at either (A) 29uC or (B) 18uC, to verify the efficiency of the various UAS constructs. (C) Relative level of Dsk expression in Dsk expressing neurons in males, to verify the efficiency of theUAS-DskRNAiconstruct. (In all
assays n = 10 qPCR runs). In A different letters indicate similar groups (i.e. ‘a’ is significantly different than ‘b’ or ‘c’ and so on, one-way ANOVA with Bonferroni post hoc test for multiple comparisons, P,0.05). In G a double asterisk indicates significant difference one-way ANOVA with Bonferroni post hoc test for multiple comparisons, ** P,0.005). Error bars represent the SE (SEM).
(TIF)
Text S1 Description of RNAi line verification: To verify the efficiency of the RNAi linesy1 v1; P{TRiP.JF03500}attP2 Tfap-2 (referred to as TfAP2RNAi2) and y1 v1; P{TRiP.J-F01867}attP2 Twz (referred to as TwzRNAi2) we crossed them to theTdc2-GAL4 driver and performed qPCR. To verify the efficiency of theDskRNAi liney1 v1; P{TRiP.JF01908}attP2 Dsk,we crossed it toDsk-GAL4.
(DOCX)
Acknowledgments
The authors would like to thank Dr. Eric Rulifson for his kind gift of Dilp2-GAL4flies and Professor Barry Ganetzky for his kind gift ofDsk-GAL4and UAS-Dskflies. We would like to thank Mikaela Eriksson and Johan A˚ lund for their help with some of the qPCR experiments.
Author Contributions
Conceived and designed the experiments: MJW RF HBS. Performed the experiments: MJW PG JR GZ MGH SB AK ZK EP. Analyzed the data: MJW PG JR GZ MGH SB AK ZK EP RF HBS. Contributed reagents/ materials/analysis tools: MJW RF HBS. Wrote the paper: MJW RF HBS.
References
1. Zhao J, Bradfield JP, Li M, Wang K, Zhang H, et al. (2009) The role of obesity-associated loci identified in genome-wide association studies in the determination of pediatric BMI. Obesity 17: 2254–2257.
2. Willer CJ, Speliotes EK, Loos RJ, Li S, Lindgren CM, et al. (2009) Six new loci associated with body mass index highlight a neuronal influence on body weight regulation. Nat Genet 41: 25–34.
3. Renstrom F, Payne F, Nordstrom A, Brito EC, Rolandsson O, et al. (2009) Replication and extension of genome-wide association study results for obesity in 4923 adults from northern Sweden. Hum Mol Genet 18: 1489–1496. 4. Bauer F, Elbers CC, Adan RA, Loos RJ, Onland-Moret NC, et al. (2009)
Obesity genes identified in genome-wide association studies are associated with adiposity measures and potentially with nutrient-specific food preference. Am J Clin Nutr 90: 951–959.
5. Monge I, Krishnamurthy R, Sims D, Hirt F, Spengler M, et al. (2001) Drosophila transcription factor AP-2 in proboscis, leg and brain central complex development. Development 128: 1239–1252.
6. Williams MJ, Goergen P, Rajendran J, Klockars A, Kasagiannis A, et al. (2014) Regulation of aggression by obesity-linked genes TfAP-2 and Twz through octopamine signaling in Drosophila. Genetics 196: 349–362.
7. Williams M, Alme´n M, Fredriksson R, Schio¨th H (2012) What model organisms and interactomics can reveal about the genetics of human obesity. Cell Mol Life Sci 69: 3819–3834.
8. Zarelli VE, Dawid IB (2013) Inhibition of neural crest formation by Kctd15 involves regulation of transcription factor AP-2. Proc Natl Acad Sci U S A 110: 2870–2875.
9. Giot L, Bader JS, Brouwer C, Chaudhuri A, Kuang B, et al. (2003) A protein interaction map of Drosophila melanogaster. Science 302: 1727–1736. 10. Wank S, Pisegna J, de Weerth A (1994) Cholecystokinin receptor family.
Molecular cloning, structure, and functional expression in rat, guinea pig, and human. Ann N Y Acad Sci 713: 49–66.
11. Mo¨nnikes H, Lauer G, Arnold R (1997) Peripheral administration of cholecystokinin activates c-fos expression in the locus coeruleus/subcoeruleus nucleus, dorsal vagal complex and paraventricular nucleus via capsaicin-sensitive vagal afferents and CCK-A receptors in the rat. Brain Res 770: 277– 288.
12. So¨derberg J, Carlsson M, Na¨ssel D (2012) Insulin-Producing Cells in the Drosophila Brain also Express Satiety-Inducing Cholecystokinin-Like Peptide, Drosulfakinin. Front Endocrinol 3: 109.
13. Zhang T, Branch A, Shen P (2013) Octopamine-mediated circuit mechanism underlying controlled appetite for palatable food in Drosophila. Proc Natl Acad Sci U S A 110: 15431–15436.
14. Al-Anzi B, Armand E, Nagamei P, Olszewski M, Sapin V, et al. (2010) The Leucokinin Pathway and Its Neurons Regulate Meal Size in Drosophila. Curr Biol 20: 969–978.
15. Ja WW, Carvalho GB, Mak EM, de la Rosa NN, Fang AY, et al. (2007) Prandiology of Drosophila and the CAFE assay. Proc Natl Acad Sci U S A 104: 8253–8256.
16. Luan H, Lemon WC, Peabody NC, Pohl JB, Zelensky PK, et al. (2006) Functional dissection of a neuronal network required for cuticle tanning and wing expansion in Drosophila. J Neurosci 26: 573–584.