The Unique Chemistry of Eastern
Mediterranean Water Masses Selects for
Distinct Microbial Communities by Depth
Stephen M. Techtmann1,2*, Julian L. Fortney1,2, Kati A. Ayers2,3, Dominique C. Joyner1,2, Thomas D. Linley4, Susan M. Pfiffner2,5, Terry C. Hazen1,2,3,5,6
1Department of Civil and Environmental Engineering, University of Tennessee, Knoxville, Tennessee, United States of America,2Center for Environmental Biotechnology, University of Tennessee, Knoxville, Tennessee, United States of America,3Department of Earth and Planetary Sciences, University of Tennessee, Knoxville, Tennessee, United States of America,4Ocean Lab, University of Aberdeen, Newburgh, Aberdeenshire, United Kingdom,5Department of Microbiology, University of Tennessee, Knoxville, Tennessee, United States of America,6Biosciences Division, Oak Ridge National Laboratory, Oak Ridge, Tennessee, United States of America
Abstract
The waters of the Eastern Mediterranean are characterized by unique physical and chemi-cal properties within separate water masses occupying different depths. Distinct water mas-ses are present throughout the oceans, which drive thermohaline circulation. These water masses may contain specific microbial assemblages. The goal of this study was to examine the effect of physical and geological phenomena on the microbial community of the Eastern Mediterranean water column. Chemical measurements were combined with phospholipid fatty acid (PLFA) analysis and high-throughput 16S rRNA sequencing to characterize the microbial community in the water column at five sites. We demonstrate that the chemistry and microbial community of the water column were stratified into three distinct water mas-ses. The salinity and nutrient concentrations vary between these water masmas-ses. Nutrient concentrations increased with depth, and salinity was highest in the intermediate water mass. Our PLFA analysis indicated different lipid classes were abundant in each water mass, suggesting that distinct groups of microbes inhabit these water masses. 16S rRNA gene sequencing confirmed the presence of distinct microbial communities in each water mass. Taxa involved in autotrophic nitrogen cycling were enriched in the intermediate water mass suggesting that microbes in this water mass may be important to the nitrogen cycle of the Eastern Mediterranean. The Eastern Mediterranean also contains numerous active hy-drocarbon seeps. We sampled above the North Alex Mud Volcano, in order to test the effect of these geological features on the microbial community in the adjacent water column. The community in the waters overlaying the mud volcano was distinct from other communities collected at similar depths and was enriched in known hydrocarbon degrading taxa. Our re-sults demonstrate that physical phenomena such stratification as well as geological phe-nomena such as mud volcanoes strongly affect microbial community structure in the Eastern Mediterranean water column.
OPEN ACCESS
Citation:Techtmann SM, Fortney JL, Ayers KA, Joyner DC, Linley TD, Pfiffner SM, et al. (2015) The Unique Chemistry of Eastern Mediterranean Water Masses Selects for Distinct Microbial Communities by Depth. PLoS ONE 10(3): e0120605. doi:10.1371/ journal.pone.0120605
Academic Editor:Fabiano Thompson, Universidade Federal do Rio de Janeiro, BRAZIL
Received:August 8, 2014
Accepted:January 24, 2015
Published:March 25, 2015
Copyright:© 2015 Techtmann et al. This is an open access article distributed under the terms of the Creative Commons Attribution License, which permits unrestricted use, distribution, and reproduction in any medium, provided the original author and source are credited.
Data Availability Statement:Quality-filtered 16S rRNA sequence files are available from the MG-RAST database (http://metagenomics.anl.gov/), accession numbers 4571952.3–4571971.3.
Introduction
Microbial diversity and activity are strongly dependent upon the environments in which mi-crobes live [1,2]. Localized chemistry can strongly impact microbial community structure and function [3,4]. Environmental factors such as nutrients and temperature are important con-straints on the microbes that live in a particular setting [5–7]. More recently, physical factors such as currents and oceanographic water masses have been shown to be important in dictating localized community structure [8–14]. The Mediterranean Sea has a unique chemistry with the waters being characterized by high salinity (38–39 psu relative to 35 psu in the open ocean), el-evated bottom water temperatures (12–13°C relative to 4°C at similar depths and latitudes in the Atlantic) and ultraoligotrophic conditions (extreme phosphate limitation) [15].
The waters of the Eastern Mediterranean are stratified with distinct water masses present at different depths [16]. The upper water mass in the Eastern Mediterranean is the Atlantic Water (AW) occupying depths down to around 150 m. Salinity of the AW increases as it flows from the Strait of Gibraltar (*36.5 psu) to the Levantine Basin in the Eastern Mediterranean
(*38.6) [16]. Below the AW, at depths between 150–400 m, is the Levantine Intermediate
Water (LIW). The LIW is characterized by temperatures around 15°C with high salinity (39 psu). LIW forms in the Levantine Basin of the Eastern Mediterranean and flows at intermediate depths east to west. The Eastern Mediterranean Deep Water (EMDW) occupies depths below 400 m. The water temperature of the EMDW stabilizes at approximately 13.5°C. The unique chemistry and complex oceanographic regimes of the Eastern Mediterranean may select for distinct microbial communities throughout the water column, which are adapted for growth in nutrient limited environments.
The microbial communities of the Northwestern and Northeastern Mediterranean have been studied to investigate how microbes are affected by the ultraoligotrophic conditions of the Mediterranean [17,18]. For the most part these studies have focused on particular groups of microbes and not entire communities. Two studies focusing on phototrophs, indicated that mi-crobes adapted for growth under low nutrient conditions dominate the phototrophic commu-nity in areas under nutrient limitation [17,18]. Metagenomic analysis of one site in the Eastern Mediterranean showed that an increased number of proteins involved in phosphate transport and processing are an important adaptation to growth under phosphate limiting conditions [19].
It has been hypothesized that the skewed N:P ratio of the Eastern Mediterranean may be due to high rates of nitrogen fixation [20,21]. However, multiple studies have demonstrated that nitrogen fixation rates are very low in the photic zone of Eastern Mediterranean waters [22,23]. More recent studies demonstrated that nitrogen fixation is much higher in the aphotic zone of the Eastern Mediterranean, with a larger percentage of nitrogen fixation in the Eastern Mediterranean occurring in the deep water [24].
Additional studies have investigated the changes that occur in the microbial community throughout the water column. In general bacterial numbers decrease from mid 105cells/ml in the surface waters to mid 104cells/ml in the bottom waters [25]. Yokokawaet al. (2010) dem-onstrated that there are differences in bacterial abundance and microbial community structure at different depths [25]. However, there were also localized distinctions between samples col-lected within the same water masses from different sampling stations. It was suggested that these site-specific differences could be attributed to local chemical differences, such as organic Competing Interests:This research was supported
matter load [25]. Most of the investigations into microbial community of the Eastern Mediter-ranean water column have focused on the Northeastern MediterMediter-ranean or off the coast of Isra-el. There is almost no information regarding the microbial community of the water column in the Southeastern Mediterranean, especially locations adjacent to the Nile River Delta.
Despite limited knowledge of the microbial community in the water column adjacent to the Nile River, several studies have investigated the microbial communities in the numerous natu-ral hydrocarbon seeps in the Nile Deep Sea fan [26–29]. The Nile Deep sea fan is a sedimentary turbiditic system extending from the Nile delta into the Eastern Mediterranean [30]. Recent work has indicated that mud volcanoes are found throughout the Nile Deep-Sea Fan, the Olympia field on the Mediterranean ridge, and the Anaximander Mountains in the Northeast-ern Mediterranean [31,32]. These natural seeps are hot spots of deep-sea life, and impact the diversity of microbes present in the seep-associated sediments [33]. Active mud volcanoes can emit large volumes of methane and other hydrocarbons and in turn have the potential to im-pact the microbial community of the water column overlaying these seeps.
Several studies have investigated the microbial community in mud volcano sediments throughout the Eastern Mediterranean [26,27,29]. These sediment communities are known to be diverse and contain a variety of microbes involved in sulfur oxidation, methanotrophy, methylotrophy, degradation of higher hydrocarbons, and anaerobic methane oxidation (AOM) [27–29]. In this study, we collected samples from the water column above the North Alex Mud Volcano in order to determine the effect of geological phenomena such as hydrocar-bon seeps on structuring the microbial community of the water column.
The Eastern Mediterranean is known for the stratification of the water column and the pres-ence of a number of active mud volcanoes. Our study aims to characterize the effect of water stratification and mud volcanism on the microbial community in the water column of the Southeastern Mediterranean. We combine chemical measurement with phospholipid fatty acid (PLFA) analysis and massively-parallel 16S rRNA sequencing to characterize microbial abun-dance and diversity at five stations. PLFA analysis provides a robust measure of microbial bio-mass as well as insights into the physiological state of the active microbial community in a sample [34]. Lipid biomarkers can also be used as indicators for the presence of particular mi-crobial groups [35]. 16S rRNA sequencing provides an in-depth look into which microbial taxa are present with much finer taxonomic precision than can be achieved with PLFA analysis alone. These complementary techniques were used in order to reduce the biases that any single technique would have and provide multiple lines of evidence for any conclusion [36].
Materials and Methods
Site Description and Permitting
Samples were collected between 11 and 15 October 2012 at five stations in the West Nile Delta region of the Nile Deep Sea Fan aboard the MV Fugro Navigator. This work was conducted in BP’s West Nile Delta Concession. No specific permits were required for collection of these samples. These field studies did not include the collection of any endangered or protected species.
Sample Collection
150 and 400 m. Another sample was taken at two-thirds of bottom depth. The fourth sample was collected 20 m above the sea floor. In total, 20 samples were collected (S1 Table). These sta-tions represented diverse sea floor features, including the North Alex Mud Volcano and the Al-exandria Canyon (Station 3 and 4 respectively,Fig. 1A).
Water was collected from each depth using Niskin bottles. 100 ml of water were frozen at
−20°C for analysis of dissolved organic carbon (DOC) and inorganic nutrients. Forty ml of
water were fixed in 4% formaldehyde and stored at 4°C for acridine orange direct counts Fig 1. Site Characterization.(A) Map of sampling locations. Station 3 (red) is the North Alex Mud Volcano. Maps of sampling sites were prepared using the ODV software package [38]. (B) CTD profile of Temperature and salinity for site 1 (depth 1230 m). Temperature measured in °C is shown in red. Salinity measured in Practical Salinity Units (psu) is shown in green. (C) Annotated T-S plot with data from the CTD profile of site 1. Three distinct water masses are visible below the surface mixed layer. The AW is characterized by water with salinities between 38.6 and 38.8 psu and temperatures between 16–18°C. The LIW is characterized by high salinity around 39.2 psu and temperatures around 16°C. The EMDW is characterized by waters with salinities near 38.8 and temperatures near 14°C. Visualization of CTD data was performed in R[39] using the oce package [37]. (D) Cell counts as determined by AODC and PLFA as a function of depth. At each station samples were taken in each of the three water masses. Samples from each station are represented by different symbols. Cell counts as determined by AODC are indicated by closed symbols. Cell numbers as estimated by PLFA measurements are shown by open symbols. The depths corresponding to each water mass are marked on the right side of the plot. Biomass is reported at cells/ml of seawater.
(AODC). Samples for microbial community analysis were collected using the large volume Stand Alone Particle Sampler (SAPS, Challenger Oceanic, UK with controller, battery and pump upgrades by Oceanlab, University of Aberdeen, Scotland). Between 62 and 123 L of sea-water were filtered at depth through a 292 mm diameter nylon filter with a pore size of 0.2μm
(volume filtered for each sample is listed inS1 Table). The filter was sectioned into thirds, one-third for DNA analysis, one-one-third for PLFA analysis, and one-one-third as an archive.
Geochemical Measurements
DOC, total dissolved nitrogen (TDN), and inorganic nutrients were measured at the SOEST Laboratory for Analytical Biogeochemistry (University of Hawaii). DOC and TDN were mea-sured using a Shimadzu High-Temperature TOC-L Combustion Analyzer (Shimadzu, Japan). DOC is reported as non-purgeable organic carbon (NPOC). Quality control testing for NPOC and TDN was conducted using purchased Deep Seawater Reference Material (DSRM) from the RSMAS Consensus Reference Materials (CRM) Project (http://yyy.rsmas.miami.edu/groups-/ biogeochem/CRM.html). Ammonia was measured fluorometrically following the method of Kerouel and Aminot (1997) [40]. Nitrate and nitrite were analyzed via the diazo reaction based on the methods of Armstronget al(1967) [41] and Grasshoff (1983) [42]. Silicate measure-ment is based on the reduction of silicomolybdate in acidic solution to molybdenum blue by ascorbic acid [42]. Orthophosphate concentrations were determined based on the colorimetric method of Murphy and Riley (1962) [43].
In order to identify patterns and similarities in the physical and chemical parameters of samples from the same water mass, Principle Component Analysis (PCA) of environmental data was performed in R using the prcomp command [39]. The data was centered so that the variables are shifted to be zero centered and scaled by dividing each number by the standard deviation. PERMANOVA analysis [44] was performed on a Euclidian distance of the normal-ized environmental data using the Adonis function in Vegan [45].
Acridine Orange Direct Cell Counts
AODC were performed as described previously [46]. Water samples for direct cell counts were preserved with 4% formaldehyde and stored at 4°C until processed. Cell counts were done with Zeiss Axioskop epifluorescence microscope (Carl Zeiss, Inc., Germany).
PLFA Extraction and Analysis
One-third of the SAPS pump filter was stored at−80°C for PLFA analysis. The filter was
trans-ferred to a muffled glass centrifuge tube using a solvent-rinsed forceps. The total lipids were ex-tracted using a two-phase extraction method with final ratio of methanol:chloroform:water buffer being 1:1:0.9 (v/v/v) and subsequently fractionated on a silicic acid column with only the polar lipids then transesterified into phospholipid fatty acid (PLFA) methyl esters [47]. The PLFA methyl esters were separated, quantified, and identified by gas chromatography–mass spectrometry (GC/MS) [47]. Archaeal lipids were not analyzed.
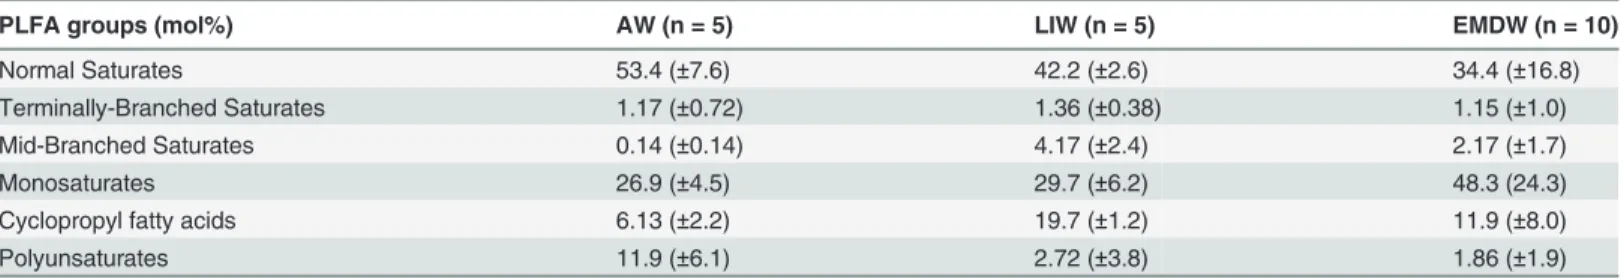
In addition to biomass estimates, PLFAs were grouped into lipid classes. The mole percent of each lipid class was determined for samples from each water mass. To test the hypothesis that lipid classes were differentially abundant in each water mass, one-way ANOVA was per-formed comparing the mole percent of each lipid class in samples grouped according to water mass. P values were corrected using the false discovery rate calculation in R. Tukey honest sig-nificant difference test was used to determine which water masses were sigsig-nificantly different from each other. The full list of lipids in each sample is presented inS2 Table.
DNA Extraction, Sequencing, Analysis
One-third of the SAPS filter was stored at−80°C for DNA analysis. DNA was extracted using a
modified Miller DNA extraction method [49]. Quality of extracted DNA was determined by measuring 260/280 and 260/230 ratios on a NanoDrop spectrophotometer (Thermo Scientific, Waltham, MA). Concentration of DNA was determined using picogreen (Life Technologies, Carlsbad CA). The V4 region of the 16S rRNA gene was amplified using Phusion DNA poly-merase (Thermo Scientific, Waltham, MA) with universal primers 515f and barcoded 806r, which are able to amplify both Bacterial and Archaeal sequences. Sequencing was performed on the Illumina MiSeq according to the protocol in Caporasoet al(2012) [50]. The resulting DNA sequences were analyzed using the QIIME version 1.8.0-dev pipeline [51]. Paired-end raw reads were assembled using fastq-join [52]. The assembled sequences were demultiplexed and quality filtered in QIIME to remove reads with phred scores below 20 (-q 19). Chimera de-tection was then performed on assembled reads using UCHIME [53,54]. Assembled, quality-filtered and chimera checked sequences were deposited at MG-RAST (http://metagenomics. anl.gov/) (accession number 4571952.3–4571971.3). Sequences were then clustered into opera-tion taxonomic units (OTUs, 97% similarity) with UCLUST [53] using the open reference clus-tering protocol. The resulting representative sequences were aligned using PyNAST [55] and given a taxonomic assignment using RDP [56] retrained with the May 2013 Greengenes re-lease. The resulting OTU table was filtered to keep OTUs that were present at greater than 0.005%, and then rarified to 13,753 sequences per sample (the minimum number of remaining sequences in the samples). The alpha diversity of samples was determined using the Shannon, Simpson, and phylogenetic diversity (whole tree diversity) metrics. To test the hypothesis that alpha diversity was significantly different between these three water masses ANOVA and Tukey honest significant difference test were performed. Bray-Curtis dissimilarity [57], weight-ed and unweightweight-ed unifrac distances [58] were calculated from the rarefied OTU table using the beta_diversity.py script in QIIME.
Statistical Analysis of Sequencing Data
LIW: 150–300 m, EMDW: 300–1210 m. There were five samples in the AW group, five sam-ples in the LIW group and ten samsam-ples in the EMDW group. PERMANOVA analysis was per-formed using 999 permutations. PERMANOVA analysis of all three groups will indicate if there is a significant difference between all three groups. To distinguish which water masses are different from each other, PERMANOVA analysis was done on subsets of the weighted Unifrac distance matrix that only include samples from two of the three water masses. These pair-wise PERMANOVAs were used to distinguish which water masses were different from each other.
To test if bacteria and archaeal populations were both stratified by water mass, the OTU table was split to separate OTUs identified as bacteria into one OTU table and OTUs identified as Archaea into another. Weighted Unifrac distances were determined for each of these do-main-specific OTU tables. NMDS analysis was performed using weighted Unifrac distances as described above. To determine if the Bacterial and Archaeal communities in the three water masses were different from each other, PERMANOVA analysis was performed using the Ado-nis function in the vegan package in R.
Environmental variables were fit to the weighted Unifrac distance matrix in order to test which environmental variables explain the differences observed in the beta diversity analysis. Temperature, dissolved oxygen, depth, salinity, sulfate, silicate, nitrate, inorganic phosphate, NPOC, and total nitrogen were fit to the weighted Unifrac distance matrix using the envfit function in the vegan package in R. The significance of the variable fitting was determined using 999 permutations. Variables that fit the data with a p value of less than 0.05 were plotted.
In order to test the hypothesis that microbial classes are differentially abundant between these water masses, one-way ANOVA was performed to compare the relative abundance each taxonomic order in samples from different water masses. P values were corrected using False Discovery Rate correction. Tukey honest significant difference test was used as a post hoc test to identify in which water masses the taxa were differentially abundant. Taxonomic orders that had an ANOVA corrected p value of less than 0.05 were considered to be significantly different. To further identify microbial taxa that were indicative a particular water mass, Indicator spe-cies analysis was performed in R using the IndVal function in the labdsv package [60]. Indica-tor species analysis seeks to identify taxa that are present in the majority samples of one group and absent in the majority of samples from other groups. Indicator species analysis calculates an IndVal as described in Dufrene and Legendre [61]. IndVal is the product of the relative fre-quency and relative average abundance of a species or OTU in a cluster. The maximum IndVal of 100% is observed when an OTU is present in all sites of only one sample group. To test the significance of the IndVal, p values were calculated with 100 iterations, where in each iteration, the sample groupings were randomly assigned and an IndVal determined. These randomized IndVals were compared to the IndVal arrived at using the defined groupings to determine the likelihood of that IndVal being arrived at randomly. The p values for the IndVal calculation were corrected for multiple comparisons using the false discovery rate correction.
Results
Site Description
Physical and chemical parameters were similar for samples from the
same water mass
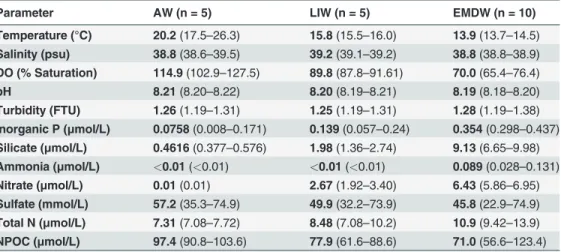
Water profiles of our sampling stations indicate that the salinity of the LIW is much higher than the AW and EMDW. Our data also show that the AW is characterized by low or below detection levels of inorganic nutrients, and high NPOC levels (mean 97.4μM) (Table 1andS1
Table). Inorganic nutrients concentrations increased in our samples throughout the LIW, whereas NPOC decreased with increasing depth (S2 Fig). Nutrient concentrations, NPOC, and salinity all remained fairly constant throughout the EMDW at these five sampling locations. PCA of environmental factors for the 20 water samples demonstrated that water samples from the same water mass cluster together on the PCA plot (Fig. 2). These distinct groupings corre-sponded to the three water masses. PERMANOVA of Euclidian distances demonstrated that samples from the same water mass were significantly different from samples from the other water masses (Ppermutated= 0.001).
Microbial abundance decreased with depth
Both AODC and PLFA biomass estimates indicate that the biomass was highest in the AW and gradually decreased with depth (Fig. 1D). Cell counts estimated by PLFA analysis were almost an order of magnitude lower than the cell numbers determined by AODC. Despite these dis-crepancies, both methods demonstrate that the microbial abundance in the AW was higher than in the intermediate and deep-water masses.
Lipid classes were differentially abundant in each water mass
The mole percent of polyunsaturated lipids in our samples was significantly different between these three water masses (ANOVA P = 0.0004). Polyunsaturated lipids comprised 11.9 mole percent of the lipids in the AW, whereas they made up 2.7% and 1.9 mol% in the LIW and EMDW respectively (Table 2). Mid-Branched saturates were also differentially abundant be-tween these water masses (ANOVA P = 0.02). The abundance of mid branched saturates was highest in the LIW and is significantly different from the abundance in the AW (Tukey HSD P = 0.005).
Table 1. Physical and geochemical parameters.Samples collected within the three water masses were re-ported together. Numbers in bold represent the mean value for that parameter. Numbers in parentheses rep-resent the range of values.
Parameter AW (n = 5) LIW (n = 5) EMDW (n = 10)
Temperature (°C) 20.2(17.5–26.3) 15.8(15.5–16.0) 13.9(13.7–14.5)
Salinity (psu) 38.8(38.6–39.5) 39.2(39.1–39.2) 38.8(38.8–38.9)
DO (% Saturation) 114.9(102.9–127.5) 89.8(87.8–91.61) 70.0(65.4–76.4)
pH 8.21(8.20–8.22) 8.20(8.19–8.21) 8.19(8.18–8.20)
Turbidity (FTU) 1.26(1.19–1.31) 1.25(1.19–1.31) 1.28(1.19–1.38)
Inorganic P (μmol/L) 0.0758(0.008–0.171) 0.139(0.057–0.24) 0.354(0.298–0.437)
Silicate (μmol/L) 0.4616(0.377–0.576) 1.98(1.36–2.74) 9.13(6.65–9.98)
Ammonia (μmol/L) <0.01(<0.01) <0.01(<0.01) 0.089(0.028–0.131)
Nitrate (μmol/L) 0.01(0.01) 2.67(1.92–3.40) 6.43(5.86–6.95)
Sulfate (mmol/L) 57.2(35.3–74.9) 49.9(32.2–73.9) 45.8(22.9–74.9)
Total N (μmol/L) 7.31(7.08–7.72) 8.48(7.08–10.2) 10.9(9.42–13.9)
NPOC (μmol/L) 97.4(90.8–103.6) 77.9(61.6–88.6) 71.0(56.6–123.4)
Fig 2. PCA analysis of physical and geochemical data.Salinity, inorganic phosphate, nitrate, ammonia, total nitrogen, silicate, temperature, salinity, sulfate, dissolved oxygen, and NPOC were used to construct the PCA plot. Color of symbols indicates the water mass from which that sample was taken (black corresponds to AW, blue corresponds to LIW, and orange corresponds to EMDW). Shape of symbols corresponds to the station from which they were taken. The percent explained by each of the depicted principle components are listed on the axis.
doi:10.1371/journal.pone.0120605.g002
Table 2. PLFA data.Mean values of various PLFA categories are shown for the three water masses present in the Eastern Mediterranean.
PLFA groups (mol%) AW (n = 5) LIW (n = 5) EMDW (n = 10)
Normal Saturates 53.4 (±7.6) 42.2 (±2.6) 34.4 (±16.8)
Terminally-Branched Saturates 1.17 (±0.72) 1.36 (±0.38) 1.15 (±1.0)
Mid-Branched Saturates 0.14 (±0.14) 4.17 (±2.4) 2.17 (±1.7)
Monosaturates 26.9 (±4.5) 29.7 (±6.2) 48.3 (24.3)
Cyclopropyl fatty acids 6.13 (±2.2) 19.7 (±1.2) 11.9 (±8.0)
Polyunsaturates 11.9 (±6.1) 2.72 (±3.8) 1.86 (±1.9)
Microbial diversity is distinct for each water mass
1.7 million 16S rRNA reads were retained after quality filtering. The average number of reads per samples was 83,948 with the number of reads ranging from 13,753 to 160,639 (S3 Table). The total number of OTUs present at a relative abundance of greater than 0.005% was 1,023. Diversity analysis using Shannon, Simpson, and Phylogenetic Diversity—whole tree metrics in-dicate that microbial diversity was lowest in the samples from the AW. The highest diversity was seen in samples from the LIW. Diversity then decreased in the EMDW (Fig. 3AandS3 Fig). Alpha diversity was significantly different between water masses for each of the metrics tested as determined by ANOVA and Tukey HSD test (Table 3).
Both hierarchical clustering and NMDS analysis indicated that samples from the same water mass clustered together (Fig. 3 B and C). There were significant differences in the microbial communities of each water masses as determined by PERMANOVA analysis (Bray Curtis—Ppermuted= 0.001, weighted Unifrac—Ppermuted= 0.001). Samples from AW clustered very closely together and were distant from samples derived from the deeper two water masses (Fig. 3B and 3C). PERMANOVA analysis indicates that the AW was significantly different
from the LIW and EMDW (AW v. LIW—Ppermutated= 0.006, AW v. EMDW—Ppermutated=
0.001). PERMANOVA analysis comparing the LIW and EMDW showed that even though the differences between the LIW and EMDW were less pronounced, they were significant (Ppermutated= 0.012). NMDS plots constructed using OTU tables separated by domain revealed that both the Bacterial and Archaeal communities clustered by water mass. PERMANOVA analysis of the separated microbial communities indicate that there were significant distinctions in the bacterial and archaeal communities between the three water masses (Archaea—Ppermutated= 0.002; Bacteria—Ppermutated= 0.001) (S4 Fig.).
Environmental variables were fit to the NMDS plot to examine which physical and geo-chemical factors affect community structure (Fig. 3C). Temperature, dissolved oxygen, salinity, silicate, nitrate, inorganic phosphate, NPOC, and total nitrogen all significantly fit the NMDS plot with p-values less than 0.05. The microbial community in the AW was strongly affected by NPOC and somewhat by temperature. Salinity partially dictates the distinction between the EMDW and LIW. Nutrient concentrations were the main factor structuring the community of the EMDW.
Distinct microbial taxa were found in each water mass (Fig. 4). ANOVA and Tukey HSD tests comparing the relative abundance of microbial classes across water masses revealed that 53 classes show significant differential abundance across the three water masses. Additionally, 37 indicator taxa were identified by indicator species analysis as good indicators of the water masses. The most abundant groups in the AW wereCyanobacteria,Proteobacteriaand Bacter-oidetes. TheCyanobacterialgroups in the AW were comprised of both relatives of Synechococ-cusandProchlorococcus.Synechococcuswere most abundant at the very top of the AW (10 m depth) andProcholorococcusdominated the remaining AW samples (50 to 60 m depth). The
Fig 3. Microbial community analysis.(A) Box and whisker plot of Shannon diversity of the microbial community in each water mass. Shape of symbols corresponds to the station from which the samples were taken. Color of symbols corresponds to the depth from which the sample was taken. (B) Hierarchical clustering analysis of Bray-Curtis distances. Color of symbols corresponds to the water mass from which the samples were taken (black corresponds to AW, blue corresponds to LIW, and orange corresponds to EMDW). Shape of symbols corresponds to the station from which the samples were taken. (C) NMDS plot of weighted Unifrac distances. Color of symbols corresponds to the water mass from which the samples were taken (black corresponds to AW, blue corresponds to LIW, and orange corresponds to EMDW). Shape of symbols corresponds to the station from which the samples were taken. Vectors displaying the fit of environmental variables to the data are shown. Only vectors with p values of less than 0.05 are shown.
doi:10.1371/journal.pone.0120605.g003
Table 3. P values for ANOVA and Tukey HSD test comparing alpha diversity metrics for the three water masses in the Eastern Mediterranean.
ANOVA Tukey HSD Test
Diversity Metric ANOVA p value ANOVA F Statistic EMDW-AW LIW-AW LIW-EMDW
Shannon 1.53E-06 32.59 0.00018 9.88E-07 0.00248
Simpson 1.55E-06 32.50 0.00187 9.83E-07 0.00023
PD Whole Tree 3.93E-14 312.55 3.39E-13 3.74E-13 0.01529
Thaumarchaeotawere the most abundant taxa in the intermediate and deep water mass (LIW and EMDW). Despite the differences in overall microbial community structure between the intermediate and deep-water masses (Ppermutated= 0.012), the most dominant taxa in the both water masses wereThaumarchaeota.Euryarchaeotawere also a large portion of the recov-ered reads from the two deeper water masses (8–14% of recovrecov-ered reads). TheseEuryarchaeota
are from the Marine Group II and Marine Group III families.
ANOVA with Tukey HSD test and Indicator Species analysis indicated that Deltaproteobac-teria,Planctomycetes,Chloroflexi,Thaumarchaeota, and Archaea from the classHalobacteria
were enriched in and good indicators of the LIW. The relative abundance of Deltaproteobac-teriawas significantly different between the three water masses (ANOVA corrected p-value 2.01E-08) and was higher in the LIW relative to the other two water masses. While, halophilic Archaea were a relatively low percentage of recovered reads in all samples, they are good indi-cators of the LIW (indicator value: 0.99, q-value: 0.019).
Gammaproteobacteriarelated toMethylococcalesandOceanospirillales, as well as SAR406 andNitrospiraeare indicators of the EMDW, based on indicator species analysis. Gammapro-teobacterialabundance was significantly different between the three water masses (ANOVA P = 1.43E-07).Gammaproteobacteriawere present at higher abundance in the EMDW relative Fig 4. Taxa summaries for samples.Taxa summaries showing the distribution of various classes in each sample. The top panel depicts the depth of each sample. The shape of the point corresponds to sampling station and the color corresponds to the water mass from which that sample was derived. The bottom panel depicts taxa summaries for each sample plotted in order of depth with the shallowest samples on the left of the plot and the deepest samples on the right. Points in the top panel correspond to the taxa bar below the point. The relative abundance of each class in each sample is plotted. The height of each bar represents the percentage that each taxa comprises in that community. The legend depicts only the most abundant classes in these samples. The bar representing the taxa summary for the sample collected directly above the North Alex Mud Volcano is indicated by an asterisk below the taxa summary.
to the AW and LIW. Members of theParvarchaeawere also good indicators of the EMDW (in-dicator value: 0.8 q-value: 0.019).
Analysis of the microbial community directly above the North Alex Mud
Volcano
The near-bottom sample from the North Alex Mud Volcano (Station 3) was quite distinct from other samples at similar depths. In particular the relative abundance ofFlavobacteria,
Methylococcales, andThiotrichaleswas higher in this sample relative to other samples from similar depths. (Fig. 4andS6 Fig.).Flavobacteriawere present at high relative abundances in the AW, but much lower abundances in the LIW and EMDW. In this mud volcano sample,
Flavobacteriacomprised 12% of recovered reads, which is almost ten times greater than any other deep-water sample.Thiotrichaleswere found at 4% of recovered reads in this samples compared to an average of 0.98% in the rest of the EMDW. Additionally relatives of Methylo-coccaleswere present at high abundance in this sample (22.7% of recovered reads). Methylococ-caleswere only found at similar abundances in samples taken from much deeper depths. Fig 5. Indicator species analysis.Indicator species of various water masses are shown. Indicator values (IndVal) are shown next to the taxonomic information for the indicator taxa as indicated by IndVal. Size of symbol is proportional to the mean relative abundance in that water mass. Black symbols indicate for which water mass the taxon is an indicator. Gray symbols indicate water masses that contain a taxon, but for which that taxon is not an indicator taxa.
Discussion
The goal of this study was to identify the effect of physical and geological phenomena on struc-turing the microbial community in the Eastern Mediterranean water column. Our geochemical analysis demonstrated that the waters of these sites in the Eastern Mediterranean are highly stratified by depth. Chemical and physical stratification at our sampling stations separated ac-cording to the three previously described water masses [16]. Our results indicated that higher organic carbon and higher temperatures are characteristics of the AW, the LIW has elevated sa-linity, and the EMDW has higher nutrient concentrations. Our results also confirm previous reports, which state that phosphate concentrations are low throughout the water column [15,
62]. The distinct physical and chemical properties of these water masses afford distinct niches in which different microbial communities can establish themselves.
Our results also demonstrated that microbial abundance differed by depth. The high cell numbers in the surface waters are in line with previous reports, which demonstrated a decrease in cell numbers with depth [25]. AODC cell counts were an order of magnitude higher than cell counts determined by PLFA analysis. This could be due to the fact that PLFA cell counts are derived from a conversion factor, which is often determined from cultured cells and is also based on bacterial cell size. Therefore, PLFA conversion factors do not always directly relate to cell counts [48]. Additionally, PLFA measurements do not take into account Archaeal lipids.
Thaumarchaeotaare often dominant microbes in deep marine waters [63–66]. Therefore, PLFA biomass estimates from water with high numbers of Archaea, may underestimate micro-bial cell numbers.
Analysis of PLFA biomarkers confirmed the presence of distinct microbial taxa in each water mass. We have demonstrated that the surface waters have a higher relative mole percent of polyunsaturated lipids. Polyunsaturated lipids are indicative ofCyanobacteria(18:2ω6) and
Eukaryotes (polyunsaturates with anω3 double bond) [67]. Our PLFA data suggests that active
phototrophic microbes were present at much higher abundance in the surface waters compared to the deeper water masses. Our PLFA results also indicate an increase in mid-branched satu-rated PLFA in the LIW and EMDW. Mid-branched saturates are biomarkers for metal and sul-fate reducing microbes [67], many of which are from theDeltaproteobacterialclass. The elevated levels of these PLFAs may indicate higher abundance of these microbial taxa in these deep-water masses.
More detailed distinctions in the microbial community structure were observed when ana-lyzing 16S rRNA sequencing data. We demonstrated that microbial diversity (Shannon, Simp-son, and phylogenetic diversity) was significantly different between these water masses, with the diversity being highest in the LIW. The lowest diversity was observed in the AW with an in-crease in diversity in the LIW and a subsequent dein-crease in the EMDW. Nutrient concentra-tions gradually increased across the LIW. This gradient may provide a variety of niches capable of supporting diverse communities of microbes in the same water mass. Our results are in line with previous reports that have shown that the diversity of deep-water microbial communities is higher than surface and subsurface waters [11,14].
Cyanobacteriawere most abundant in the AW, which has the highest light levels to support growth of phototrophic microbes. The majority ofCyanobacterialreads recovered from sam-ples from the AW were related toProchlorococcusspecies, which are well adapted for growth in nutrient poor surface waters. The stoichiometry required to support growth ofProchlorococcus
is shifted from the Redfield ratio enabling growth in phosphorus-limited ecosystems such as the Eastern Mediterranean [68,69]. In addition toProchlorococcus,Alphaproteobacteriaare significantly enriched in the AW. TheseAlphaproteobacteriaare related toRhodosprillales,
Rhodobacteriales,and Rickettsiales, which are related to SAR-11—a ubiquitous bacterium in marine surface waters [70]. BothProchlorococcusspecies and members of the Alphaproteobac-teriaare well adapted for growth in oligotrophic environments [71]. The nutrient concentra-tions in the AW are much lower than in other water masses and in many cases below
detection. These low nutrient concentrations may select for these microbes, which are capable of thriving under nutrient limitation. Members of theFlavobacteriawere also found at signifi-cantly higher levels in the AW relative to the deeper two water masses. Members of the Flavo-bacteriahave been shown to be involved in degradation of high molecular weight organic matter [72] and could be involved in degrading the organic matter that is produced by photo-trophicCyanobacteriaand algae in the AW.
Thaumarchaeotarelated to cosmopolitan ammonia oxidizing Archaea [63–66] were domi-nant members of the deep-water community representing between 18–40% of the recovered reads for samples from the LIW and EMDW. The fact thatThaumarchaeotadominated sam-ples from the LIW and EMDW indicates that they perform an essential function in the inter-mediate and deep-water environments of the Eastern Mediterranean and may be important players in the nitrogen cycle of the Mediterranean deep-water. Elevated levels of Deltaproteo-bacteriawere also a defining factor of the LIW. Many of theseDeltaproteobacteriaare closely related to SAR324, which are physiologically diverse group [73]. Some microbes in the SAR324 group have the ability to grow autotrophically and heterotrophically participating in carbon, sulfur and nitrogen cycling [73,74]. Their presence at elevated levels in the LIW may indicate that some of these processes are occurring in this intermediate water mass.
Some of the important taxa in the LIW are putatively involved in nitrogen cycling. For ex-ample,Nitrospinaceae,PlanctomycetesandChloroflexifrom the SAR202 class are all important member of the microbial community in the LIW.Nitrospinaceaerelated to the autotrophic ni-trite oxidizing bacterium,Nitrospina, are good indicators of the LIW (indicator value 0.82 q-value 0.019). Members of thePlanctomycetesare quite diverse in their ecology and functional capacity, with somePlanctomycetesable to perform anaerobic ammonia oxidation (annamox), which is an essential process in the nitrogen cycle of many marine environments [75],[76].
Chloroflexifrom the SAR202 class were also found at high abundances in the LIW (10–15% of recovered reads). It has been proposed that Members of the SAR202 class are involved in amino acid mineralization [77]. These findings indicate that some of the microbes in the LIW are putatively involved in autotrophic and heterotrophic processes related to nitrogen cycling. The importance of nitrogen cycling in the Mediterranean deep-water was suggested by a recent study which showed that nitrogen fixation in the aphotic zone of the Eastern Mediterranean was quite high [24]. Our finding that the predominant taxa in the LIW were related to mi-crobes involved in nitrogen cycling processes suggests that the LIW is an essential part of the nitrogen cycle of the Mediterranean Sea.
We also found organisms that were indicative of the different water masses. Our results demonstrate that the LIW has the highest salinity of the three water masses in the Eastern Mediterranean. Correspondingly, we found halophilic Archaea from the classHalobacteria
lower salinity samples from the AW and EMDW. The ability ofHalobacteriato thrive under high salt conditions [78] may allow them to colonize the higher salinity LIW.
Parvarchaeotawere indicators of the EMDW. TheParvarchaeotaare a poorly understood group in a newly described super phyla unified by their small cell size and small genome size [79,80]. Their role in the EMDW microbial community is still unclear, and requires further in-vestigation.Gammaproteobacteriafrom theOceanospirillalesandMethylococcalesorders were present at high abundance in the EMDW microbial community. The most abundant Oceanos-pirillalesin the EMDW were most closely related to the SUP05 andHalomonadaceaefamilies. Relatives of SUP05 have been found as a part of sulfur oxidizing assemblages in different envi-ronments [81,82]. There is metagenomic and physiological evidence that the SUP05 group is involved in autotrophic growth involving sulfur and hydrogen oxidation. Microbes related to SUP05 were indicators of the EMDW (indicator value of 0.99, q-value of 0.019) suggesting that sulfur and hydrogen oxidation may be occurring in the EMDW.
Additionally, Sequences corresponding toMethylococcalescomprised between 5–20% of the recovered reads in samples from the EMDW and were indicator species for the EMDW (Indi-cator value 0.99, q-value 0.019).Methylococcalesare methanotrophs and typically acquire their carbon and energy from methane oxidation. The dominance of sequences related to known methanotrophs suggests that methane oxidation may be another important physiology in the deep waters of the Eastern Mediterranean. Many of the microbes in the deeper water masses are putatively involved in autotrophic physiologies. Therefore, it is possible that the oligotro-phy of the Eastern Mediterranean has selected for a set of autotrophic microbes that use the available nutrients in energy generating processes.
Another goal of this study was to characterize the effect of geological phenomena such as mud volcanism on the microbial community of the water column. Our results demonstrate that the microbial community directly above the North Alex Mud Volcano was distinct from the microbial community in other samples from similar depths. However, the microbial com-munity in the upper water column (i.e. AW and LIW) above the North Alex Mud Volcano re-sembled the microbial community from samples collected within the same water masses in other sampling locations. Members of theFlavobacteriales,ThiotrichalesandMethylococcales
were present at higher abundances in this mud volcano sample as compared to samples from similar depths from other stations.Flavobacteriahave been implicated in degradation of high molecular weight organic matter [72]. It may be that the mud volcano has enriched for mi-crobes capable of utilizing the emitted organic material from the mud volcano. The Thiotri-chalessequences in this sample are most similar to members of familyPiscirickettsiaceae. PAH-degradingCycloclasticusand halophilic methylotrophicMethylophagaspecies are mem-bers of thePiscirickettsiaceae.Methylococcalesare present at much higher levels in this sample than in samples from similar depths. The elevated abundance ofThiotrichalesand Methylococ-calesin this samples could be indicative of active release of methane and other hydrocarbon compounds into the water column above the North Alex Mud Volcano.
The increased abundance of known hydrocarbon degraders as well as a distinct community structure directly above the mud volcano suggests that mud volcanism affects the microbial community in the overlaying waters. Further genomic work is required to better understand the role of these andFlavobacteriaand other putative hydrocarbon degrading microbes in the deep-water community, especially in the water column adjacent to natural seeps.
Conclusion
Eastern Mediterranean water column. The adjacent water masses of the Mediterranean have selected for distinct microbial communities able to colonize these separate water masses. Our results contribute to the growing body of work, which demonstrates that physical factors in ad-dition to geochemical parameters influence microbial community structure. Our results also clarify importance of the deep-water microbial communities of the Eastern Mediterranean in nitrogen cycling. In particular, the microbial community in the LIW contains a number of mi-crobes putatively involved in nitrogen cycling and may be essential to the nitrogen cycle of the Eastern Mediterranean.
Our study also demonstrated that geological phenomena such as mud volcanism drastically affect the microbial communities present in the water column by enriching for microbes known to utilize hydrocarbons and high molecular weight organic matter. These data combine to underscore the important role that physical, geological, and geochemical factors play in shaping marine microbial communities.
Supporting Information
S1 Fig. Temperature and Salinity plots.Temperature and salinity profiles for stations two three, four, and five. Temperature is shown in red and salinity is shown in green. (A) Station 2, (B) Station 3, (C) Station 4, (D) Station 5.
(TIF)
S2 Fig. Nutrients and NPOC by depth.(A) Total Nitrogen (B) Nitrate (C) Inorganic Phos-phate (D) Ammonia (E) NPOC (F) Silicate (G) Sulfate (H) Iron. Shapes represent different sampling stations. Colors represent water masses.
(TIF)
S3 Fig. Alpha diversity.(A) Shannon diversity plotted as a function of depth. Symbols repre-sent sampling location and colors reprerepre-sent water masses. (B) Shannon diversity for each water mass. Symbols represent sampling locations. Colors correspond to depth. (C) PD Whole Tree diversity plotted as a function of depth. Symbols represent sampling location and colors repre-sent water masses. (D) PD Whole Tree diversity for each water mass. Symbols reprerepre-sent sam-pling locations. Colors correspond to depth. (E) Simpson diversity plotted as a function of depth. Symbols represent sampling location and colors represent water masses. (F) Simpson diversity for each water mass. Symbols represent sampling locations. Colors correspond to depth.
(TIF)
S4 Fig. Beta Diversity by Depth.(A) Hierarchichal Clustering Analysis. Symbols represent sampling station and colors correspond to depth. (B)Non-metric multidimensional scaling analysis of weighted unifrac distances. Geochemical variable were fit to the weighted unifrac distance matric. Vectors are shown for environmental variables that fit the data with a p value of greater than 0.01. Shapes represent sampling station. Colors correspond to depth.
(TIF)
S6 Fig. Microbial Classes Enriched in the Sample Directly Above the North Alex Mud Vol-cano.Three microbial classes were highly enriched in the water sample directly above the North Alex Mud Volcano. (A) Relative abundance ofFlavobacterialesplotted as a function of depth. Symbols represent sampling location. Colors represent water mass. (B) Relative abun-dance ofMethylococcalesplotted as a function of depth. Symbols represent sampling location. Colors represent water mass. (C) Relative abundance ofThiotrichalesplotted as a function of depth. Symbols represent sampling location. Colors represent water mass.
(TIF)
S1 Table. Geochemical data for each sample: Physical, chemical and nutrient data for each of the 20 samples collected.
(DOCX)
S2 Table. PLFA Data.Mole percent for each lipid detected in each samples. Groups of samples are shown according to the water mass from which they were obtained. In the sample names, the first number corresponds to the sampling station and the second number is the unique identifier for that sample. The average of each lipid in each water mass is shown as well as the minimum and maximum mole percent values for each lipid in each water mass.
(DOCX)
S3 Table. Number of sequences per sample: Number of 16S rRNA sequences for each sam-ple after quality filtering and chimera checking.The sample station, depth and water mass for each sample are also shown for each sample.
(DOCX)
S4 Table. Microbial classes significantly different between the three water masses.Two-way ANOVA and Tukey tests were used to compare the relative abundance of microbial classes in order to determine which classes were significantly different between the three water masses. ANOVA F statistic and p value are shown for each taxa. p values were corrected using the false discovery rate calculation in R. Tukey test was used to determine which water masses were sig-nificantly different from each other for that class. The mean relative abundance of each class is also reported for each water mass.
(DOCX)
S5 Table. Indicator species values for all indicator taxa: Indicator taxa with their indicator species values and their corrected Pvalues as well as the water mass for which they are indi-cators.
(DOCX)
Acknowledgments
We would like to thank the two anonymous reviewers for their comments. We would like to thank Andrew Griffith, Andrew Matheson and the Captain and crew of the MV Fugro Naviga-tor for assistance in collection of samples. We would also like to thank Oceanlab in Aberdeen, UK for use of the SAPS pump. We would also like to acknowledge Arden Ahnell, Maarten Kuijper, Sam Walker and Anne Walls for enabling this work.
Author Contributions
References
1. Brockett BFT, Prescott CE, Grayston SJ. Soil moisture is the major factor influencing microbial commu-nity structure and enzyme activities across seven biogeoclimatic zones in western Canada. Soil Biol Biochem. 2012; 44(1):9–20.
2. Dang HY, Chen RP, Wang L, Guo LZ, Chen PP, Tang ZW, et al. Environmental Factors Shape Sedi-ment Anammox Bacterial Communities in Hypernutrified Jiaozhou Bay, China. Applied and Environ-mental Microbiology. 2010; 76(21):7036–47. doi:10.1128/AEM.01264-10PMID:20833786
3. Steenbergh AK, Bodelier PLE, Slomp CP, Laanbroek HJ. Effect of Redox Conditions on Bacterial Com-munity Structure in Baltic Sea Sediments with Contrasting Phosphorus Fluxes (vol 9, e92401, 2014). Plos One. 2014; 9(7).
4. Fagervold SK, Bourgeois S, Pruski AM, Charles F, Kerherve P, Vetion G, et al. River organic matter shapes microbial communities in the sediment of the Rhone prodelta. Isme J. 2014; 8(11):2327–38. doi:10.1038/ismej.2014.86PMID:24858780
5. Adams HE, Crump BC, Kling GW. Temperature controls on aquatic bacterial production and communi-ty dynamics in arctic lakes and streams. Environ Microbiol. 2010; 12(5):1319–33. doi: 10.1111/j.1462-2920.2010.02176.xPMID:20192972
6. Moore CM, Mills MM, Arrigo KR, Berman-Frank I, Bopp L, Boyd PW, et al. Processes and patterns of oceanic nutrient limitation. Nat Geosci. 2013; 6(9):701–10.
7. Urakawa H, Martens-Habbena W, Huguet C, de la Torre JR, Ingalls AE, Devol AH, et al. Ammonia availability shapes the seasonal distribution and activity of archaeal and bacterial ammonia oxidizers in the Puget Sound Estuary. Limnol Oceanogr. 2014; 59(4):1321–35.
8. Wilkins D, van Sebille E, Rintoul SR, Lauro FM, Cavicchioli R. Advection shapes Southern Ocean mi-crobial assemblages independent of distance and environment effects. Nature communications. 2013; 4:2457. doi:10.1038/ncomms3457PMID:24036630
9. Hamdan LJ, Coffin RB, Sikaroodi M, Greinert J, Treude T, Gillevet PM. Ocean currents shape the microbiome of Arctic marine sediments. Isme J. 2013; 7(4):685–96. doi:10.1038/ismej.2012.143 PMID:23190727
10. Bouman HA, Ulloa O, Barlow R, Li WK, Platt T, Zwirglmaier K, et al. Water-column stratification governs the community structure of subtropical marine picophytoplankton. Environ Microbiol Rep. 2011; 3 (4):473–82. doi:10.1111/j.1758-2229.2011.00241.xPMID:23761310
11. Agogue H, Lamy D, Neal PR, Sogin ML, Herndl GJ. Water mass-specificity of bacterial communities in the North Atlantic revealed by massively parallel sequencing. Mol Ecol. 2011; 20(2):258–74. doi:10. 1111/j.1365-294X.2010.04932.xPMID:21143328
12. DeLong EF, Preston CM, Mincer T, Rich V, Hallam SJ, Frigaard NU, et al. Community genomics among stratified microbial assemblages in the ocean's interior. Science. 2006; 311(5760):496–503. PMID:16439655
13. Seymour JR, Doblin MA, Jeffries TC, Brown MV, Newton K, Ralph PJ, et al. Contrasting microbial as-semblages in adjacent water masses associated with the East Australian Current. Env Microbiol Rep. 2012; 4(5):548–55.
14. Alves Junior N, Meirelles P, de Oliveira Santos E, Dutilh B, Silva GZ, Paranhos R, et al. Microbial com-munity diversity and physical–chemical features of the Southwestern Atlantic Ocean. Archives of micro-biology. 2014; 10:1–15.
15. Krom MD, Emeis KC, Van Cappellen P. Why is the Eastern Mediterranean phosphorus limited? Prog Oceanogr. 2010; 85(3–4):236–44.
16. Skliris N. Past, Present and Future Patterns of the Thermohaline Circulation and Characteristic Water Masses of the Mediterranean Sea. In: Goffredo S, Dubinsky Z, editors. The Mediterranean Sea. Springer Netherlands; 2014. p. 29–48.
17. Mella-Flores D, Mazard S, Humily F, Partensky F, Mahe F, Bariat L, et al. Is the distribution of Prochlor-ococcus and SynechProchlor-ococcus ecotypes in the Mediterranean Sea affected by global warming? Bio-geosciences. 2011; 8(9):2785–804.
18. Lamy D, Jeanthon C, Cottrell MT, Kirchman DL, Van Wambeke F, Ras J, et al. Ecology of aerobic anoxygenic phototrophic bacteria along an oligotrophic gradient in the Mediterranean Sea. Biogeos-ciences. 2011; 8(4):973–85.
19. Feingersch R, Suzuki MT, Shmoish M, Sharon I, Sabehi G, Partensky F, et al. Microbial community ge-nomics in eastern Mediterranean Sea surface waters. Isme J. 2010; 4(1):78–87. doi:10.1038/ismej. 2009.92PMID:19693100
21. Bethoux JP, Copinmontegut G. Biological Fixation of Atmospheric Nitrogen in the Mediterranean-Sea. Limnol Oceanogr. 1986; 31(6):1353–8.
22. Ibello V, Cantoni C, Cozzi S, Civitarese G. First basin-wide experimental results on N-2 fixation in the open Mediterranean Sea. Geophys Res Lett. 2010; 37.
23. Yogev T, Rahav E, Bar-Zeev E, Man-Aharonovich D, Stambler N, Kress N, et al. Is dinitrogen fixation significant in the Levantine Basin, East Mediterranean Sea? Environ Microbiol. 2011; 13(4):854–71. doi:10.1111/j.1462-2920.2010.02402.xPMID:21244595
24. Rahav E, Bar-Zeev E, Ohayon S, Elifantz H, Belkin N, Herut B, et al. Dinitrogen fixation in aphotic oxy-genated marine environments. Front Microbiol. 2013; 4.
25. Yokokawa T, De Corte D, Sintes E, Herndl GJ. Spatial patterns of bacterial abundance, activity and community composition in relation to water masses in the eastern Mediterranean Sea. Aquat Microb Ecol. 2010; 59(2):185–95.
26. Felden J, Lichtschlag A, Wenzhofer F, de Beer D, Feseker T, Ristova PP, et al. Limitations of microbial hydrocarbon degradation at the Amon mud volcano (Nile deep-sea fan). Biogeosciences. 2013; 10 (5):3269–83.
27. Heijs SK, Laverman AM, Forney LJ, Hardoim PR, van Elsas JD. Comparison of deep-sea sediment mi-crobial communities in the Eastern Mediterranean. Fems Microbiol Ecol. 2008; 64(3):362–77. doi:10. 1111/j.1574-6941.2008.00463.xPMID:18422633
28. Mastalerz V, de Lange GJ, Dahlmann A. Differential aerobic and anaerobic oxidation of hydrocarbon gases discharged at mud volcanoes in the Nile deep-sea fan. Geochim Cosmochim Ac. 2009; 73 (13):3849–63.
29. Omoregie EO, Niemann H, Mastalerz V, de Lange GJ, Stadnitskaia A, Mascle J, et al. Microbial meth-ane oxidation and sulfate reduction at cold seeps of the deep Eastern Mediterrmeth-anean Sea. Mar Geol. 2009; 261(1–4):114–27.
30. Loncke L, Gaullier V, Mascle J, Vendeville B, Camera L. The Nile deep-sea fan: An example of interact-ing sedimentation, salt tectonics, and inherited subsalt paleotopographic features. Mar Petrol Geol. 2006; 23(3):297–315.
31. Dupre S, Woodside J, Klaucke I, Mascle J, Foucher JP. Widespread active seepage activity on the Nile Deep Sea Fan (offshore Egypt) revealed by high-definition geophysical imagery. Mar Geol. 2010; 275 (1–4):1–19.
32. Loncke L, Mascle J, Parties FS. Mud volcanoes, gas chimneys, pockmarks and mounds in the Nile deep-sea fan (Eastern Mediterranean): geophysical evidences. Mar Petrol Geol. 2004 21(6):669–89.
33. Ritt B, Pierre C, Gauthier O, Wenzhofer F, Boetius A, Sarrazin J. Diversity and distribution of cold-seep fauna associated with different geological and environmental settings at mud volcanoes and pock-marks of the Nile Deep-Sea Fan. Mar Biol. 2011; 158(6):1187–210.
34. Mills CT, Dias RF, Graham D, Mandernack KW. Determination of phospholipid fatty acid structures and stable carbon isotope compositions of deep-sea sediments of the Northwest Pacific, ODP site 1179. Mar Chem. 2006; 98(2):197–209.
35. White DC, Pinkart HC, Ringelberg DB. Biomass measurements: Biochemical approaches. In: Hurst CH, Knudsen G, McInerney M, Stetzenach LD, Walter M, editors. Manual of Environmental Microbiolo-gy. Washington, DC: American Society for Microbiology Press; 1996. p. 91–101.
36. Hazen TC, Rocha AM, Techtmann SM. Advances in monitoring environmental microbes. Curr Opin Biotech. 2013; 24(3):526–33. doi:10.1016/j.copbio.2012.10.020PMID:23183250
37. Kelley D. oce: Analysis of Oceanographic data. R package version 09–12 Available: http://cran.r-project.org/web/packages/oce/. Accessed 11 February 2015.
38. Schlitzer R. Ocean Data View. Available:http://odv.awi.de/. 2014. Accessed 11 February 2015.
39. R Core Team. R: A Language and Environment for Statistical Computing. R Foundation for Statistical Computing Vienna, Austria. Available:http://www.r-project.org/. Accessed 11 February 2015.
40. Kerouel R, Aminot A. Fluorometric determination of ammonia in sea and estuarine waters by direct seg-mented flow analysis. Mar Chem. 1997; 57(3–4):265–75.
41. Armstron FAJ, Stearns CR, Strickland JDH. Measurement of Upwelling and Subsequent Biological Processes by Means of Technicon Autoanalyzer and Associated Equipment. Deep-Sea Res. 1967; 14 (3):381–389.
42. Grasshoff K, Ehrhardt M, Kremling K. Methods of Seawater Analysis1983. Basel: Verlag Chimie; 1983.
44. Anderson MJ. A new method for non-parametric multivariate analysis of variance. Austral Ecol. 2001; 26(1):32–46.
45. Oksanen J, Blanchet FG, Kindt R, Legendre P, Minchin PR, O'Hara RB, et al. vegan: Community Ecolo-gy Package. R package version 20–10. Available:http://cran.r-project.org/web/packages/vegan/. Ac-cessed 11 February 2015.
46. Francisco DE, Mah RA, Rabin AC. Acridine Orange-Epifluorescence Technique for Counting Bacteria in Natural Waters. T Am Microsc Soc. 1973; 92(3):416–21. PMID:4581469
47. White DC, Ringelberg DB. Signature lipid biomarker analysis. In: Burlage RS, Atlas R, Stahl DA, Gee-sey G, Sayler GS, editors. Techniques in microbial ecology. New York: Oxford University Press; 1998.
48. Green CT, Scow KM. Analysis of phospholipid fatty acids (PLFA) to characterize microbial communities in aquifers. Hydrogeol J. 2000; 8(1):126–41.
49. Hazen TC, Dubinsky EA, DeSantis TZ, Andersen GL, Piceno YM, Singh N, et al. Deep-Sea Oil Plume Enriches Indigenous Oil-Degrading Bacteria. Science. 2010; 330(6001):204–8. doi:10.1126/science. 1195979PMID:20736401
50. Caporaso JG, Lauber CL, Walters WA, Berg-Lyons D, Huntley J, Fierer N, et al. Ultra-high-throughput microbial community analysis on the Illumina HiSeq and MiSeq platforms. Isme J. 2012; 6(8):1621–4. doi:10.1038/ismej.2012.8PMID:22402401
51. Caporaso JG, Kuczynski J, Stombaugh J, Bittinger K, Bushman FD, Costello EK, et al. QIIME allows analysis of high-throughput community sequencing data. Nat Methods. 2010; 7(5):335–6. doi:10.1038/ nmeth.f.303PMID:20383131
52. Aronesty E. ea-utils: "Command-line tools for processing biological sequencing data". Available: https://code.google.com/p/ea-utils/. Accessed 11 February 2015.
53. Edgar RC. Search and clustering orders of magnitude faster than BLAST. Bioinformatics. 2010; 26 (19):2460–1. doi:10.1093/bioinformatics/btq461PMID:20709691
54. Edgar RC, Haas BJ, Clemente JC, Quince C, Knight R. UCHIME improves sensitivity and speed of chi-mera detection. Bioinformatics. 2011; 27(16):2194–200. doi:10.1093/bioinformatics/btr381PMID: 21700674
55. Caporaso JG, Bittinger K, Bushman FD, DeSantis TZ, Andersen GL, Knight R. PyNAST: a flexible tool for aligning sequences to a template alignment. Bioinformatics. 2010; 26(2):266–7. doi:10.1093/ bioinformatics/btp636PMID:19914921
56. Wang Q, Garrity GM, Tiedje JM, Cole JR. Naive Bayesian classifier for rapid assignment of rRNA se-quences into the new bacterial taxonomy. Applied and Environmental Microbiology. 2007; 73 (16):5261–7. PMID:17586664
57. Bray JR, Curtis JT. An Ordination of the Upland Forest Communities of Southern Wisconsin. Ecol Monogr. 1957; 27(4):326–49.
58. Lozupone C, Knight R. UniFrac: a new phylogenetic method for comparing microbial communities. Ap-plied and Environmental Microbiology. 2005; 71(12):8228–35. PMID:16332807
59. Goslee SC, Urban DL. The ecodist package for dissimilarity-based analysis of ecological data. J Stat Softw. 2007; 22(7):1–19.
60. Roberts DW. labdsv: Ordination and Multivariate Analysis for Ecology. R package version 16-1. Avail-able:http://cran.r-project.org/web/packages/labdsv. Accessed 11 February 2015.
61. Dufrene M, Legendre P. Species assemblages and indicator species: The need for a flexible asymmet-rical approach. Ecol Monogr. 1997; 67(3):345–66.
62. Thingstad TF, Krom MD, Mantoura RFC, Flaten GAF, Groom S, Herut B, et al. Nature of Phosphorus Limitation in the Ultraoligotrophic Eastern Mediterranean. Science. 2005; 309(5737):1068–71. PMID: 16099984
63. Konneke M, Bernhard AE, de la Torre JR, Walker CB, Waterbury JB, Stahl DA. Isolation of an autotro-phic ammonia-oxidizing marine archaeon. Nature. 2005; 437(7058):543–6. PMID:16177789
64. Walker CB, de la Torre JR, Klotz MG, Urakawa H, Pinel N, Arp DJ, et al. Nitrosopumilus maritimus ge-nome reveals unique mechanisms for nitrification and autotrophy in globally distributed marine cre-narchaea. P Natl Acad Sci USA. 2010; 107(19):8818–23. doi:10.1073/pnas.0913533107PMID: 20421470
65. Fuhrman JA, Mccallum K, Davis AA. Novel Major Archaebacterial Group from Marine Plankton. Nature. 1992; 356(6365):148–9. PMID:1545865
66. Delong EF. Archaea in Coastal Marine Environments. P Natl Acad Sci USA. 1992 Jun 15; 89 (12):5685–9. PMID:1608980
68. Krumhardt KM, Callnan K, Roache-Johnson K, Swett T, Robinson D, Reistetter EN, et al. Effects of phosphorus starvation versus limitation on the marine cyanobacterium Prochlorococcus MED4 I: up-take physiology. Environ Microbiol. 2013; 15(7):2114–28. doi:10.1111/1462-2920.12079PMID: 23387819
69. Reistetter EN, Krumhardt K, Callnan K, Roache-Johnson K, Saunders JK, Moore LR, et al. Effects of phosphorus starvation versus limitation on the marine cyanobacterium Prochlorococcus MED4 II: gene expression. Environ Microbiol. 2013; 15(7):2129–43. doi:10.1111/1462-2920.12129PMID:23647921
70. Morris RM, Rappe MS, Connon SA, Vergin KL, Siebold WA, Carlson CA, et al. SAR11 clade dominates ocean surface bacterioplankton communities. Nature. 2002; 420(6917):806–10. PMID:12490947
71. Sowell SM, Wilhelm LJ, Norbeck AD, Lipton MS, Nicora CD, Barofsky DF, et al. Transport functions dominate the SAR11 metaproteome at low-nutrient extremes in the Sargasso Sea. Isme J. 2009; 3 (1):93–105. doi:10.1038/ismej.2008.83PMID:18769456
72. Fernandez-Gomez B, Richter M, Schuler M, Pinhassi J, Acinas SG, Gonzalez JM, et al. Ecology of ma-rine Bacteroidetes: a comparative genomics approach. Isme J. 2013; 7(5):1026–37. doi:10.1038/ ismej.2012.169PMID:23303374
73. Sheik CS, Jain S, Dick GJ. Metabolic flexibility of enigmatic SAR324 revealed through metagenomics and metatranscriptomics. Environ Microbiol. 2014; 16(1):304–17. doi:10.1111/1462-2920.12165 PMID:23809230
74. Swan BK, Martinez-Garcia M, Preston CM, Sczyrba A, Woyke T, Lamy D, et al. Potential for Chemo-lithoautotrophy Among Ubiquitous Bacteria Lineages in the Dark Ocean. Science. 2011; 333 (6047):1296–300. doi:10.1126/science.1203690PMID:21885783
75. Fuerst JA, Sagulenko E. Beyond the bacterium: planctomycetes challenge our concepts of microbial structure and function. Nat Rev Microbiol. 2011; 9(6):403–13. doi:10.1038/nrmicro2578PMID: 21572457
76. Dalsgaard T, Thamdrup B, Canfield DE. Anaerobic ammonium oxidation (anammox) in the marine en-vironment. Res Microbiol. 2005; 156(4):457–64. PMID:15862442
77. Varela MM, van Aken HM, Herndl GJ. Abundance and activity of Chloroflexi-type SAR202 bacterio-plankton in the meso- and bathypelagic waters of the (sub)tropical Atlantic. Environ Microbiol. 2008; 10 (7):1903–11. doi:10.1111/j.1462-2920.2008.01627.xPMID:18422640
78. Oren A. Microbial life at high salt concentrations: phylogenetic and metabolic diversity. Saline systems. 2008; 4:2. doi:10.1186/1746-1448-4-2PMID:18412960
79. Rinke C, Schwientek P, Sczyrba A, Ivanova NN, Anderson IJ, Cheng JF, et al. Insights into the phyloge-ny and coding potential of microbial dark matter. Nature. 2013; 499(7459):431–7. doi:10.1038/ nature12352PMID:23851394
80. Baker BJ, Comolli LR, Dick GJ, Hauser LJ, Hyatt D, Dill BD, et al. Enigmatic, ultrasmall, uncultivated Ar-chaea. P Natl Acad Sci USA. 2010; 107(19):8806–11. doi:10.1073/pnas.0914470107PMID:
20421484
81. Anantharaman K, Breier JA, Sheik CS, Dick GJ. Evidence for hydrogen oxidation and metabolic plastic-ity in widespread deep-sea sulfur-oxidizing bacteria. P Natl Acad Sci USA. 2013; 110(1):330–5. doi:10. 1073/pnas.1215340110PMID:23263870