BGD
9, 17583–17618, 2012
Physical and biogeochemical forcing of oxygen
changes
P. J. Llanillo et al.
Title Page
Abstract Introduction
Conclusions References
Tables Figures
◭ ◮
◭ ◮
Back Close
Full Screen / Esc
Printer-friendly Version Interactive Discussion
Discussion
P
a
per
|
Dis
cussion
P
a
per
|
Discussion
P
a
per
|
Discussio
n
P
a
per
|
Biogeosciences Discuss., 9, 17583–17618, 2012 www.biogeosciences-discuss.net/9/17583/2012/ doi:10.5194/bgd-9-17583-2012
© Author(s) 2012. CC Attribution 3.0 License.
Biogeosciences Discussions
This discussion paper is/has been under review for the journal Biogeosciences (BG). Please refer to the corresponding final paper in BG if available.
Physical and biogeochemical forcing of
oxygen changes in the tropical eastern
South Pacific along 86
◦
W: 1993 versus
2009
P. J. Llanillo1, J. Karstensen2, J. L. Pelegr´ı1, and L. Stramma2
1
LINCGlobal, Institut de Ci `encies del Mar, CSIC, Passeig Maritim de la Barceloneta 37–49, 08003 Barcelona, Spain
2
GEOMAR Helmholtz Centre for Ocean Research Kiel, D ¨usternbrooker Weg 20, 20105 Kiel, Germany
Received: 30 September 2012 – Accepted: 8 October 2012 – Published: 11 December 2012
Correspondence to: P. J. Llanillo ([email protected])
BGD
9, 17583–17618, 2012
Physical and biogeochemical forcing of oxygen
changes
P. J. Llanillo et al.
Title Page
Abstract Introduction
Conclusions References
Tables Figures
◭ ◮
◭ ◮
Back Close
Full Screen / Esc
Printer-friendly Version Interactive Discussion
Discussion
P
a
per
|
Dis
cussion
P
a
per
|
Discussion
P
a
per
|
Discussio
n
P
a
per
|
Abstract
Temporal changes of the water mass distribution and biogeochemical cycling in the tropical eastern South Pacific are investigated based on the extended Optimum Multi-Parameter (OMP) method. Two ship occupations of a meridional section along 85◦50′W, from 14◦S to 1◦N, are analysed, one during a relatively warm (El Ni ˜no/El Viejo, March
5
1993) and the other during a cold (La Ni ˜na/La Vieja, February 2009) upper-ocean phase. The largest El Ni ˜no – Southern Oscillation (ENSO) impact was found in the water properties and water mass distribution in the upper 250 m. The most prominent change is the vertical motion of the Oxygen Minimum Zone (OMZ) associated to the hypoxic Equatorial Subsurface Water (ESSW). During a cold phase the core of the
10
ESSW is found at shallower layers, replacing the shallow (top 250 m) Subtropical Sur-face Water (STW) and allowing an intrusion of oxygen-rich and nutrient-poor Antarctic Intermediate Water (AAIW) in the depth range of 300 to 600 m. The shift in the vertical location of the intrusion of AAIW in the OMZ induces changes in oxygen advection and respiration, the largest the oxygen supply the greatest the respiration and the lowest
15
the nitrate loss by denitrification. Changes in the intensity of the zonal currents in the Equatorial Current System, that ventilate the OMZ from the west, are used to explain the patchy latitudinal changes of seawater properties observed along the repeated section. Given that changes down to 800 m depth are observed, not only interannual (ENSO) but also decadal variability (Pacific Decadal Oscillation) is a potential driver for
20
the observed changes.
1 Introduction
Oxygen minimum zones (OMZs) exist with different intensity in the upper thermocline of the eastern subtropical gyres of the Pacific and Atlantic Oceans as well as in the northern Indian Ocean (Karstensen et al., 2008; Paulmier and Ruiz-Pino, 2009). When
25
BGD
9, 17583–17618, 2012
Physical and biogeochemical forcing of oxygen
changes
P. J. Llanillo et al.
Title Page
Abstract Introduction
Conclusions References
Tables Figures
◭ ◮
◭ ◮
Back Close
Full Screen / Esc
Printer-friendly Version Interactive Discussion
Discussion
P
a
per
|
Dis
cussion
P
a
per
|
Discussion
P
a
per
|
Discussio
n
P
a
per
|
of affected areas will result (Vaquer-Sunyer and Duarte, 2008). Expansion of the OMZs would narrow down the habitable depth range of fishes and, along with overfishing, may threaten the sustainability of pelagic fisheries and marine ecosystems (e.g. Stramma et al., 2012). In contrast, because of the upwelling of nutrient rich waters in the eastern boundary regions, the waters overlying the eastern South Pacific OMZ belong to the
5
most productive areas in the world ocean (Strub et al., 1998).
Changes in transport and/or biology may drive variability in OMZs characteristics (e.g. extent, oxygen concentration). Decreasing oxygen concentrations and an OMZ expan-sion have been found for all tropical oceans (Stramma et al., 2008, 2010b) perhaps as part of a long term decadal type variability (Deutsch et al., 2011). However, increasing
10
oxygen content has been reported to occur south of 15◦S in the Pacific (Stramma et al., 2010b).
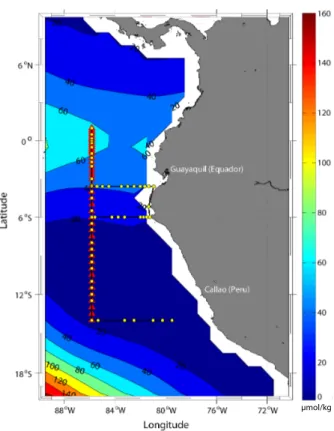
In this paper we will use two occupations of a section along 85◦50′W, carried out in 1993 and 2009, to examine the temporal evolution of the OMZ in the tropical eastern South Pacific Ocean. The area of investigation goes from the northeastern rim of the
15
South Pacific subtropical gyre to the southern part of the Panama Basin (from 14◦S to 1◦N) (Fig. 1). It is poorly ventilated by the eastern part of the Equatorial Current System and by the northern part of the Peru-Chile Current system, with relatively long residence times (Kessler, 2006). This region is influenced by El Ni ˜no/La Ni ˜na – South-ern Oscillation (ENSO), one of the strongest modes of interannual variability in the
20
global ocean/atmosphere system (e.g. Philander, 1983). El Ni ˜no and La Ni ˜na respec-tively refer to the warm and cold ocean phases of the near-surface waters in the central and eastern Pacific Ocean. During an El Ni ˜no event the upwelling of nutrient-rich wa-ters off the Peruvian coast is suppressed with dramatic consequences for fisheries (Barber and Chavez, 1983).
25
BGD
9, 17583–17618, 2012
Physical and biogeochemical forcing of oxygen
changes
P. J. Llanillo et al.
Title Page
Abstract Introduction
Conclusions References
Tables Figures
◭ ◮
◭ ◮
Back Close
Full Screen / Esc
Printer-friendly Version Interactive Discussion
Discussion
P
a
per
|
Dis
cussion
P
a
per
|
Discussion
P
a
per
|
Discussio
n
P
a
per
|
cruise was accomplished during a weak to moderate cold period (ONI was−0.9 for December to February) which was neither catalogued as La Ni ˜na for the same reason (it lasted only four consecutive seasons). However, for the purpose of this study, we will consider the 1993 warm event as an El Ni ˜no event and the 2009 cold event as a La Ni ˜na event because the magnitude and the sign of the ONI index during both events qualify
5
for this consideration, despite not lasting long enough to meet the duration criteria. Superimposed onto the ENSO variability, the region is influenced by the Pacific decadal oscillation (PDO) which operates on time scales of several decades (Man-tua et al., 1997; Chavez et al., 2003). The PDO also oscillates between warm (El Viejo) and cold (La Vieja) phases that go along with changes in sea surface height, sea
10
surface temperature, thermocline depth and ocean currents. Given their different time scales, ENSO has more impact on upper water masses while the PDO can induce more substantial changes over the whole permanent thermocline and intermediate layers influencing the dissolved oxygen content down to 700 m in the water column (e.g. Stramma et al., 2010a; Czeschel et al., 2011). A recent model study (Deutsch et
15
al., 2011) showed that the PDO can modify the thermocline depth and thus trigger an upward migration of the OMZ during La Vieja phases. In the middle to late 1990s there was a shift to the cold phase (Chavez et al., 2003, 2008), therefore the 1993 cruise was accomplished by the end of an El Viejo whereas the 2009 cruise took place under La Vieja conditions.
20
The eastern tropical Pacific OMZ is an important sink for oceanic-fixed nitrogen in the world oceans (e.g. Morales et al., 1999; Codispoti et al., 2001). The oceanic nitrogen can be removed in two ways. First, via denitrification, i.e. the heterotrophic reduction of nitrate (NO−3) through several steps with the gaseous dinitrogen (N2) as the final
product. This process has been observed typically for waters with dissolved oxygen
25
BGD
9, 17583–17618, 2012
Physical and biogeochemical forcing of oxygen
changes
P. J. Llanillo et al.
Title Page
Abstract Introduction
Conclusions References
Tables Figures
◭ ◮
◭ ◮
Back Close
Full Screen / Esc
Printer-friendly Version Interactive Discussion
Discussion
P
a
per
|
Dis
cussion
P
a
per
|
Discussion
P
a
per
|
Discussio
n
P
a
per
|
et al., 2009; Kalvelage et al., 2011). In the Peruvian OMZ, the nitrite produced during denitrification represents two thirds of the nitrite used for anammox (Lam et al., 2009). Recent studies point to anammox as the most important pathway for nitrogen removal within the OMZ (Kuypers et al., 2005; Thamdrup et al., 2006; Hamersley et al., 2007; Kalvelage et al., 2011).
5
Tsuchiya and Talley (1998) presented a comprehensive discussion about the struc-ture of water masses along 85◦50′W. Basically, five different water masses were iden-tified to contribute to the Southeast Pacific Ocean. The top 200 m are occupied by Subtropical Water (STW) and Subantarctic Water (SAAW). Immediately below, and down to about 600 m, the Equatorial Subsurface Water (ESSW) is the predominant
10
water mass. Coexisting with ESSW and reaching further deep, between about 500 and 1000 m, there is a significant contribution of Antarctic Intermediate Water (AAIW). The deep layers, at depths greater than about 1100 m, are dominated by the Pacific Deep Water (PDW). In this study we will thoroughly characterise the properties of these water masses and use the extended Optimum Multi-Parameter (OMP) method to quantify the
15
changes in water mass contributions and biogeochemical processes between the 1993 and 2009 occupations. In addition, we will analyse three zonal sections (along 3◦35′S, 6◦S and 14◦S) carried out in 2009, running between the continental shelf region and 85◦50′W (Fig. 1).
The OMP method (Tomczak and Large, 1989) has been used in the past to examine
20
the distribution of water masses in the eastern South Pacific: offChile (Silva et al., 2009), along the Chilean continental slope (Llanillo et al., 2012) and south of 10◦S (De Pol-Holz et al., 2007). Here we will use the extended OMP method (Karstensen and Tom-czak, 1998; Hupe and Karstensen, 2000), which decomposes the observed parameter distribution into contributions that originate from water mass mixing and those that stem
25
BGD
9, 17583–17618, 2012
Physical and biogeochemical forcing of oxygen
changes
P. J. Llanillo et al.
Title Page
Abstract Introduction
Conclusions References
Tables Figures
◭ ◮
◭ ◮
Back Close
Full Screen / Esc
Printer-friendly Version Interactive Discussion
Discussion
P
a
per
|
Dis
cussion
P
a
per
|
Discussion
P
a
per
|
Discussio
n
P
a
per
|
2 Data and methods
2.1 Observational data
Our study is based on two data sets taken in 1993 and 2009. The P19 data set was acquired during the World Ocean Circulation Experiment (WOCE) aboard R/V Knorr, with full-depth stations from Southern Chile to Guatemala. The section runs along
5
88◦W in the South Pacific but shifts to 85◦50′W in the equatorial Pacific (Tsuchiya and Talley, 1998). The stations between 14◦S and 1◦N were carried out from 23 to 31 March 1993. About 16 yr later, from 27 January to 19 February 2009, the R/V Me-teor cruiseM77/4 (hereafter M77) reoccupied the WOCE P19 stations between 14◦S and 1◦N, with bottle-data stations separated (on average) by about 60 km, although
10
with improved resolution near the equator (Fig. 1). M77 focused on the OMZ waters so most of the stations were made down to only 1200 dbar. The two cruises covered the tropical region during approximately the same season (about 1.5 months difference) so the seasonal differences are expected to be small as compared to the interannual and interdecadal changes.
15
The bottle data from both cruises between 14◦S to 1◦N have been objectively inter-polated onto a regular grid with 25 m spacing in depth and 60 km horizontal spacing, from just below the average mixed layer depth (55 m) down to 1200 m depth. An influ-ence radius of 100 km in the horizontal and an increasing influinflu-ence radius from 15 m at 55 m to 250 m at 1200 m in the vertical were applied. A comparison (not shown) of
20
data (temperature, salinity, oxygen) available at both low (bottle) and high (CTD) ver-tical resolution reveals that the interpolated bottle data reproduces well the CTD data distribution.
2.2 Extended Optimum Multi-Parameter (OMP) method
The extended OMP analysis (Hupe and Karstensen, 2000; Karstensen and Tomczak,
25
BGD
9, 17583–17618, 2012
Physical and biogeochemical forcing of oxygen
changes
P. J. Llanillo et al.
Title Page
Abstract Introduction
Conclusions References
Tables Figures
◭ ◮
◭ ◮
Back Close
Full Screen / Esc
Printer-friendly Version Interactive Discussion
Discussion
P
a
per
|
Dis
cussion
P
a
per
|
Discussion
P
a
per
|
Discussio
n
P
a
per
|
and Tomczak and Large (1989). The OMP analysis finds solutions, in the form of water mass fractions, to a set of linear mixing equations. In contrast to the classical mixing-triangle approach, which is based on temperature and salinity only, the OMP method utilizes more parameters (such as oxygen and inorganic nutrients) to determine the water mass fractions. Through this extension, the OMP analysis is based on a
multi-5
dimensional least-square fit that allows resolving the mixing of more than three water masses as well as the biogeochemical cycling and that considers additional conditions, such as the requirement that the fractions have to be non-negative.
The application of the OMP analysis requires a correct definition of the source wa-ters expected to contribute to the observed parameter field. To control the influence of a
10
certain parameter on the solution, a weighting is applied (Table 1, last row). This weight-ing considers the environmental variability within the region of water mass formation and the overall span of the parameter space in the source water matrix (Tomczak and Large, 1989). Further details on the technique, such as the data normalization scheme and the parameter weighting criteria, can be found in Tomczak and Large (1989).
15
The standard OMP analysis assumes that all parameters are conservative quantities, that is, they are only modified by mixing. This is difficult to justify when biogeochemical processes, such as the remineralization of organic matter and denitrification or calci-fication are likely to contribute to the observed parameter distribution. The extended OMP analysis (Hupe and Karstensen, 2000; Karstensen and Tomczak, 1998) solves
20
this issue (the non-conservative behaviour of parameters) by adding stoichiometry-scaled remineralization/respiration (influencing oxygen, nitrate, phosphate and silicate) and denitrification (influencing nitrate and phosphate) processes to the set of linear equations. The solution technique follows that for the standard OMP, the system must be over-determined in order to ensure an unambiguous solution and to provide for
25
error estimates. Given the available parameters (potential temperature θ, salinity S,
dissolved oxygen O2, nitrate NO3, phosphate PO4, and silicate SiO4) and
BGD
9, 17583–17618, 2012
Physical and biogeochemical forcing of oxygen
changes
P. J. Llanillo et al.
Title Page
Abstract Introduction
Conclusions References
Tables Figures
◭ ◮
◭ ◮
Back Close
Full Screen / Esc
Printer-friendly Version Interactive Discussion
Discussion
P
a
per
|
Dis
cussion
P
a
per
|
Discussion
P
a
per
|
Discussio
n
P
a
per
|
contribution of up to four source water masses and the transformations due to remine-ralization/respiration and denitrification.
The extended OMP analysis is also based on the assumption that the source waters are time-invariant. Hence, changes in the water mass fractions and the biogeochemi-cal variables are interpreted to respond solely to the redistribution of water masses and
5
to different rates of biogeochemical cycling (remineralization, denitrification). The ex-tended OMP method has been applied to the data of each transect but excluding those data points located within the mixed layer, as they are influenced by air/sea interaction processes which are not considered in the set of equations and may introduce sources and/or sinks to the thermodynamic parameters (Holte et al., 2012).
10
2.3 Source water masses
To apply the OMP method to the P19 and M77 data we first identify all possibly contributing source water masses mainly based on the discussions by Tsuchiya and Talley (1998) and Fiedler and Talley (2006). Characterized by a subsurface salinity maximum (Wyrtki, 1969), the STW is formed to the southwest of the 85◦50′W transect
15
by shallow subduction in a region where evaporation exceeds precipitation (Stramma et al., 1995). The Shallow Salinity Minimum Water (Reid, 1973; Tsuchiya and Talley, 1998; Karstensen et al., 2004) originates through the subduction of SAAW under STW, in the region between the Subantarctic and the Subtropical Fronts all along the southern rim of the South Pacific subtropical gyre. Not to be confused with the salinity minimum of
20
the AAIW, the SAAW is characterized by a salinity minimum at about 11◦C and salini-ties around 34.0. The SAAW is advected north with the Peru-Chile or Humboldt Current (HC) (Wyrtki, 1969) and partially ventilates the upper part of the OMZ.
Being a product of multiple and complex mixing in the equatorial region (Wyrtki, 1969), the ESSW is advected with relatively higher oxygen content (∼69.7 µmol kg−1), into the
25
BGD
9, 17583–17618, 2012
Physical and biogeochemical forcing of oxygen
changes
P. J. Llanillo et al.
Title Page
Abstract Introduction
Conclusions References
Tables Figures
◭ ◮
◭ ◮
Back Close
Full Screen / Esc
Printer-friendly Version Interactive Discussion
Discussion
P
a
per
|
Dis
cussion
P
a
per
|
Discussion
P
a
per
|
Discussio
n
P
a
per
|
the STW. Part of the nutrient-rich ESSW contributes to the waters that upwell along the Peruvian coast (Brink et al., 1983).
The prominent salinity minimum that characterizes the AAIW is found under both ESSW and SAAW, centred at depths between 500 and 1000 m. Formed by subduction between the Subpolar and Polar Fronts (Hartin et al., 2011), the AAIW source water has
5
high oxygen and low nutrient concentrations. Below the AAIW and centred at depths between 2500 and 3000 m, the PDW is characterized by a broad silicate maximum. PDW comes to this region following an intricate path through the North Pacific and it is believed to be the return flow of modified bottom waters originated at the South Pacific in the Antarctic Circumpolar Current (ACC) (Reid, 1973; Tsuchiya and Talley, 1998).
10
As we concentrate our analysis in the upper 1200 m of the water column, other deep waters such as the Circumpolar Deep Water or the Antarctic Bottom Water are not considered here.
The initial step for defining the source water characteristics (summarized in Table 1) is to set the temperature/salinity source water values (or water types) using information
15
available in the literature (Tsuchiya and Talley, 1998; De Pol-Holz et al., 2007; Silva et al., 2009; Llanillo et al., 2012). Next, the data points within a range of temperature and salinity values, centred on the temperature/salinity water type definition for each water mass, are selected. Then, we impose geographical and depth constraints to select only those data points that actually lay within the water mass formation areas;
20
this is necessary in order to properly interpret the biogeochemical signals (respiration, denitrification). For this purpose we have used the P19 data, as it covers all potential source water formation areas. Finally, the selected data points are used to calculate the associated nutrient (NO3, PO4and SiO4) and oxygen source water types by averaging
their respective values (Table 1).
25
BGD
9, 17583–17618, 2012
Physical and biogeochemical forcing of oxygen
changes
P. J. Llanillo et al.
Title Page
Abstract Introduction
Conclusions References
Tables Figures
◭ ◮
◭ ◮
Back Close
Full Screen / Esc
Printer-friendly Version Interactive Discussion
Discussion
P
a
per
|
Dis
cussion
P
a
per
|
Discussion
P
a
per
|
Discussio
n
P
a
per
|
optimize the source water types as those that have the lowest residuals. The final water types are presented in Table 1.
The remineralization of organic matter and the associated respiration are included in the analysis via a set of Redfield ratios (Redfield et al., 1963), as they connect the changes in inorganic nutrients and oxygen. We use the Redfield ratios −170 : 16 : 1
5
corresponding to ∆O2:∆NO3:∆PO4 (Anderson and Sarmiento, 1994). For the ratio
∆SiO4:∆PO4, affected by the dissolution of opaline silica (Hupe and Karstensen, 2000),
we select an average value of 40 : 1 (Broecker and Peng, 1982; Watson and Whit-field, 1985; Takeda, 1998). Furthermore the amount of PO4remineralized during
deni-trification is chosen to follow a ratio of−1 : 0.01 for∆NO3:∆PO4(Gruber and Sarmiento,
10
1997). The extended OMP method only accounts for the first step of the denitrification process (the anaerobic reduction of NO3to NO2). Whether this NO2is then used in the
anammox process or follows the denitrification route, ending both in the loss of oceanic nitrate, cannot be elucidated with the current extended OMP method.
The OMP analysis is divided in two depth ranges (upper and lower) in order to limit
15
the number of source waters and to ensure an over-determined system of equations. By selecting 450 m as the separation horizon we find a smooth transition of mixing fractions and residuals. We run the upper analysis with STW, SAAW, ESSW and AAIW and the lower analysis with ESSW, AAIW and PDW. To account for possible outliers in the data set, only those results from the OMP analysis which have mass conservation
20
errors less than∼4 % are considered; following this condition, we discarded 0.5 % of the data points in M77 section and 0.7 % of the data points in P19 section.
3 Results
In this section, for completeness, we present the results derived from the extended OMP method to both the P19 and M77 cruise data, specifically the contribution of
25
BGD
9, 17583–17618, 2012
Physical and biogeochemical forcing of oxygen
changes
P. J. Llanillo et al.
Title Page
Abstract Introduction
Conclusions References
Tables Figures
◭ ◮
◭ ◮
Back Close
Full Screen / Esc
Printer-friendly Version Interactive Discussion
Discussion
P
a
per
|
Dis
cussion
P
a
per
|
Discussion
P
a
per
|
Discussio
n
P
a
per
|
regional physical and biogeochemical processes. The differences observed between both occupations are analysed in Sect. 4.
3.1 Water mass distribution
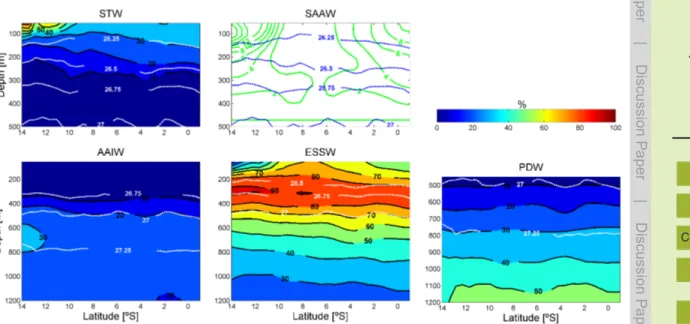
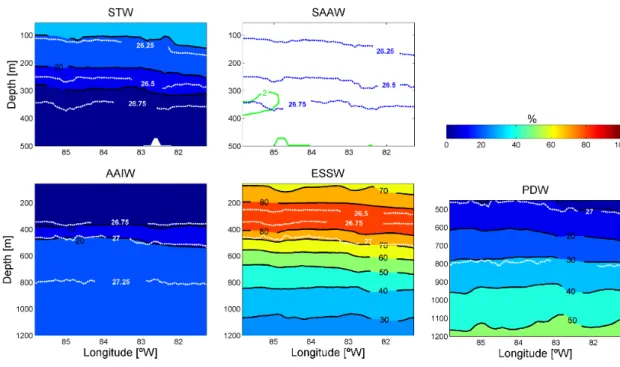
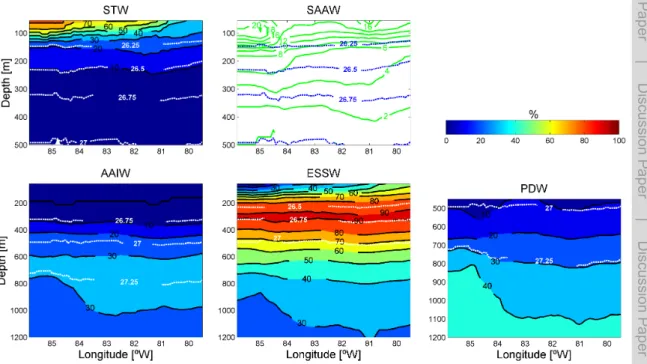
The water mass distribution obtained with the extended OMP method for the recent M77 data illustrates the coexistence and mixing of water masses of equatorial,
sub-5
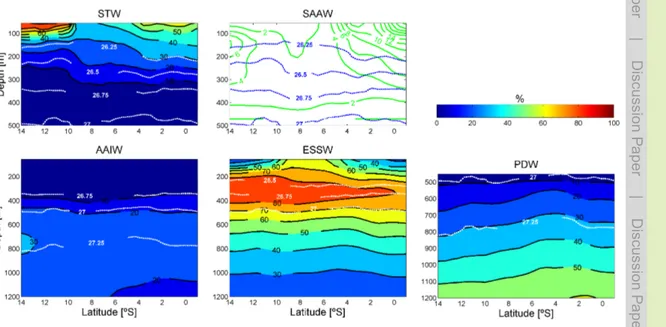
tropical, subantarctic and antarctic origin along the 85◦50′W section, between 14◦S and 1◦N (Fig. 2a). The distribution obtained for the same latitude range for the P19 data shows similar patterns to those found in M77 data (Fig. 2b) and complements an earlier distribution obtained by applying the standard OMP method (De Pol-Holz et al., 2007) to the southern part of the P19 section (50–10◦S). The general patterns
10
along the whole P19 section are already visible from individual parameter distributions (e.g. presented in Tsuchiya and Talley, 1998). In brief, the shallow layers are composed by subtropical (STW) and subantarctic (SAAW) water masses, while at intermediate depth, the equatorial waters (ESSW) overlay the antarctic waters (AAIW); for levels deeper than about 1100 m the predominant water mass is PDW.
15
STW is best represented (>40 %) in the top 100 m, between 14 and 10◦S, closer to
its source region. SAAW is also well represented south of 11◦S, reaching up to 20 % in the uppermost layer and below the STW, but is not significant (<4 %) north of 10◦S.
The ESSW core, with a contribution of about 90 %, is located at about 300 m. AAIW contributes more than 30 % between 600 and 800 m at the southern boundary of the
20
region but is slowly diluted to the north and replaced mainly by ESSW (Fig. 2a). One important consideration is that in the equatorial region (4◦S–1◦N) there are remnants of low-salinity waters of equatorial origin down to 200 m. These waters most likely originated north of the equator, in the Panama Bight, where enhanced precipita-tion under the ITCZ create low salinity surface waters that are subsequently advected
25
BGD
9, 17583–17618, 2012
Physical and biogeochemical forcing of oxygen
changes
P. J. Llanillo et al.
Title Page
Abstract Introduction
Conclusions References
Tables Figures
◭ ◮
◭ ◮
Back Close
Full Screen / Esc
Printer-friendly Version Interactive Discussion
Discussion
P
a
per
|
Dis
cussion
P
a
per
|
Discussion
P
a
per
|
Discussio
n
P
a
per
|
already capable of recognizing the fresh fingerprint of these equatorial waters, asso-ciating them to the also relatively fresh SAAW, which is almost totally eroded north of 10◦S, making feasible to discern the presence of these equatorial fresh waters north of 4◦S.
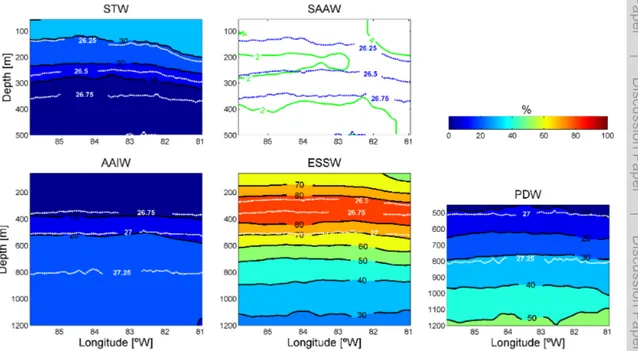
The distribution of water masses between 85◦50′W and the continental shelf was
5
also deduced along three zonal sections carried out during the M77 cruise (2009) at 3◦35′S, 6◦S and 14◦S (Figs. 3–5). SAAW has the highest percentage (>20 %) in the
western part of the 14◦S transect but barely exceeds 2 % at 6◦S; however, it increases again to about 6 % at 3◦35′S, very likely as an artifact caused by the presence of low-salinity equatorial surface waters as discussed above (and as also proposed by
10
Tsuchiya and Talley, 1998). The AAIW participation exceeds 30 % between 600 and 800 m (down to 1000 m towards the continent) at 14◦S and decreases towards the equator with maximal contributions of 20 % at 3◦35′S. The observed decrease in the mixing fractions of both AAIW and SAAW north of 14◦S agrees well with their northward path along the subtropical gyre.
15
The contribution of STW decreases rapidly as we move from the southern to the central and northern sections. This confirms the progressive recirculation of the wa-ter mass towards the ocean inwa-terior, south of the Equatorial Front, and back pole-ward along the boundary, as a result of advection with the Peru-Chile Counter Current (PCCC) (Strub et al., 1998). This can be appreciated at the offshore end of section
20
14◦S (Fig. 5).
ESSW is the main water mass (>70 %) in the 150 to 500 m depth range for all zonal
transects, with its core (>90 %) located near 300 m depth; this core is most developed
at 14◦S, where it spans the whole longitudinal transect. The PDW becomes dominant (>50 %) only in the deepest levels (≥1100 m) of all these sections, slightly shallowing
25
BGD
9, 17583–17618, 2012
Physical and biogeochemical forcing of oxygen
changes
P. J. Llanillo et al.
Title Page
Abstract Introduction
Conclusions References
Tables Figures
◭ ◮
◭ ◮
Back Close
Full Screen / Esc
Printer-friendly Version Interactive Discussion
Discussion
P
a
per
|
Dis
cussion
P
a
per
|
Discussion
P
a
per
|
Discussio
n
P
a
per
|
3.2 Respiration and denitrification
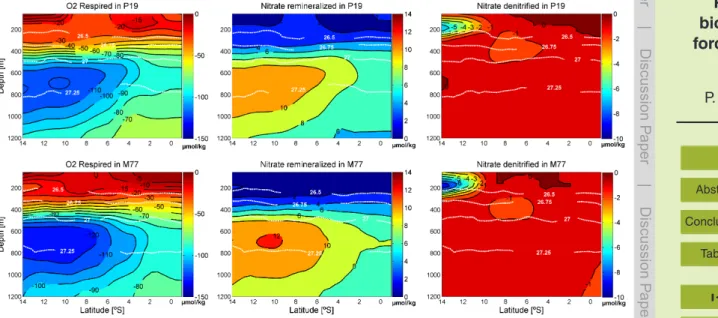
The extended OMP analysis provides a bulk estimate of nutrient enrichment trough the remineralization of organic matter and of oxygen depletion through the accompa-nying respiration, assuming a Redfield stoichiometry. As some of the water masses we used in the analysis are created by complex mixing processes rather than by air/sea
5
interaction processes, the respective source water types do not reflect surface ocean concentrations. This is most obvious in the oxygen concentrations of the source water types that are, except for STW and SAAW, far from saturation (Table 1, last column). As such, the amount of respired oxygen (Fig. 6) is to be seen relative to the source water type definitions. This is most prominent in the core of the OMZ were one would
10
expect to find the amount of respired oxygen to be larger than 200 µmol kg−1 but the method determines only 30 to 50 µmol kg−1. Nevertheless, it makes clear that the OMZ is ventilated by water that is already rather low in oxygen concentrations and as such even a moderate respiration can maintain the existence of the OMZ (Karstensen et al., 2008).
15
The patterns of remineralized nitrate and phosphate (phosphate not shown) closely follow the respired oxygen, with an inverse relation given by the Redfield ratios. Most important deviations arise from the nitrate removal (and proportional phosphate enrich-ment, not shown) due to denitrification, also considered in the extended OMP analysis (Fig. 6). The denitrified nitrate estimated from the OMP analysis is different from the
di-20
rectly observed nitrite. The extended OMP method is able to detect the signature of “an-cient denitrification”, in waters advected to the study area. In general our method has similarities with theN∗approach (Gruber and Sarmiento, 1997) but also considers the
mixing of water masses when estimating the denitrification. For both cruises the largest signal for nitrate removal via denitrification is found between 10 and 14◦S, at about
25
BGD
9, 17583–17618, 2012
Physical and biogeochemical forcing of oxygen
changes
P. J. Llanillo et al.
Title Page
Abstract Introduction
Conclusions References
Tables Figures
◭ ◮
◭ ◮
Back Close
Full Screen / Esc
Printer-friendly Version Interactive Discussion
Discussion
P
a
per
|
Dis
cussion
P
a
per
|
Discussion
P
a
per
|
Discussio
n
P
a
per
|
of anammox in the upper part of the OMZ offPeru/Chile (Hamersley et al., 2007; Tham-drup et al., 2006). A second core of denitrified nitrate is found for both cruises between 4◦S and 10◦S in the depth range from 350 to 500 m (about 26.5< σθ<27) and in
agreement with earlier interpretations (Tsuchiya and Talley, 1998).
4 Changes along 85◦50′W between 1993 and 2009 5
Temporal changes in the spatial distribution of relevant biogeochemical parameters such as oxygen or nitrate may be caused by shifts in the water mass contributions (this includes changes in the advection, diffusion and isopycnal heave) and/or by changes in the biogeochemical activity (respiration and denitrification rates). Isopycnal heave may take place at very different temporal scales, from minutes (internal waves) and
10
days/weeks (mesoscale phenomena) to interannual or interdecadal processes such as ENSO and PDO. In contrast, there may be changes related to variations in the advection and mixing of the different water masses (e.g. Roemmich et al., 2007), the swifter the arrival of some specific water mass the greater its contribution and its effect on the local properties. Changes related to the variability of source water types due to
15
changes in air/sea interaction in the water mass formation at the source region (Bindoff and McDougall, 1994) cannot be directly considered by the OMP analysis although they might be reflected by changes in the water mass distribution.
Our aim here is to discern between the physical (water mass distribution changes) and the biogeochemical components of the observed changes in oxygen and nitrate.
20
BGD
9, 17583–17618, 2012
Physical and biogeochemical forcing of oxygen
changes
P. J. Llanillo et al.
Title Page
Abstract Introduction
Conclusions References
Tables Figures
◭ ◮
◭ ◮
Back Close
Full Screen / Esc
Printer-friendly Version Interactive Discussion
Discussion
P
a
per
|
Dis
cussion
P
a
per
|
Discussion
P
a
per
|
Discussio
n
P
a
per
|
4.1 Measured changes in oxygen and nitrate content
In the top few hundred meters there are three locations possibly influenced by the surface and subsurface zonal currents. First, there is a decrease in dissolved oxy-gen and an increase in nitrate in the 55 to 250 m depth range at the equator (Fig. 7). This corresponds to the location of the relatively oxygen-rich and nutrient-poor
east-5
ward flowing EUC. The weakening of the EUC (Czeschel et al., 2012) may explain the decrease in oxygen (and the increase in nitrate) found at this location. Second, there are two cores with oxygen increase at 8◦S, a shallow one centred at 50 m and a deep one centred at some 250 m (Fig. 7a). These cores may possibly be associated with the oxygen-rich eastward flowing Southern Subsurface Counter Current (SSCC)
10
(Czeschel et al., 2011); however, both cores must have different origin, as the shallow core displays a reduction in the nitrate content whereas the nitrate concentration of the deep core has increased (Fig. 7b). Third, between 11 and 9.5◦S and in the 50–150 m depth range, we observe a core that has undergone an increase in nitrate and a de-crease in oxygen (Fig. 7). The same behaviour is found in another core at 4◦S in the
15
upper 250 m depth. We identify the former core with the westward flowing South Equa-torial Current (SEC) and the core at 4◦S with the southern equatorial branch of the SEC (Czeschel et al., 2011). It is possible that wind-driven changes in the SEC (with stronger south-easterlies during the 2009 La Ni ˜na) may have caused the variations observed in oxygen and nitrate by strengthening these currents.
20
At 1◦N and between 400 and 600 m, there is a core with nitrate decrease and slight oxygen increase (Fig. 7), possibly associated to an increase in the transport of the eastward flowing North Intermediate CounterCurrent (NICC) (Czeschel et al., 2011). Between 3 and 5◦S and in the depth range from 400 to 900 m, we find oxygen de-pletion and nitrate increase (down to 1200 m) (Fig. 7). These changes may be related
25
BGD
9, 17583–17618, 2012
Physical and biogeochemical forcing of oxygen
changes
P. J. Llanillo et al.
Title Page
Abstract Introduction
Conclusions References
Tables Figures
◭ ◮
◭ ◮
Back Close
Full Screen / Esc
Printer-friendly Version Interactive Discussion
Discussion
P
a
per
|
Dis
cussion
P
a
per
|
Discussion
P
a
per
|
Discussio
n
P
a
per
|
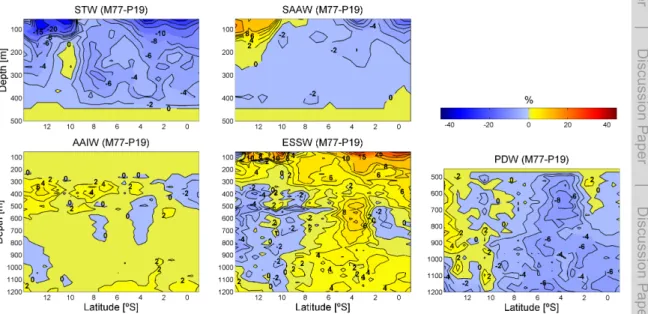
4.2 Changes in water mass distribution
In the near surface layers (down to less than 200 m) and between 14 and 10◦S, there is a substantial increase in SAAW at the expense of STW. The apparent decrease of SAAW in the northern end of this section actually represents a decrease in the equa-torial surface waters found south of the Equator during the 2009 La Ni ˜na conditions
5
(see Sect. 3.1). The increase in precipitation in the eastern equatorial Pacific during El Ni ˜no conditions could explain the larger content in equatorial surface water found in the 1993 data.
In the upper thermocline and upper intermediate waters the dominant spatial trend is caused by the upwelling/downwelling of ESSW associated to La Ni ˜na/El Ni ˜no
con-10
ditions respectively. In the upper thermocline layers, down to about 300 m, the STW is mainly replaced by ESSW. In the upper intermediate layers, between 300 and 600 m depth, mainly ESSW (south of 8◦S) but also STW (from 8◦S to 2◦S) are replaced by the upper part of AAIW (Fig. 8). This upward expansion also reaches down to the AAIW core (30 % contribution), centred at 700 m depth (Fig. 2a, b).
15
The heaving of isopycnals associated to ENSO may explain the upward expansion of the upper part of AAIW but may not reach as deep in the water column as to influence the core of AAIW. A comparison of the changes in depth of the isopycnals with the changes in depth of the core of AAIW (not shown) reveals that isopycnal heave may only explain half of the total vertical displacement of the core of AAIW. Thus, at least
20
half of the shoaling of the core of AAIW has to be explained by an increased advection of AAIW at shallower depths, perhaps as part of a longer term trend of shoaling and density reductions of the core of AAIW south of 15◦S in the Pacific (Schmidtko and Johnson, 2012). This shoaling of AAIW will necessarily ventilate a different depth range of the OMZ as it flows northward.
25
BGD
9, 17583–17618, 2012
Physical and biogeochemical forcing of oxygen
changes
P. J. Llanillo et al.
Title Page
Abstract Introduction
Conclusions References
Tables Figures
◭ ◮
◭ ◮
Back Close
Full Screen / Esc
Printer-friendly Version Interactive Discussion
Discussion
P
a
per
|
Dis
cussion
P
a
per
|
Discussion
P
a
per
|
Discussio
n
P
a
per
|
appears centred between 5◦S and 3◦S, at the location of the westward flowing SEIC (Czeschel et al., 2012). The change observed south of 8◦S (Fig. 8) does not appear to be directly linked to the ENSO phenomenon; rather it may possibly reflect the decadal shift of phase in the PDO, from the 1993 warm El Viejo to the 2009 relatively cold La Vieja.
5
4.3 Physical and biogeochemical contributions to oxygen and nitrate changes
By means of the extended OMP method we may assess how much of the observed changes are related to variations in the water mass distribution (physical component – including advection, diffusion and isopycnal heave –) and how much are caused by changes in the respiration and denitrification rates (biogeochemical component).
10
As each parameter (oxygen, nitrate) is bound to a residual (difference between the measured data and the OMP modelled data), the exact contribution of the physical and biogeochemical components of change remain unknown but yet we may assess if their estimates are significant.
The physical and biogeochemical components of the oxygen and nitrate changes
15
between both cruises are shown in Fig. 9. The white-shaded areas represent the points where the total error, or difference between the measured change and the OMP modelled change (physical plus biogeochemical) of the parameter, is larger than each component of change examined separately, i.e. outside the white-shaded areas the signal is larger than the noise so the information provided is significant. Notice that this
20
is the most restrictive scenario as we are assuming that all the error in the OMP fit is associated to only one component of the change.
Hereafter, we will refer to the physical component of change as advection although it also includes diffusion and isopycnal heave. Within the OMZ waters, an increase/ decrease of oxygen due to advection will naturally lead to more/less oxygen availability
25
BGD
9, 17583–17618, 2012
Physical and biogeochemical forcing of oxygen
changes
P. J. Llanillo et al.
Title Page
Abstract Introduction
Conclusions References
Tables Figures
◭ ◮
◭ ◮
Back Close
Full Screen / Esc
Printer-friendly Version Interactive Discussion
Discussion
P
a
per
|
Dis
cussion
P
a
per
|
Discussion
P
a
per
|
Discussio
n
P
a
per
|
ventilated by AAIW. This advective gain in oxygen is partially compensated by an in-crease in the respiration rate as more oxygen becomes available in this depth range of the OMZ (Fig. 9b). The outcome is a net change in oxygen of smaller amplitude (Fig. 7a). In the upper 300 m this situation is reversed, there is a general decrease in advected oxygen (Fig. 9a) and a gain in advected nitrate (Fig. 9c) which is accompanied
5
by a reduction in the oxygen respired (as there is less oxygen available from advection) (Fig. 9b) and consequently, a reduction in the nitrate remineralized (Fig. 9d). These changes may be explained by the shift from the 1993 El Ni ˜no to the 2009 La Ni ˜na con-ditions, which promote an upward displacement of the oxygen-poor and nutrient-rich ESSW.
10
The amount of nitrate loss due to denitrification is directly influenced by changes in oxygen availability, which ultimately depends on the interplay between oxygen supply and respiration rate. As also shown by our data, an increase in dissolved oxygen in the upper part of the water column takes place during El Ni ˜no conditions (Guill ´en et al., 1988), accompanied by a deepening of the upper part of the OMZ which dampens
15
denitrification in the upper layers (Morales et al., 1999). During La Ni ˜na events the situation reverses, the reinforced upwelling promotes the rise in depth of the upper part of the OMZ, enhancing denitrification in the upper part of the water column (Morales et al., 1999). Therefore, the ENSO phase during each cruise may explain the increase in denitrification observed in the upper 250 m south of 10◦S (Figs. 6 and 9e). Further
20
deep, between 200 and 500 m depth, the core of denitrification with absolute values>1 µmol kg−1 is smaller in 2009 (Fig. 6) as corresponding to a decrease in denitrification (shown as an apparent gain in nitrate in Fig. 9e). The same pattern is observed in two cores located between 10–7◦S in the depth range of 100–300 m depth. A decrease in denitrification is also observed in Fig. 9e, roughly between 10–8◦S and 6–4◦S, from
25
BGD
9, 17583–17618, 2012
Physical and biogeochemical forcing of oxygen
changes
P. J. Llanillo et al.
Title Page
Abstract Introduction
Conclusions References
Tables Figures
◭ ◮
◭ ◮
Back Close
Full Screen / Esc
Printer-friendly Version Interactive Discussion
Discussion
P
a
per
|
Dis
cussion
P
a
per
|
Discussion
P
a
per
|
Discussio
n
P
a
per
|
Changes in the intensity of the zonal currents of the Equatorial Current System, already discussed in the Sect. 4.1, may also be appreciated at their specific loca-tions when discerning between physical and biogeochemical forcings. In general, an increase in the intensity of an eastward flowing current (or a weakening in a westward current) will be shown by a gain of advected oxygen, an increase in the respiration rate
5
and a decrease in the nitrate loss by denitrification. The situation is the opposite with a weakening of an eastward (or strengthening of a westward) current.
5 Conclusions
The observed changes in the upper 250 m are clearly influenced by the ENSO phe-nomenon. During the 1993 El Ni ˜no event, there was increased advection of
rela-10
tively well oxygenated STW waters from the west of the equatorial Pacific Basin which replaced the low-oxygen ESSW in the top 250 m of the water column. This input deepened the upper part of the OMZ, dampening denitrification in the upper layers. In addition, the northward advance of the Shallow Salinity Minimum originated by sub-ducted SAAW was reduced. In contrast, during the 2009 La Ni ˜na conditions, the
rein-15
forced trade winds drove enhanced upwelling, raising the upper part of the OMZ. The nutrient-rich and oxygen-poor ESSW replaced STW in the upper layers, inducing a re-duction in the amount of oxygen available for respiration and an increase in the nitrate loss by denitrification.
The heaving of isopycnals associated to ENSO explains the remarkable shoaling
20
and upward expansion of the upper part of AAIW observed in the southern part of the section, with AAIW replacing ESSW between 300 and 600 m. This brought a large in-crease in advected oxygen to this depth range of the OMZ which led, on one hand, to a decrease in the amount of denitrification and, on the other hand, to a larger con-sumption of oxygen through an increased respiration and to a larger production of
25
BGD
9, 17583–17618, 2012
Physical and biogeochemical forcing of oxygen
changes
P. J. Llanillo et al.
Title Page
Abstract Introduction
Conclusions References
Tables Figures
◭ ◮
◭ ◮
Back Close
Full Screen / Esc
Printer-friendly Version Interactive Discussion
Discussion
P
a
per
|
Dis
cussion
P
a
per
|
Discussion
P
a
per
|
Discussio
n
P
a
per
|
of isopycnals associated to La Ni ˜na conditions favours the ventilation of the OMZ by AAIW.
The influence of ENSO may not reach as far deep in the water column as to explain the upward expansion also found in the core of AAIW, centred at about 700 m depth in 2009. Therefore, it is possible that these deep changes are related with a longer term
5
trend of shoaling and density reductions of the core of AAIW as found by Schmidtko and Johnson (2012) south of 15◦S in the eastern South Pacific. At an interdecadal time scale, such changes in the pattern of advection of AAIW would represent a natural negative feedback of the ocean circulation against the long term trend of expanding OMZs found in the world oceans (Stramma et al., 2008), possibly explaining why an
10
increased oxygen content has been reported for some areas of the subtropical gyres, e.g. offChile between 200 and 700 m (see Fig. 2d of Stramma et al., 2010b). However, the temporal resolution of our data set prevents us to test this hypothesis.
Besides the general changes described above, we observe a few cores along the latitudinal section in which oxygen and nitrate change differently. These cores are
re-15
lated with changes in the intensity of the zonal currents of the Equatorial Current Sys-tem. The eastward flowing currents (EUC, SSCC and NICC) ventilate the OMZ as they supply waters with relatively higher oxygen content whereas the westward flow-ing currents (SEC and SEIC) transport waters almost depleted of oxygen from the OMZ. Therefore, a weakening in an eastward (or the strengthening of a westward)
20
current enhances the presence of ESSW and brings about a decrease/increase in ad-vected oxygen/nitrate; this leads to a decrease in the respired oxygen and in the nitrate remineralized and induces further nitrate loss by denitrification. The situation reverses with a strengthening of the eastward or weakening of the westward currents.
Acknowledgements. P. J. L. was supported through a JAE grant from Consejo Superior de 25
BGD
9, 17583–17618, 2012
Physical and biogeochemical forcing of oxygen
changes
P. J. Llanillo et al.
Title Page
Abstract Introduction
Conclusions References
Tables Figures
◭ ◮
◭ ◮
Back Close
Full Screen / Esc
Printer-friendly Version Interactive Discussion
Discussion
P
a
per
|
Dis
cussion
P
a
per
|
Discussion
P
a
per
|
Discussio
n
P
a
per
|
References
Anderson, L. A. and Sarmiento, J. L.: Redfield ratios of remineralization determined by nutrient data analysis, Global Biogeochem. Cy., 8, 65–80, 1994.
Barber, R. T. and Chavez, F. P.: Biological consequences of El Ni ˜no, Science, 222, 1203–1210, 1983.
5
Bindoff, N. L. and McDougall, T. J.: Diagnosing climate change and ocean ventilation using hydrographic data, J. Phys. Oceanogr., 24, 1137–1152, 1994.
Brink, K. H., Halpern, D., Huyer, A., and Smith, R. L.: The physical environment of the Peruvian upwelling system, Progr. Oceanogr., 12, 285–305, 1983.
Broecker, W. S. and Peng, T. H.: Tracers in the Sea, edited by: Lamont-Doherty Geological 10
Observatory, C. U., Columbia University, Palisades, NY, 1982.
Chavez, F. P., Ryan, J., Lluch-Cota, S. E., and ˜Niquen C. M.: From anchovies to sardines and back: multidecadal change in the Pacific Ocean, Science, 299, 217–221, 2003.
Chavez, F. P., Bertrand, A., Guevara-Carrasco, R., Soler, P., and Csirke, J.: The northern Hum-boldt Current System: Brief history, present status and a view towards the future, Progr. 15
Oceanogr., 79, 95–105, 2008.
Codispoti, L. A., Brandes, J. A., Christensen, J. P., Devol, A. H., Naqvi, S. W. A., Paerl, H. W., and Yoshinari, T.: The oceanic fixed nitrogen and nitrous oxide budgets: Moving targets as we enter the anthropocene?, Scientia Marina, 65, 85–105, 2001.
Czeschel, R., Stramma, L., Schwarzkopf, F. U., Giese, B. S., Funk, A., and Karstensen, J.: 20
Middepth circulation of the eastern tropical South Pacific and its link to the oxygen minimum zone, J. Geophys. Res., 116, C01015, doi:10.1029/2010JC006565, 2011.
Czeschel, R., Stramma, L., and Johnson, G. C.: Oxygen decreases and variability in the eastern equatorial Pacific, J. Geophys. Res., in press, 2012.
De Pol-Holz, R., Ulloa, O., Lamy, F., Dezileau, L., Sabatier, P., and Hebbeln, D.: Late quater-25
nary variability of sedimentary nitrogen isotopes in the eastern South Pacific Ocean, Paleo-ceanography, 22, PA2207, doi:10.1029/2006PA001308, 2007.
Deutsch, C., Brix, H., Ito, T., Frenzel, H., and Thompson, L.: Climate-forced variability of ocean hypoxia, Science, 333, 336–339, 2011.
Fiedler, P. C. and Talley, L. D.: Hydrography of the eastern tropical Pacific: A review, Progr. 30
BGD
9, 17583–17618, 2012
Physical and biogeochemical forcing of oxygen
changes
P. J. Llanillo et al.
Title Page
Abstract Introduction
Conclusions References
Tables Figures
◭ ◮
◭ ◮
Back Close
Full Screen / Esc
Printer-friendly Version Interactive Discussion
Discussion
P
a
per
|
Dis
cussion
P
a
per
|
Discussion
P
a
per
|
Discussio
n
P
a
per
|
Gruber, N. and Sarmiento, J. L.: Global patterns of marine nitrogen fixation and denitrification, Global Biogeochem. Cy., 11, 235–266, 1997.
Guill ´en, O., C ´arcamo, E., and Calientes, R.: Ox´ıgeno disuelto, nutrientes y clorofila frente a la costa peruana durante El Ni ˜no 1987, Memorias del Simposio Internacional de los Recursos Vivos y las Pesquer´ıas en el Pac´ıfico Sud-Este. Rev. Comisi ´on Permanente del Pac´ıfico Sur, 5
N ´umero especial, 83–94, 1988.
Hamersley, M. R., Lavik, G., Woebken, D., Rattray, J. E., Lam, P., Hopmans, E. C., Sinninghe Damst ´e, J. S., Kr ¨uger, S., Graco, M., Guti ´errez, D., and Kuypers, M. M. M.: Anaerobic am-monium oxidation in the Peruvian oxygen minimum zone, Limnol. Oceanogr., 52, 923–933, 2007.
10
Hartin, C. A., Fine, R. A., Sloyan, B. M., Talley, L. D., Chereskin, T. K., and Happell, J.: Formation rates of Subantarctic mode water and Antarctic intermediate water within the South Pacific, Deep Sea Res. Pt. I, 58, 524–534, 2011.
Holte, J. W., Talley, L. D., Chereskin, T. K., and Sloyan, B. M.: The role of air-sea fluxes in Sub-antarctic Mode Water formation, J. Geophys. Res., 117, C03040, doi:1029/2011JC007798, 15
2012.
Hupe, A. and Karstensen, J.: Redfield stoichiometry in Arabian Sea subsurface waters, Global Biogeochem. Cy., 14, 357–372, 2000.
Kalvelage, T., Jensen, M. M., Contreras, S., Revsbech, N. P., Lam, P., G ¨unter, M., LaRoche, J., Lavik, G., and Kuypers, M. M. M.: Oxygen sensitivity of anammox 20
and coupled N-cycle processes in oxygen minimum zones, PLoS ONE, 6, e29299, doi:10.1371/journal.pone.0029299, 2011.
Karstensen, J.: Formation of the South Pacific shallow salinity minimum: A Southern Ocean pathway to the tropical Pacific, J. Phys. Oceanogr., 34, 2398–2412, 2004.
Karstensen, J. and Tomczak, M.: Age determination of mixed water masses using CFC and 25
oxygen data, J. Geophys. Res., 103, 18599–18609, 1998.
Karstensen, J., Stramma, L., and Visbeck, M.: Oxygen minimum zones in the eastern tropical Atlantic and Pacific oceans, Progr. Oceanogr., 77, 331–350, 2008.
Kessler, W. S.: The circulation of the eastern tropical Pacific: A review, Progr. Oceanogr., 69, 181–217, 2006.
30
BGD
9, 17583–17618, 2012
Physical and biogeochemical forcing of oxygen
changes
P. J. Llanillo et al.
Title Page
Abstract Introduction
Conclusions References
Tables Figures
◭ ◮
◭ ◮
Back Close
Full Screen / Esc
Printer-friendly Version Interactive Discussion
Discussion
P
a
per
|
Dis
cussion
P
a
per
|
Discussion
P
a
per
|
Discussio
n
P
a
per
|
Lam, P., Lavik, G., Jensen, M. M., van de Vossenberg, J., Schmid, M., Woebken, D., Guti ´errez, D., Amann, R., Jetten, M. S. M., and Kuypers, M. M. M.: Revising the nitrogen cycle in the Pe-ruvian oxygen minimum zone, P. Natl. Acad. Sci. USA, 106, doi:10.1073/pnas.0812444106, 2009.
Lipschultz, F., Wofsy, S. C., Ward, B. B., Codispoti, L. A., Friedrich, G., and Elkins, J. W.: Bac-5
terial transformations of inorganic nitrogen in the oxygen-deficient waters of the Eastern Tropical South Pacific Ocean, Deep Sea Res. Pt. A., 37, 1513–1541, 1990.
Llanillo, P. J., Pelegr´ı, J. L., Duarte, C. M., Emelianov, M., Gasser, M., Gourrion, J., and Rodr´ıguez-Santana, A.: Meridional and zonal changes in water properties along the con-tinental slope offcentral and northern Chile, Ciencias Marinas, 38, Special issue on Descrip-10
tive Oceanography with Tracers in Coastal and Deep Oceans, 307–332, 2012.
Mackas, D. L., Denman, K. L., and Bennett, A. F.: Least squares multiple tracer analysis of water mass composition, J. Geophys. Res., 92, 2907–2918, 1987.
Mantua, N. J., Hare, S. R., Zhang, Y., Wallace, J. M., and Francis, R. C.: A Pacific interdecadal climate oscillation with impacts on salmon production, B Am. Meteorol. Soc., 78, 1069–1079, 15
1997.
Morales, C., Hormaz ´abal, S., and Blanco, J. L.: Interannual variability in the mesoscale distri-bution of the depth of the upper boundary of the oxygen minimum layer offnorthern Chile (18◦–24◦S): Implications for the pelagic system and biogeochemical cycling, J. Mar. Res., 57, 909–932, 1999.
20
Paulmier, A. and Ruiz-Pino, D.: Oxygen minimum zones (OMZs) in the modern ocean, Progr. Oceanogr., 80, 113–128, 2009.
Philander, S. G. H.: El Ni ˜no Southern Oscillation phenomena, Nature, 302, 295–301, 1983. Redfield, A. C., Ketchum, B. H., and Richards, F. A.: The influence of organisms on the
compo-sition of sea-water, in: The Sea: ideas and observations on progress in the study of the seas 25
(Vol. 2), edited by: Hill, M. N., Wiley, London, 26–77, 1963.
Reid, J. L.: The shallow salinity minima of the Pacific Ocean, Deep Sea Res., 20, 51–68, 1973. Roemmich, D., Gilson, J., Davis, R., Sutton, P., Wijffels, S., and Riser, S.: Decadal spinup of the
South Pacific Subtropical Gyre, J. Phys. Oceanogr., 37, 162–173, 2007.
Schmidtko, S. and Johnson, G. C.: Multidecadal warming and shoaling of Antarctic Intermediate 30
BGD
9, 17583–17618, 2012
Physical and biogeochemical forcing of oxygen
changes
P. J. Llanillo et al.
Title Page
Abstract Introduction
Conclusions References
Tables Figures
◭ ◮
◭ ◮
Back Close
Full Screen / Esc
Printer-friendly Version Interactive Discussion
Discussion
P
a
per
|
Dis
cussion
P
a
per
|
Discussion
P
a
per
|
Discussio
n
P
a
per
|
Silva, N., Rojas, N., and Fedele, A.: Water masses in the Humboldt Current System: Properties, distribution, and the nitrate deficit as a chemical water mass tracer for Equatorial Subsurface Water offChile, Deep Sea Res. PtII, 56, 1004–1020, 2009.
Stramma, L., Peterson, R. G., and Tomczak, M.: The South Pacific Current, J. Phys. Oceanogr., 25, 77–91, 1995.
5
Stramma, L., Johnson, G. C., Sprintall, J., and Mohrholz, V.: Expanding oxygen-minimum zones in the Tropical Oceans, Science, 320, 655–658, 2008.
Stramma, L., Johnson, G. C., Firing, E., and Schmidtko, S.: Eastern Pacific oxygen min-imum zones: supply paths and multidecadal changes, J. Geophys. Res., 115, C09011, doi:10.1029/2009JC005976, 2010a.
10
Stramma, L., Schmidtko, S., Levin, L. A., and Johnson, G. C.: Ocean oxygen minima expan-sions and their biological impacts, Deep Sea Res. Pt. I, 57, 587–595, 2010b.
Stramma, L., Prince, E. D., Schmidtko, S., Luo, J., Hoolihan, J. P., Visbeck, M., Wallace, D. W. R., Brandt, P., and Kortzinger, A.: Expansion of oxygen minimum zones may reduce available habitat for tropical pelagic fishes, Nature Clim. Change, 2, 33–37, 2012.
15
Strub, P., Mesias, J., Montecino, V., Rutllant, J., and Salinas, S.: Coastal ocean circulation off
western South America, in: The Sea: The global coastal ocean, edited by: Robinson, A. R. and Brink, K. H., Wiley, New York, 272–313, 1998.
Takeda, S.: Influence of iron availability on nutrient consumption ratio of diatoms in oceanic waters, Nature, 393, 774–777, 1998.
20
Thamdrup, B., Dalsgaard, T., Jensen, M. M., Ulloa, O., Far´ıas, L., and Escribano, R.: Anaerobic ammonium oxidation in the oxygen-deficient waters offnorthern Chile, Limnol. Oceanogr., 51, 2145–2156, 2006.
Tomczak, M. and Large, D. G. B.: Optimum multiparameter analysis of mixing in the thermocline of the Eastern Indian Ocean, J. Geophys. Res., 94, 16141–16149, 1989.
25
Tsuchiya, M. and Talley, L. D.: A Pacific hydrographic section at 88◦W: Water-property distribu-tion, J. Geophys. Res., 103, 12899–12918, 1998.
Vaquer-Sunyer, R. and Duarte, C. M.: Thresholds of hypoxia for marine biodiversity, P. Natl. Acad. Sci. USA,, 105, doi:10.1073/pnas.0803833105, 2008.
Watson, A. J. and Whitfield, M.: Composition of particles in the global ocean, Deep Sea Res. 30
Pt. A, 32, 1023–1039, 1985.
BGD
9, 17583–17618, 2012
Physical and biogeochemical forcing of oxygen
changes
P. J. Llanillo et al.
Title Page
Abstract Introduction
Conclusions References
Tables Figures
◭ ◮
◭ ◮
Back Close
Full Screen / Esc
Printer-friendly Version Interactive Discussion
Discussion
P
a
per
|
Dis
cussion
P
a
per
|
Discussion
P
a
per
|
Discussio
n
P
a
per
|
Table 1.Source water types used for the extended OMP analysis. The source water masses are Subtropical Water (STW), Subantarctic Water (SAAW), Equatorial Subsurface Water (ESSW), Antarctic Intermediate Water (AAIW) and Pacific Deep Water (PDW). The weights used for each parameter are included at the bottom row. The oxygen saturation concentrations based on the source water type temperature and salinity are given in the last column (based on Weiss, 1970).
Water Pot. Temp. Salinity Oxygen Phosphate Silicate Nitrate Mass Oxygen mass (◦
C) (µmol kg−1) (µmol kg−1) (µmol kg−1) (µmol kg−1) conservation saturation
BGD
9, 17583–17618, 2012
Physical and biogeochemical forcing of oxygen
changes
P. J. Llanillo et al.
Title Page
Abstract Introduction
Conclusions References
Tables Figures
◭ ◮
◭ ◮
Back Close
Full Screen / Esc
Printer-friendly Version Interactive Discussion
Discussion
P
a
per
|
Dis
cussion
P
a
per
|
Discussion
P
a
per
|
Discussio
n
P
a
per
|
µmol/kg
Fig. 1. Map of the study area with the track (black line) of the Meteor cruise M77 (Febru-ary 2009) and stations between 14◦
S and 1◦
BGD
9, 17583–17618, 2012
Physical and biogeochemical forcing of oxygen
changes
P. J. Llanillo et al.
Title Page
Abstract Introduction
Conclusions References
Tables Figures
◭ ◮
◭ ◮
Back Close
Full Screen / Esc
Printer-friendly Version Interactive Discussion
Discussion
P
a
per
|
Dis
cussion
P
a
per
|
Discussion
P
a
per
|
Discussio
n
P
a
per
|
Fig. 2a.Water mass distribution (%) at the 85◦ 50′
W section between 14◦
S and 1◦
BGD
9, 17583–17618, 2012
Physical and biogeochemical forcing of oxygen
changes
P. J. Llanillo et al.
Title Page
Abstract Introduction
Conclusions References
Tables Figures
◭ ◮
◭ ◮
Back Close
Full Screen / Esc
Printer-friendly Version Interactive Discussion
Discussion
P
a
per
|
Dis
cussion
P
a
per
|
Discussion
P
a
per
|
Discussio
n
P
a
per
|