Elevated Concentrations of Serum
Immunoglobulin Free Light Chains in
Systemic Lupus Erythematosus Patients in
Relation to Disease Activity, Inflammatory
Status, B Cell Activity and Epstein-Barr Virus
Antibodies
Anette H. Draborg1, Magnus C. Lydolph1, Marie Westergaard1, Severin Olesen Larsen1, Christoffer T. Nielsen1,2, Karen Duus1, Søren Jacobsen2, Gunnar Houen1*
1Department of Autoimmunology and Biomarkers, Statens Serum Institut, Copenhagen, Denmark, 2Department of Infectious Diseases and Rheumatology, Rigshospitalet, Copenhagen University Hospital, Copenhagen, Denmark
Abstract
Objective
In this study, we examined the concentration of serum immunoglobulin free light chains (FLCs) in systemic lupus erythematosus (SLE) patients and investigated its association with various disease parameters in order to evaluate the role of FLCs as a potential bio-marker in SLE. Furthermore, FLCs’association with Epstein-Barr virus (EBV) antibodies was examined.
Methods
Using a nephelometric assay,κFLC andλFLC concentrations were quantified in sera from 45 SLE patients and 40 healthy controls. SLE patients with renal insufficiency were excluded in order to preclude high concentrations of serum FLCs due to decreased clearance.
Results
Serum FLC concentrations were significantly elevated in SLE patients compared to healthy controls (p<0.0001) also after adjusting for Ig levels (p<0.0001). The concentration of serum FLCs correlated with a global disease activity (SLE disease activity index (SLEDAI)) score of the SLE patients (r = 0.399, p = 0.007). Furthermore, concentrations of FLCs correlated with titers of dsDNA antibodies (r = 0.383, p = 0.009), and FLC levels and SLEDAI scores correlated in the anti-dsDNA-positive SLE patients, but not in anti-dsDNA-negative SLE patients. Total immunoglobulin (IgG and IgA) concentrations correlated with FLC OPEN ACCESS
Citation:Draborg AH, Lydolph MC, Westergaard M, Olesen Larsen S, Nielsen CT, Duus K, et al. (2015) Elevated Concentrations of Serum Immunoglobulin Free Light Chains in Systemic Lupus Erythematosus Patients in Relation to Disease Activity, Inflammatory Status, B Cell Activity and Epstein-Barr Virus Antibodies. PLoS ONE 10(9): e0138753. doi:10.1371/ journal.pone.0138753
Editor:Shervin Assassi, University of Texas Health Science Center at Houston, UNITED STATES
Received:March 23, 2015
Accepted:August 9, 2015
Published:September 24, 2015
Copyright:© 2015 Draborg et al. This is an open access article distributed under the terms of the
Creative Commons Attribution License, which permits unrestricted use, distribution, and reproduction in any medium, provided the original author and source are credited.
Data Availability Statement:All relevant data are within the paper.
Funding:These authors have no support or funding to report.
concentrations and elevated FLC levels were additionally shown to associate with the inflammatory marker C-reactive protein and also with complement consumption determined by low C4 in SLE patients. Collectively, results indicated that elevated serum FLCs reflects increased B cell activity in relation to inflammation. SLE patients had an increased seroposi-tivity of EBV-directed antibodies that did not associate with elevated FLC concentrations. An explanation for this could be that serum FLC concentrations reflect the current EBV activity (reactivation) whereas EBV-directed antibodies reflect the extent of previous infec-tion/reactivations.
Conclusion
SLE patients have elevated concentrations of serum FLCs that correlate with global disease activity scores and especially serologic markers for active disease. These findings are sug-gestive of circulating FLCs having potential as a new supplementary serologic biomarker in SLE.
Introduction
Systemic lupus erythematosus (SLE) is an important autoimmune disease with a prevalence of 20–150 cases per 100.000 [1,2], and typically presents in women (90% of cases) in the repro-ductive age. The typical course of the disease is illustrated by periods of disease flares alternat-ing with remission. The etiology of SLE is believed to be multi-factorial with genetic and environmental factors, both contributing to the development of the disease [1,3–5].
B cell activation is central in the disease mechanism of SLE, as it is characterized by the pro-duction of autoantibodies against conserved cellular components including double-stranded DNA (dsDNA) (58–70% of SLE patients [3,6]), histones, Ro52, Ro60, La and Sm [4,6–8]. Fur-thermore, extensive polyclonal B cell hyperactivity is observed during active disease [9,10].
During antibody synthesis in plasma cells, up to 40% excess immunoglobulin (Ig) light chains are produced in proportion to Ig heavy chains. Free light chains (FLCs) are released to the circulation;κFLCs are released as either monomers or dimers andλFLCs are released as
dimers. The serum FLCs are rapidly catabolized by the kidneys with a half life in the circulation of 2–4 hours forκFLCs and 3–6 hours forλFLCs. The normal concentration of FLCs in serum
and urine is kept at low levels due to the kidneys massive capacity for clearing of serum FLCs (10–30 grams/day). Thus, in individuals with normal renal function, increased concentrations of serum FLCs are presumably a result of increased plasma cell activity [11–13]. However, some SLE patients suffer from glomerulonephritis and renal insufficiency and as a consequence these patients presumably have decreased clearance of FLCs and thereby an elevated concen-tration in the circulation.
Previous studies on FLC levels in SLE patients have revealed elevated levels of FLCs in both serum and urine in periods of active disease [12–17]. Three previous studies have demonstrated elevated concentrations of serum FLC using a quantitative nephelometric assay. Aggarwalet al. investigated FLC concentrations in serum from 74 SLE patients and showed significantly increased concentrations compared to healthy controls and also found a correlation between serum FLC levels and SLEDAI scores [14]. Jollyet al. quantified the concentrations of FLCs in serum from 77 SLE patients and observed a correlation betweenλFLC and both SLEDAI scores
of the variance in SLEDAI scores of SLE patients [16]. Chicheet al. found that 8 out of 11 SLE patients had elevated concentrations of serum FLC, but all had normalκ:λratios [15]. In
addi-tion, Hopperet al. applied a radioimmunoassay and found elevated FLC concentrations in urine of SLE patients during active disease [12,13].
Many studies have linked Epstein-Barr virus (EBV) infection to SLE [18–22]. EBV infection during childhood is asymptomatic, but infection in adolescence causes infectious mononucleo-sis in 30–70% of cases [23,24]. After primary infection, EBV persists in latent form within immortalized memory B cells [25–27]. Occasionally, EBV reactivates and switches to lytic cycle and thereby the infected memory B cells undergo differentiation into plasma cells, acti-vating viral and cellular promoters resulting in viral gene expression and viral genome replica-tion [28]. This gives rise to release of virus that can infect other B cells [27].
Nearly all SLE patients (99.5%) and a large proportion of healthy adults (94.5%) are infected with EBV [29]. Studies have shown an increased number of latently EBV-infected cells [18] and an abnormally high viral load in the peripheral blood mononuclear cells of SLE patients [19–21]. Also, an impaired EBV-specific T cell response is observed in SLE patients [19,30–32] and an increased serologic response has been demonstrated with high titers of antibodies to EBV antigens in SLE patients compared to healthy controls [29,33–45].
In this study, we substantiate previous results on serum FLC levels in SLE patients and show that elevated serum FLCs in SLE patients are associated with various serologic parameters and serve as a potential supplementary biomarker in SLE disease activity. Furthermore, we investi-gate if presence of serum FLCs associates with EBV antibodies in order to evaluate the role of EBV infection in the B cell hyperactivity in SLE patients.
Materials and Methods
Patients and controls
Serum samples were obtained from 45 unrelated Danish SLE patients attending the Depart-ment of Infectious Diseases and Rheumatology, Rigshospitalet, Copenhagen University Hospi-tal, Denmark. All patients fulfilled the American College of Rheumatology classification criteria in SLE [8]. Serum samples from 40 non-medicated healthy controls, were obtained from personnel at Statens Serum Institut, Copenhagen, Denmark.
SLE patients suffering from cancer were not included in the cohort.
Six of the 51 SLE patients were found to have low eGFR (estimated glomerular filtration rate) (<60 ml/min/1.73m2), indicating renal insufficiency and were excluded from the study.
eGFR was calculated from serum creatinine concentrations, age and gender of included patients, by the use of the following equation: eGFR (ml/min/1.73m2) = 175 x (creatinine (μmol/l)/88.4)-1.154x (age)-0.203x genderfactor (0.742 for women and 1 for men).
Ethics statement
Approval from the Scientific-Ethical Committee of the Capital Region of Denmark was obtained (H-A-2007-0114). All participating subjects provided informed consent. All SLE patients provided written consent and healthy controls were used anonymously and therefore no written consent was necessary.
Quantitative nephelometric assay
concentrations were measured by the use of N Latex FLC kappa and N Latex FLC lambda kit (Siemens Diagnostics, Marburg, Germany) according to the manufacturer’s instructions. Normal ranges were defined as: 5,7–26,3 mg/l (λFLC), 3,3–19,4 mg/l (κFLC), 0,26–1,65 (FLC κ:λratio) [46].
ELISA
EBV antibodies of all SLE patients and 20 of the 40 healthy controls, comprising antibodies to EBNA-1, EBV-VCA and EBV-EA/D, were previously measured by ELISA [33]. Furthermore, antibodies to EBNA-1, EBV-VCA and EBV-EA/D for the last 20 healthy controls were deter-mined in this study. Antibodies against EBNA-1 and EBV-VCA were detected using ELISA test kits (Demeditec Diagnostics, Kiel-Wellsee, Germany) according to the manufacturer’s instructions as previously described [33]. Antibodies against EBV-EA/D were quantified with a new assay compared to the previous assay [33]. The new assay differed from the previously uti-lized by the use of NUNC polysorp microtitre plates (Thermo Fisher Scientific, Roskilde, Den-mark) and in the serum samples used for the standard curve. However, comparison between the results should be valid as we only study antibody positive/negative samples and not anti-body titers.
Statistical analysis
Comparisons of concentrations of serum FLCs were performed using the unpaired nonpara-metric two-tailed Mann-Whitney test and considered significant at p-values less than 0.05. Data are presented with median values with statistical significant differences indicated with, orfor p-values less than 0.05, 0.01 or 0.001, respectively. Univariate correlation analyses
were performed using Spearman correlation test for nonparametric data sets. All of the above mentioned data analyses were carried out using GraphPad Prism Software 5 (GraphPad Soft-ware Inc, La Jolla, CA, USA).
Furthermore, a comparison of EBV antibody seropositivity between SLE patients and healthy controls and also the possible association between elevated FLC concentrations and EBV antibody seropositivity were calculated using chi-squared test (with Yates’correction) employing S-PLUS (Mathsoft, Inc, Seattle, WA, USA). These analyses were based on compari-son of absolute numbers of SLE/healthy controls positive for EBV antibodies and with elevated FLC concentrations (λFLC and/orκFLC concentration above the normal range). Values below
0.05 were considered statistically significant and p-values below 0.00005 is presented as ~0.
Results
Characteristics of SLE patients and healthy controls
Prevalence of serum FLCs in SLE patients and healthy controls
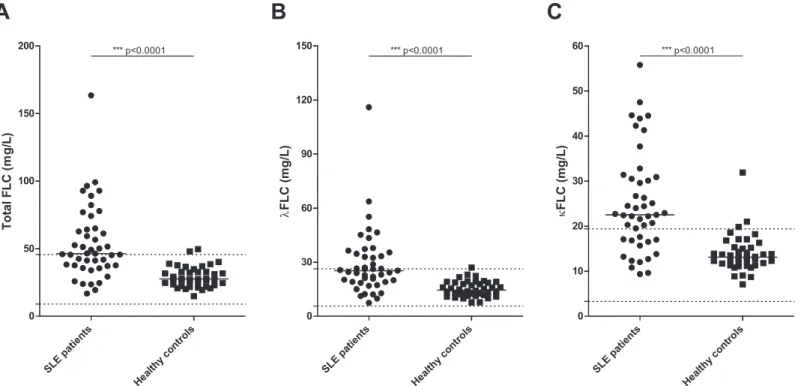
Sera from 45 SLE patients and 40 healthy controls were examined by quantitative nephelome-try for concentration ofκFLCs andλFLCs. As illustrated inFig 1A, a significantly elevated
concentration of total serum FLCs was found in SLE patients compared to healthy controls (p<0.0001). The median total FLC concentration was 46.4 mg/L in SLE patients compared to a
median level of 27.6 mg/L in healthy controls. Similar results were obtained when examining theλFLC andκFLC levels individually (Fig 1B and 1C), with significantly higher
concentra-tions in SLE patients compared to healthy controls (p<0.0001 in both cases). The median
value ofλFLCs was 25.3 mg/L in SLE patients and 14.5 mg/L in healthy controls, and the
median value was 22.5 mg/L and 13.1 mg/L ofκFLCs in SLE patients and healthy controls,
respectively.
Sixty nine percent (31 of 45) of examined SLE patients had an elevated level of serumκFLCs
above the normal range compared to 7.5% (3 of 40) of examined healthy controls. Similarly, 44% (20 of 45) of SLE patients compared to 2.5% (1 of 40) of healthy controls showedλFLC
levels above the normal range.
Four of the 40 included healthy controls were found positive for ANA and/or anti-dsDNA, but none of these healthy controls were found to have elevated concentrations of serum FLCs. A strong statistically significant difference in FLC concentrations was still observed between SLE patients and healthy controls after adjusting for total IgG, total IgA or total IgM concentra-tions, respectively (p<0.0001, regarding total FLC andλFLC andκFLC, individually, when
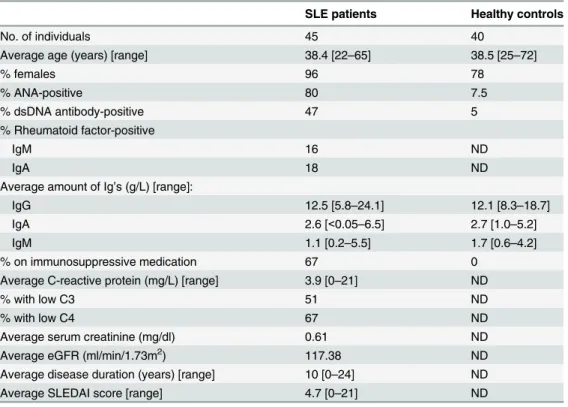
Table 1. Characteristics of SLE patients and healthy controls.
SLE patients Healthy controls
No. of individuals 45 40
Average age (years) [range] 38.4 [22–65] 38.5 [25–72]
% females 96 78
% ANA-positive 80 7.5
% dsDNA antibody-positive 47 5
% Rheumatoid factor-positive
IgM 16 ND
IgA 18 ND
Average amount of Ig’s (g/L) [range]:
IgG 12.5 [5.8–24.1] 12.1 [8.3–18.7]
IgA 2.6 [<0.05–6.5] 2.7 [1.0–5.2]
IgM 1.1 [0.2–5.5] 1.7 [0.6–4.2]
% on immunosuppressive medication 67 0
Average C-reactive protein (mg/L) [range] 3.9 [0–21] ND
% with low C3 51 ND
% with low C4 67 ND
Average serum creatinine (mg/dl) 0.61 ND
Average eGFR (ml/min/1.73m2) 117.38 ND
Average disease duration (years) [range] 10 [0–24] ND
Average SLEDAI score [range] 4.7 [0–21] ND
SLE—systemic lupus erythematosus, SLEDAI—SLE disease activity index, ANA- nuclear antibodies, dsDNA—double stranded DNA, Ig—immunoglobulin, eGFR—estimated glomerularfiltration rate, ND—not determined.
adjusting for either total IgG, total IgA or total IgM, respectively), which was also expected as serum Ig levels were found to be similar between the two groups (Table 1).
To ensure that the elevated amount of serum FLCs in SLE patients was not due to the pres-ence of a monoclonal (M) component, all serum samples were examined by serum protein electrophoresis and no M components was found in sera from SLE patients or from the healthy controls (results not shown). Furthermore, the ratio ofκ:λwas, for the majority of individuals
(All SLE patients and 38 of 40 healthy controls), within the normal range (results not shown), as expected in the absence of an M component.
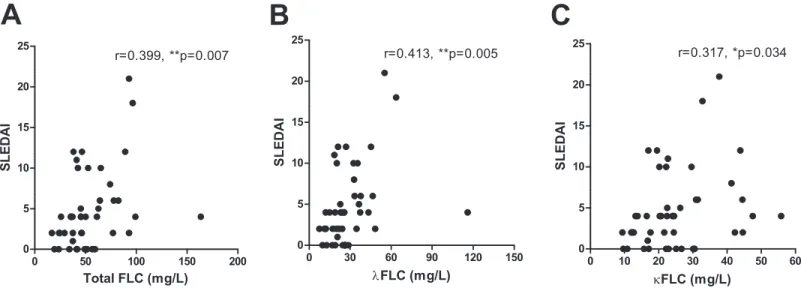
Correlation between serum FLC concentrations and global and clinical
disease activity scores of SLE patients
Total serum FLC concentrations correlated with global disease activity scores determined by the SLEDAI scores of the SLE patients (Fig 2A) with a calculated Spearman’s correlation coefficient (r) of 0.399 (p = 0.007). As illustrated inFig 2B and 2C, similar results were obtained for individual levels ofλFLC andκFLC (r-values at 0.413 (p = 0.005) and 0.317 (p = 0.034),
respectively).
Similar results were obtained after adjusting for renal function in several ways (determined by serum creatinine concentrations or eGFR, respectively) with statistically significant correlations, (except between eGFR-adjustedκFLC and SLEDAI scores) (r-values of 0.566
(p<0.0001), 0.564 (p<0.0001) and 0.476 (p = 0.0005) when correlating SLEDAI scores with
creatinine-adjusted concentrations of total FLC,λFLC andκFLC, respectively, and r-values of
0.320 (p = 0.022), 0.367 (p = 0.008) and 0.274 (p = 0.052) when correlating SLEDAI scores
Fig 1. Concentration of serum FLCs in SLE patients and healthy controls.Total FLC (A),λFLC (B) andκFLC (C) levels in SLE patients (n = 45) and healthy controls (n = 40) measured by quantitative nephelometry. SLE patients suffering from renal insufficiency (eGFR<60 ml/min/1.73m2) were excluded. Middle horizontal bars represent median and statistical significant differences are indicated with*,**or***for values less than 0.05, 0.01 or 0.001. p-values for comparison of FLC levels in SLE patients and healthy controls are<0.0001. Maximum and minimum values of the normal ranges ofλFLCs and κFLCs are indicated on the y-axis as dotted lines. FLCs—free light chains, SLE—systemic lupus erythematosus.
with eGFR-adjusted concentrations of total FLC,λFLC andκFLC, respectively) (results not
shown).
Clinical SLEDAI scores (cSLEDAI, i.e. SLEDAI score excluding anti-dsDNA, complement, thrombocyte and leukocyte levels) were found to correlate with total FLC concentrations and
λFLC concentrations of SLE patients (r = 0.358 (p = 0.016) and r = 0.330 (p = 0.027)), but not
withκFLC (r = 0.232, p = 0.126). However, only a tendency of higher cSLEDAI scores were
observed in SLE patients with elevated FLC levels (n = 31) compared to SLE patients with nor-mal FLC levels (n = 14) (p = 0.111) (results not shown).
In comparison with the latter, SLE patients positive for anti-dsDNA did not have elevated cSLEDAI scores compared to SLE patients negative for anti-dsDNA (p = 0.234). Also, no cor-relation was observed between anti-dsDNA titres and cSLEDAI scores (r = 0.247, p = 0.102) (however, 12 SLE patients had a titer of>200 U/ml making the correlation test inconclusive).
Similarly, SLE patients with complement consumption (low C3 or low C4) did not have higher cSLEDAI scores than SLE patients with normal complement levels (p = 0.201 and p = 0.688, regarding C3 and C4, respectively), and cSLEDAI and C-reactive protein (CRP) did not corre-late (r = -0.050, p = 0.742) (results not shown).
Serum FLC concentrations in relation to autoantibodies in SLE patients
Concentrations of total FLC,λFLC andκFLC correlated with titer values of anti-dsDNA in the
SLE patients (r values of 0.383 (p = 0.009), 0.369 (p = 0.013) and 0.401 (p = 0.006), respectively) (Fig 3), even though 12 of 45 SLE patients had a titer of>200 U/ml making the test inexact.
However, no difference in FLC concentrations were observed when stratifying SLE patients by seropositivity of dsDNA antibodies. A statistically significant positive correlation was obtained between FLC levels and SLEDAI scores for dsDNA antibody-positive SLE patients (n = 21) (SLEDAI range: 0–21, median: 5) (Fig 4A) (r-values of 0.498 (p = 0.022), 0.555 (p = 0.009) and 0.458 (p = 0.037), regarding concentrations of total FLC,λFLC andκFLC, respectively).
Con-versely, this correlation was not achieved between FLC concentrations and SLEDAI scores for dsDNA antibody-negative SLE patients (n = 24) (SLEDAI range: 0–12, median: 2) (Fig 4B)
Fig 2. Correlation between serum FLC concentrations and SLEDAI scores of SLE patients.Correlation between SLEDAI scores and total FLC (A), λFLC (B) andκFLC (C) levels in SLE patients (n = 45). r-values are 0.399 (p = 0.007), 0.413 (p = 0.005) and 0.317 (p = 0.034) in A, B and C, respectively. FLCs—free light chains, SLE—systemic lupus erythematosus, SLEDAI—SLE disease activity index.
(r-values of 0.105 (p = 0.626), 0.159 (p = 0.458) and -0.030 (p = 0.888), regarding concentra-tions of total FLC,λFLC andκFLC, respectively).
No associations were observed between rheumatoid factor (RF) IgA or RF IgM and serum FLC concentrations when stratifying SLE patients according to RF seropositivity (results not shown). However, the group of seropositive SLE patients with RF IgA and/or RF IgM was very small (n = 8 and n = 7, respectively) (Table 1) making conclusions unreliable.
Serum FLC concentrations in relation to immunological and
hematological markers
A positive correlation was observed between serum FLC levels and total IgG concentration, total IgA concentration, but not total IgM concentrations in SLE patients (Fig 5A) (r-values of 0.345 (p = 0.021), 0.499 (p = 0.0005) and -0.127 (p = 0.406), respectively). Similar results were obtained for the healthy controls (Fig 5B) with a positive correlation between serum FLC levels and total IgA concentrations and a tendency of a positive correlation to total IgG concentra-tions (r-values of 0.301 (p = 0.059), 0.377 (p = 0.016) and -0.268 (p = 0.094), regarding total IgG, IgA and IgM, respectively).
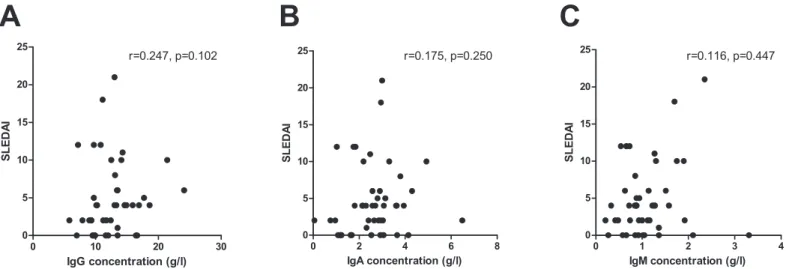
As illustrated inFig 6, no correlation was found between SLEDAI scores of the SLE patients and total IgG, total IgA or total IgM concentrations, respectively (r-values of 0.247 (p = 0.102), 0.175 (p = 0.250) and 0.116 (p = 0.447), respectively). Similar results were observed when strat-ifying SLE patients according to their seropositivity of dsDNA antibodies (results not shown).
When comparing FLC concentrations of SLE patients with low levels (n = 23, and n = 30, respectively) and SLE patients with normal levels (n = 22, and n = 15, respectively) of the com-plement factors C3 and C4, respectively, an association was demonstrated between C4 comple-ment consumption and elevated concentrations of serum FLCs (Fig 7) (p = 0.073 and p = 0.030 regarding C3 and C4 concentrations, respectively).
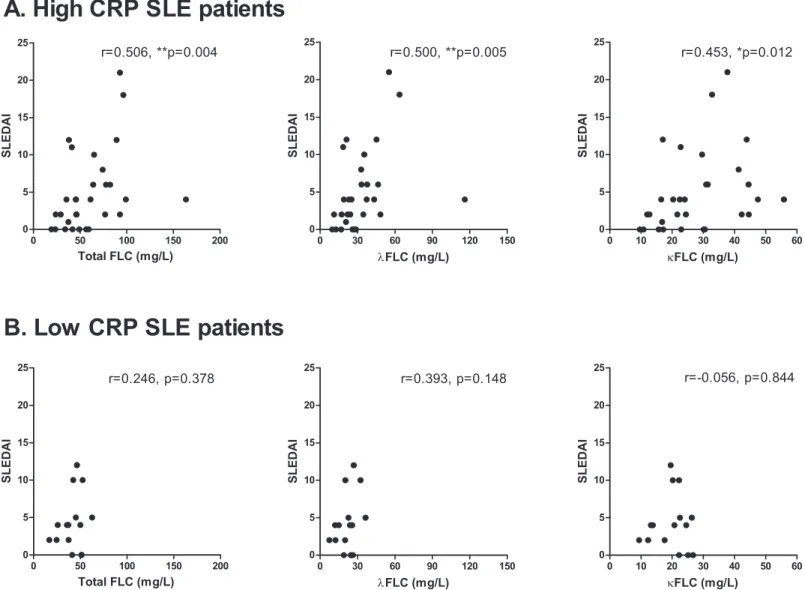
SLE patients stratified according to their concentrations of CRP showed that SLE patients with high CRP (>1 mg/l)(n = 30) had significantly higher serumλFLC concentrations
com-pared to the SLE patients with low CRP (<1 mg/l) (n = 15) (p = 0.057, p = 0.050 and p = 0.059,
regarding concentrations of total FLC,λFLC andκFLC, respectively) (results not shown). A
positive correlation was obtained between FLC concentrations and SLEDAI scores for high
Fig 3. Correlation between serum FLC concentrations and anti-dsDNA titer.Correlation between anti-dsDNA titer (U/ml) and total FLC (A),λFLC (B) andκFLC (C) levels in SLE patients (n = 45). r-values are 0.383 (p = 0.009), 0.369 (p = 0.013) and 0.401 (p = 0.006) in A, B and C, respectively. FLCs—free light chains, SLE—systemic lupus erythematosus, dsDNA—double stranded DNA.
CRP SLE patients (SLEDAI range: 0–21, median: 4) (Fig 8A) (r-values of 0.506 (p = 0.004), 0.500 (p = 0.005) and 0.453 (p = 0.012), regarding concentrations of total FLC,λFLC and κFLC, respectively), but not between FLC concentrations and SLEDAI scores for low CRP SLE
patients (SLEDAI range: 0–12, median: 4) (Fig 8B) (r-values of 0.246 (p = 0.378), 0.393 (p = 0.148) and -0.056 (p = 0.844), regarding concentrations of total FLC,λFLC andκFLC,
respectively).
No correlations were found between FLC concentrations and neither lymphocyte, leuko-cyte, nor thrombocyte levels (results not shown).
Fig 4. Correlation between serum FLC concentrations and SLEDAI scores in anti-dsDNA positive SLE patients.Correlation between SLEDAI scores and total FLC,λFLC andκFLC levels in anti-dsDNA positive SLE patients (A) (n = 21) and in anti-dsDNA negative SLE patients (B) (n = 24).A: Anti-dsDNA positive SLE patients. r-values are 0.498 (p = 0.022), 0.555 (p = 0.009) and 0.458 (p = 0.037) regarding total FLC,λFLC andκFLC levels, respectively.B: Anti-dsDNA negative SLE patients. r-values are 0.105 (p = 0.626), 0.159 (p = 0.458) and 0.030 (p = 0.888) regarding total FLC,λFLC andκFLC levels, respectively. FLCs—free light chains, SLE—systemic lupus erythematosus, SLEDAI—SLE disease activity index.
Serum FLC concentrations and EBV antibodies
EBV antibodies of 45 SLE patients and 40 healthy controls, comprising antibodies against EBNA-1, EBV-VCA and EBV-EA/D were determined by ELISA. Percentages of SLE patients and healthy controls seropositive for these antibodies are listed inTable 2. When comparing absolute numbers of SLE patients and healthy controls seropositive for the various EBV anti-bodies results showed statistically significant differences between SLE patients and healthy con-trols regarding EBV-VCA IgA (p = 0.003), EBV-VCA IgM (p = 0.0007), EBV-EA/D IgG (p = 0.0001), EBV-EA/D IgA (p = ~0) and EBV-EA/D IgM (p = 0.0001) (Table 2).
Fig 5. Correlation between serum FLC concentrations and total immunoglobulin levels.Correlation between total immunoglobulin levels and total FLC,λFLC andκFLC levels in SLE patients (A) (n = 45) and healthy controls (B) (n = 40)A: SLE patients. r-values are 0.345 (p = 0.021), 0.499 (p = 0.0005) and -0.127 (p = 0.406) regarding total FLC,λFLC andκFLC levels, respectively.B: Healthy controls. r-values are 0.301 (p = 0.059), 0.377 (p = 0.016) and -0.268 (p = 0.094) regarding total FLC,λFLC andκFLC levels, respectively. FLCs—free light chains, SLE—systemic lupus erythematosus.
The relationship between elevated concentrations of serum FLC and EBV antibodies was examined demonstrating no significant associations.
Furthermore, no association was found between SLE patients/healthy controls and previous EBV infection (measured by VCA IgG), which was also expected as the majority of individuals (both SLE patients and healthy controls) included were found to have positive EBV serology.
Discussion
In this study, the concentration of serum FLCs in SLE patients was quantified by nephelometry and the association with clinical parameters and EBV antibodies was investigated. The results showed significantly elevated levels of serum FLC in SLE patients that were associated with global disease activity scores, inflammatory status and B cell activity.
Elevated concentrations of FLC have previously been observed in both serum and urine from SLE patients [12–17] and in a number of other autoimmune diseases [14,47–49]. In this study, we confirm these previous reports showing statistically significant elevated concentra-tions of serum FLCs in SLE patients.
We observed that bothκFLC andλFLC concentrations were elevated in sera from SLE
patients compared to healthy controls with 69% compared to 7.5% having an elevated amount ofκFLCs, and 44% compared to 2.5% having an elevated level ofλFLCs. SLE patients with
indications of renal insufficiency (eGFR<60 ml/min/1.73m2) were excluded from the study
and the elevated concentrations of serum FLCs demonstrated were therefore not a result of decreased clearance. Theκ:λratios were in this study found to be normal in the majority of
individuals, indicating a polyclonal rather than a monoclonal B cell activation, also confirmed by the lack of detectable M components.
It would be expected that a very limited number of individuals in the healthy control group would have concentrations of FLCs above the normal range. 7.5% and 2.5% of healthy controls were found to have elevated levels ofκFLC andλFLC, respectively. A larger percentage of the
healthy controls included are men compared to the SLE patient cohort. However, when com-paring FLC concentrations between the men and the women in the healthy control group, no significant difference was observed (results not shown). Hence, the difference in FLC
Fig 6. No correlation between SLEDAI scores and total immunoglobulin concentrations in SLE patients.No correlation between SLEDAI scores and total IgG, IgA and IgM in SLE patients (n = 45) with r-values of 0.247 (p = 0.102), 0.175 (p = 0.250) and 0.116 (p = 0.316) regarding total IgG, IgA and IgM, respectively. SLEDAI—systemic lupus erythematosus disease activity index.
concentrations observed between SLE patients and healthy controls is not a result of gender differences in the cohorts.
The high level of serum FLCs in SLE patients may be interpreted as reflecting an increased Ig synthesis in the B cells of the SLE patients but the elevated serum FLC levels were accompa-nied by normal levels of Igs (Table 1). Furthermore, a strong significant difference between SLE patients and healthy controls were still observed after adjusting FLC levels for total Ig con-centrations, indicating that the elevated FLC concentrations demonstrated in SLE patients does not reflect an altered Ig production. Also, FLCs are measured in much lower concentration (mg/l) and have a short half life in the circulation (2–6 hours) [11–13] compared to Igs which are quantified in g/l and have a half life in the circulation of 5–25 days according to isotype [11], making small changes in the Ig synthesis hard to measure. Thus, FLC concentrations are possibly a better measure of the current B cell activity and Ig production status than total Ig measurements. Furthermore, previous studies by Hopperet al. have shown that secretion of Igs and FLCs may be independent processes by demonstrating that B cells are able to increase
Fig 7. Concentrations of serum FLCs in SLE patients with low and normal levels of complement factors.Total FLC levels in SLE patients with low (n = 23)/normal (n = 22) C3 levels (A) (p = 0.073) and in SLE patients with low (n = 30)/normal (n = 15) C4 levels (B) (p = 0.030). Middle horizontal bars represent median and statistical significant differences are indicated with*,**or***for p-values less than 0.05, 0.01 or 0.001. FLCs—free light chains, SLE —systemic lupus erythematosus.
Fig 8. Correlation between serum FLC concentrations and SLEDAI scores in SLE patients with high CRP.Correlation between SLEDAI scores and total FLC,λFLC andκFLC levels in high CRP SLE patients (A) (n = 30) and in low CRP SLE patients (B) (n = 15).A: High CRP SLE patients. r-values are 0.506 (p = 0.004), 0.500 (p = 0.005) and 0.453 (p = 0.012) regarding total FLC,λFLC andκFLC levels, respectively.B: Low CRP SLE patients. r-values are 0.246 (p = 0.378), 0.393 (p = 0.148) and -0.056 (p = 0.844) regarding total FLC,λFLC andκFLC levels, respectively. FLCs—free light chains, SLE—systemic lupus erythematosus, SLEDAI—SLE disease activity index, CRP—C-reactive protein.
doi:10.1371/journal.pone.0138753.g008
Table 2. EBV antibodies in SLE patients and healthy controls (%).
EBNA-1 EBV-VCA EBV-EA/D
IgG IgA IgM IgG IgA IgM IgG IgA IgM
SLE patients (n = 45) 82 0 0 100 18 16 62 58 67
Healthy controls (n = 40) 75 0 2.5 82.5 5 5 18 13 23
p-values for comparison NS NS NS NS 0.003 0.0007 0.0001 ~0 0.0001
EBV—Epstein-Barr virus, SLE—systemic lupus erythematosus, EBNA-1–EBV nuclear antigen 1, EBV-VCA—EBV viral capsid antigen, EBV-EA/D—EBV early antigen diffuse, NS—not significant.
their secretion of FLCs independently of their antibody production, which support the current results [50].
The elevated serum FLCs were observed to correlate with a global disease activity score (SLEDAI) (also when adjusting FLC concentrations for renal function), and also with dsDNA antibody titers and with total IgG and total IgA concentrations confirming a strong connection between SLE disease activity and plasma cell productivity. This was further corroborated by the fact that FLC levels did not correlate with SLEDAI scores in dsDNA antibody-negative SLE patients.
Yet, SLEDAI scores of the SLE patients did not correlate with total serum Ig concentrations. These results demonstrate that serum FLC concentrations are a better indication of disease activity of SLE patients than total Ig measurements, which suggest that FLC levels might have a prospect for being an additional serologic biomarker in the clinical management of SLE patients without renal dysfunction, as also suggested by Aggarwalet al[15] and Jollyet al[16]. The potential of serum FLCs will need further investigations in larger SLE cohorts and in other patient groups in order to examine the specificity in relation to other inflammatory diseases. Longitudinal studies would additionally reveal if FLC concentrations could possibly also func-tion as a biomarker for predicting future SLE disease activity flares and if the serum FLC analy-sis is more sensitive than measurements of complement factors and anti-dsDNA.
Serum FLC concentrations associated with the inflammatory status of the SLE patients. SLE patients with high CRP had elevated concentrations ofλFLC in serum and furthermore, a
posi-tive correlation was obtained between FLC concentrations and SLEDAI scores of these high CRP SLE patients, but not of low CRP SLE patients. In addition, serum FLC concentrations associated with low levels of C4. Thus, elevated serum FLCs and increased disease activity reflected inflammation and complement consumption.
No link was found between cSLEDAI scores of the SLE patients and neither serum FLC levels (yetλFLC concentrations correlated with cSLEDAI scores), anti-dsDNA, complement
consumption or CRP, indicating that none of these serological markers relate to the clinical manifestations of SLE in this cohort. However, as serum FLCs associate with the both anti-dsDNA titer, low complement and CRP, a connection to the serologic indications for active disease of SLE patients is suggested.
SLE has been linked to EBV and numerous research groups have demonstrated that SLE patients have an abnormal high viral load, indicating difficulties with controlling the latent EBV infection [18–21]. It could be speculated that the observed B cell activity or hyperactivity might be associated with an active EBV infection as latently infected memory B cells undergo differentiation into antibody (IgG and IgA)-secreting plasma cells during reactivation [51]. In agreement with this, FLC concentrations correlated with total IgG and total IgA, but not with total IgM concentrations in SLE patients, and with total IgA and a tendency for total IgG but not for IgM in healthy controls. The demonstrated increased seropositivity of EBV-directed antibodies in SLE patients did not associate with the elevated FLC concentrations. An explana-tion for this could be that serum FLC concentraexplana-tions reflect the current EBV activity (reactiva-tion) whereas EBV-directed antibodies reflect the extent of previous infection/reactivations. Concurrent measurements of EBV viral load in PBMCs (peripheral blood mononuclear cells) and serum FLC concentrations in longitudinal samples from SLE patients could clarify this hypothesis.
In conclusion, serum FLC concentrations were elevated in SLE patients, especiallyκFLC
quantified FLC concentrations in the circulation could be a supplementary serologic biomarker in SLE.
Acknowledgments
Esin Güven and Dorthe Olsen are thanked for collecting healthy control blood samples. Esin Güven is further thanked for technical assistance with measurements of EBNA-1 and EBV-EA/D antibodies. Lars Ankerstjerne Sørensen is thanked for technical assistance with measure-ments of Igs and M component. Institutional affiliation is Department of Autoimmunology and Biomarkers, Statens Serum Institut, Copenhagen, Denmark.
Author Contributions
Conceived and designed the experiments: AHD MCL KD GH CTN SJ. Performed the experi-ments: AHD MW. Analyzed the data: AHD MW SOL KD GH. Contributed reagents/materi-als/analysis tools: MCL CTN SJ GH. Wrote the paper: AHD MCL CTN SJ KD GH.
References
1. Pons-Estel GJ, Alarcon GS, Scofield L, Reinlib L, Cooper GS (2010) Understanding the epidemiology and progression of systemic lupus erythematosus. Semin Arthritis Rheum 39: 257–268. S0049-0172 (08)00197-2 [pii]; PMID:19136143
2. Chakravarty EF, Bush TM, Manzi S, Clarke AE, Ward MM (2007) Prevalence of adult systemic lupus erythematosus in California and Pennsylvania in 2000: estimates obtained using hospitalization data. Arthritis Rheum 56: 2092–2094. doi:10.1002/art.22641PMID:17530651
3. Rahman A, Isenberg DA (2008) Systemic lupus erythematosus. N Engl J Med 358: 929–939. 358/9/ 929 [pii]; doi:10.1056/NEJMra071297PMID:18305268
4. Smith PP, Gordon C (2010) Systemic lupus erythematosus: clinical presentations. Autoimmun Rev 10: 43–45. S1568-9972(10)00184-9 [pii]; doi:10.1016/j.autrev.2010.08.016PMID:20850569
5. Dall'era M, Chakravarty EF (2011) Treatment of mild, moderate, and severe lupus erythematosus: focus on new therapies. Curr Rheumatol Rep 13: 308–316. doi:10.1007/s11926-011-0186-6PMID:
21584692
6. Namjou B, Kilpatrick J, Harley JB (2007) Genetics of clinical expression in SLE. Autoimmunity 40: 602–612. 788414977 [pii]; doi:10.1080/08916930701510962PMID:18075794
7. von Muhlen CA, Tan EM (1995) Autoantibodies in the diagnosis of systemic rheumatic diseases. Semin Arthritis Rheum 24: 323–358. S0049-0172(95)80004-2 [pii]. PMID:7604300
8. Hochberg MC (1997) Updating the American College of Rheumatology revised criteria for the classifi-cation of systemic lupus erythematosus. Arthritis Rheum 40: 1725.
9. Sakane T, Suzuki N, Takada S, Ueda Y, Murakawa Y, Tsuchida T et al. (1988) B cell hyperactivity and its relation to distinct clinical features and the degree of disease activity in patients with systemic lupus erythematosus. Arthritis Rheum 31: 80–87. PMID:3257876
10. Fauci AS, Moutsopoulos HM (1981) Polyclonally triggered B cells in the peripheral blood and bone mar-row of normal individuals and in patients with systemic lupus erythematosus and primary Sjogren's syn-drome. Arthritis Rheum 24: 577–583. PMID:6971105
11. Nakano T, Matsui M, Inoue I, Awata T, Katayama S, Murakoshi T (2011) Free immunoglobulin light chain: its biology and implications in diseases. Clin Chim Acta 412: 843–849. S0009-8981(11)00136-7 [pii]; doi:10.1016/j.cca.2011.03.007PMID:21396928
12. Hopper JE, Sequeira W, Martellotto J, Papagiannes E, Perna L, Skosey JL (1989) Clinical relapse in systemic lupus erythematosus: correlation with antecedent elevation of urinary free light-chain immuno-globulin. J Clin Immunol 9: 338–350. PMID:2504765
13. Hopper JE, Golbus J, Meyer C, Ferrer GA (2000) Urine free light chains in SLE: clonal markers of B-cell activity and potential link to in vivo secreted Ig. J Clin Immunol 20: 123–137. PMID:10821464
14. Aggarwal R, Sequeira W, Kokebie R, Mikolaitis RA, Fogg L, Finnegan A et al. (2011) Serum free light chains as biomarkers for systemic lupus erythematosus disease activity. Arthritis Care Res (Hoboken) 63: 891–898. doi:10.1002/acr.20446
correlation with biological disease activity. Clin Rheumatol 30: 685–689. doi: 10.1007/s10067-010-1674-1PMID:21221683
16. Jolly M, Francis S, Aggarwal R, Mikolaitis R, Niewold T, Chubinskaya S et al. (2014) Serum free light chains, interferon-alpha, and interleukins in systemic lupus erythematosus. Lupus 23: 881–888. 0961203314530793 [pii]; doi:10.1177/0961203314530793PMID:24786785
17. Mastroianni-Kirsztajn G, Nishida SK, Pereira AB (2008) Are urinary levels of free light chains of immu-noglobulins useful markers for differentiating between systemic lupus erythematosus and infection? Nephron Clin Pract 110: c258–c263. 000167874 [pii]; doi:10.1159/000167874PMID:18974658
18. Gross AJ, Hochberg D, Rand WM, Thorley-Lawson DA (2005) EBV and systemic lupus erythematosus: a new perspective. J Immunol 174: 6599–6607. 174/11/6599 [pii]. PMID:15905498
19. Kang I, Quan T, Nolasco H, Park SH, Hong MS, Crouch J et al. (2004) Defective control of latent Epstein-Barr virus infection in systemic lupus erythematosus. J Immunol 172: 1287–1294. PMID:
14707107
20. Moon UY, Park SJ, Oh ST, Kim WU, Park SH, Lee SH et al. (2004) Patients with systemic lupus erythe-matosus have abnormally elevated Epstein-Barr virus load in blood. Arthritis Res Ther 6: R295–R302. [pii]. PMID:15225364
21. Yu SF, Wu HC, Tsai WC, Yen JH, Chiang W, Yuo CY et al. (2005) Detecting Epstein-Barr virus DNA from peripheral blood mononuclear cells in adult patients with systemic lupus erythematosus in Taiwan. Med Microbiol Immunol 194: 115–120. doi:10.1007/s00430-004-0230-5PMID:15378356
22. McClain MT, Heinlen LD, Dennis GJ, Roebuck J, Harley JB, James JA (2005) Early events in lupus humoral autoimmunity suggest initiation through molecular mimicry. Nat Med 11: 85–89. nm1167 [pii]; doi:10.1038/nm1167PMID:15619631
23. Auwaerter PG (1999) Infectious mononucleosis in middle age. JAMA 281: 454–459. jgh80003 [pii]. PMID:9952206
24. Tattevin P, Le TY, Minjolle S, Person A, Chapplain JM, Arvieux C et al. (2006) Increasing incidence of severe Epstein-Barr virus-related infectious mononucleosis: surveillance study. J Clin Microbiol 44: 1873–1874. 44/5/1873 [pii]; doi:10.1128/JCM.44.5.1873-1874.2006PMID:16672427
25. Joseph AM, Babcock GJ, Thorley-Lawson DA (2000) Cells expressing the Epstein-Barr virus growth program are present in and restricted to the naive B-cell subset of healthy tonsils. J Virol 74: 9964– 9971. PMID:11024124
26. Babcock GJ, Hochberg D, Thorley-Lawson AD (2000) The expression pattern of Epstein-Barr virus latent genes in vivo is dependent upon the differentiation stage of the infected B cell. Immunity 13: 497–506. S1074-7613(00)00049-2 [pii]. PMID:11070168
27. Thorley-Lawson DA (2001) Epstein-Barr virus: exploiting the immune system. Nat Rev Immunol 1: 75– 82. PMID:11905817
28. Schepers A, Pich D, Hammerschmidt W (1996) Activation of oriLyt, the lytic origin of DNA replication of Epstein-Barr virus, by BZLF1. Virology 220: 367–376. S0042-6822(96)90325-6 [pii]; doi:10.1006/viro. 1996.0325PMID:8661388
29. James JA, Neas BR, Moser KL, Hall T, Bruner GR, Sestak AL et al. (2001) Systemic lupus erythemato-sus in adults is associated with previous Epstein-Barr virus exposure. Arthritis Rheum 44: 1122–1126. doi:10.1002/1529-0131(200105)44:5<1122::AID-ANR193>3.0.CO;2-DPMID:11352244
30. Berner BR, Tary-Lehmann M, Yonkers NL, Askari AD, Lehmann PV, Anthony DD (2005) Phenotypic and functional analysis of EBV-specific memory CD8 cells in SLE. Cell Immunol 235: 29–38. S0008-8749(05)00104-8 [pii]; doi:10.1016/j.cellimm.2005.06.010PMID:16181618
31. Tsokos GC, Magrath IT, Balow JE (1983) Epstein-Barr virus induces normal B cell responses but defective suppressor T cell responses in patients with systemic lupus erythematosus. J Immunol 131: 1797–1801. PMID:6311898
32. Draborg AH, Jacobsen S, Westergaard M, Mortensen S, Larsen JL, Houen G et al. (2014) Reduced response to Epstein-Barr virus antigens by T-cells in systemic lupus erythematosus patients. Lupus Sci Med 1: e000015. lupus-2014-000015 [pii]. PMID:25396062
33. Draborg A, Jorgensen J, Muller H, Nielsen C, Jacobsen S, Iversen L et al. (2012) Epstein-Barr virus early antigen diffuse (EBV-EA/D)-directed immunoglobulin A antibodies in systemic lupus erythemato-sus patients. Scand J Rheumatol 41: 280–289. doi:10.3109/03009742.2012.665944PMID:22646970
34. James JA, Kaufman KM, Farris AD, Taylor-Albert E, Lehman TJ, Harley JB (1997) An increased preva-lence of Epstein-Barr virus infection in young patients suggests a possible etiology for systemic lupus erythematosus. J Clin Invest 100: 3019–3026. doi:10.1172/JCI119856PMID:9399948
36. Chen CJ, Lin KH, Lin SC, Tsai WC, Yen JH, Chang SJ et al. (2005) High prevalence of immunoglobulin A antibody against Epstein-Barr virus capsid antigen in adult patients with lupus with disease flare: case control studies. J Rheumatol 32: 44–47. 0315162X-32-44 [pii]. PMID:15630723
37. Chen DY, Chen YM, Lan JL, Chen HH, Hsieh CW, Wey SJ et al. (2010) Polymyositis/dermatomyositis and nasopharyngeal carcinoma: the Epstein-Barr virus connection? J Clin Virol 49: 290–295. S1386-6532(10)00357-4 [pii]; doi:10.1016/j.jcv.2010.08.015PMID:20934910
38. Lu JJ, Chen DY, Hsieh CW, Lan JL, Lin FJ, Lin SH (2007) Association of Epstein-Barr virus infection with systemic lupus erythematosus in Taiwan. Lupus 16: 168–175. PMID:17432101
39. Parks CG, Cooper GS, Hudson LL, Dooley MA, Treadwell EL, St Clair EW et al. (2005) Association of Epstein-Barr virus with systemic lupus erythematosus: effect modification by race, age, and cytotoxic T lymphocyte-associated antigen 4 genotype. Arthritis Rheum 52: 1148–1159. doi:10.1002/art.20997
PMID:15818712
40. Berkun Y, Zandman-Goddard G, Barzilai O, Boaz M, Sherer Y, Larida B et al. (2009) Infectious antibod-ies in systemic lupus erythematosus patients. Lupus 18: 1129–1135. 18/13/1129 [pii]; doi:10.1177/ 0961203309345729PMID:19880558
41. Esen BA, Yilmaz G, Uzun S, Ozdamar M, Aksozek A, Kamali S et al. (2010) Serologic response to Epstein-Barr virus antigens in patients with systemic lupus erythematosus: a controlled study. Rheuma-tol Int. doi:10.1007/s00296-010-1573-4
42. Huggins ML, Todd I, Powell RJ (2005) Reactivation of Epstein-Barr virus in patients with systemic lupus erythematosus. Rheumatol Int 25: 183–187. doi:10.1007/s00296-003-0420-2PMID:14666378
43. Stratta P, Canavese C, Ciccone G, Santi S, Quaglia M, Ghisetti V et al. (1999) Correlation between cytomegalovirus infection and Raynaud's phenomenon in lupus nephritis. Nephron 82: 145–154. 45391 [pii]. PMID:10364707
44. Zandman-Goddard G, Berkun Y, Barzilai O, Boaz M, Blank M, Ram M et al. (2009) Exposure to Epstein-Barr virus infection is associated with mild systemic lupus erythematosus disease. Ann N Y Acad Sci 1173: 658–663. NYAS4754 [pii]; doi:10.1111/j.1749-6632.2009.04754.xPMID:19758212
45. Csuka D, Simon D, Hobor R, Uray K, Prohaszka Z, Banlaki Z et al. (2013) Serum concentration of immunoglobulin G-type antibodies against the whole Epstein-Barr nuclear antigen 1 and its aa35-58 or aa398-404 fragments in the sera of patients with systemic lupus erythematosus and multiple sclerosis. Clin Exp Immunol 171: 255–262. doi:10.1111/cei.12022PMID:23379431
46. Katzmann JA, Clark RJ, Abraham RS, Bryant S, Lymp JF, Bradwell AR et al. (2002) Serum reference intervals and diagnostic ranges for free kappa and free lambda immunoglobulin light chains: relative sensitivity for detection of monoclonal light chains. Clin Chem 48: 1437–1444. PMID:12194920
47. Gottenberg JE, Aucouturier F, Goetz J, Sordet C, Jahn I, Busson M et al. (2007) Serum immunoglobulin free light chain assessment in rheumatoid arthritis and primary Sjogren's syndrome. Ann Rheum Dis 66: 23–27. ard.2006.052159 [pii]; doi:10.1136/ard.2006.052159PMID:16569685
48. Kaplan B, Aizenbud BM, Golderman S, Yaskariev R, Sela BA (2010) Free light chain monomers in the diagnosis of multiple sclerosis. J Neuroimmunol 229: 263–271. S0165-5728(10)00410-8 [pii]; doi:10. 1016/j.jneuroim.2010.09.002PMID:20870296
49. Presslauer S, Milosavljevic D, Brucke T, Bayer P, Hubl W (2008) Elevated levels of kappa free light chains in CSF support the diagnosis of multiple sclerosis. J Neurol 255: 1508–1514. doi:10.1007/ s00415-008-0954-zPMID:18685917
50. Hopper JE, Papagiannes E (1986) Evidence by radioimmunoassay that mitogen-activated human blood mononuclear cells secrete significant amounts of light chain Ig unassociated with heavy chain. Cell Immunol 101: 122–131. PMID:3091263
51. Thorley-Lawson DA, Gross A (2004) Persistence of the Epstein-Barr virus and the origins of associated lymphomas. N Engl J Med 350: 1328–1337. doi:10.1056/NEJMra032015; 350/13/1328 [pii]. PMID: