ESDD
5, 809–848, 2014Temporal variations in atmospheric CO2
on Rishiri Island in 2006–2013
C. Zhu and H. Yoshikawa-Inoue
Title Page
Abstract Introduction
Conclusions References
Tables Figures
◭ ◮
◭ ◮
Back Close
Full Screen / Esc
Printer-friendly Version Interactive Discussion
Discussion
P
a
per
|
Discus
sion
P
a
per
|
Discussion
P
a
per
|
Discussion
P
a
per
|
Earth Syst. Dynam. Discuss., 5, 809–848, 2014 www.earth-syst-dynam-discuss.net/5/809/2014/ doi:10.5194/esdd-5-809-2014
© Author(s) 2014. CC Attribution 3.0 License.
This discussion paper is/has been under review for the journal Earth System Dynamics (ESD). Please refer to the corresponding final paper in ESD if available.
Temporal variations in atmospheric CO
2
on Rishiri Island in 2006–2013: responses
of the interannual variation in amplitude
to climate and the terrestrial sink in East
Asia
C. Zhu1,*and H. Yoshikawa-Inoue2
1
Graduate School of Environmental Science, Hokkaido University, Sapporo, 060-0810, Japan
2
Faculty of Environmental Earth Science, Hokkaido University, Sapporo, 060-0810, Japan
*
now at: Institute of Low Temperature Science, Hokkaido University, Sapporo, 060-0819, Japan
Received: 30 May 2014 – Accepted: 19 June 2014 – Published: 27 June 2014
Correspondence to: C. Zhu ([email protected])
ESDD
5, 809–848, 2014Temporal variations in atmospheric CO2
on Rishiri Island in 2006–2013
C. Zhu and H. Yoshikawa-Inoue
Title Page
Abstract Introduction
Conclusions References
Tables Figures
◭ ◮
◭ ◮
Back Close
Full Screen / Esc
Printer-friendly Version Interactive Discussion
Discussion
P
a
per
|
Discus
sion
P
a
per
|
Discussion
P
a
per
|
Discussion
P
a
per
Abstract
Surface observation of the atmospheric CO2 mixing ratio implies the combined influ-ences of both natural fluctuations and anthropogenic activities on the carbon cycle. Atmospheric CO2has been measured on Rishiri Island in the outflow region of Eurasia since May 2006. We report the first 7 year temporal atmospheric CO2variations from
5
diurnal to interannual scales. In the diurnal scale, an obvious cycle appeared as a min-imum in the afternoon and maxmin-imum at midnight in the summer months. Seasonally, the maximum CO2 concentration appeared around the beginning of April, while the minimum appeared around the middle of August. A mean growing season length of
∼126 days was estimated. In the period from 2007 to 2012, the peak-to-peak ampli-10
tude increased until 2009 and decreased thereafter, with a mean value of 19.7 ppm. In the long term, atmospheric CO2is increasing by a mean growth rate of 2.1 ppm year−1. Investigations on the driving climatic factors on the interannual variation in amplitude indicated that temperature in East Asia (40–60◦N, 90–150◦E) affected the CO2 ampli-tude by affecting the seasonal maximum, with a time lag of 1–2 years. On the contrary,
15
precipitation did not likely affect CO2 amplitudes. The amplitude also responded to a natural carbon source/sink variation in East Asia. We suggest that temperature in the first year would affect carbon sinks in the second year in the fetch regions, which further affect CO2amplitude mainly through ecosystem respiration. Circulation changes also likely contributed to the decreasing amplitude since 2009, as indicated by the
simulta-20
neous decrease in the222Rn concentration in spring and summer.
1 Introduction
Atmospheric carbon dioxide (CO2) is a major contributor (1.82 out of a total of 2.83 W m−2in 2011) to radiative forcing, a measure that determines the effect of green-house gases on the climate (Myhre et al., 2013). From 1990 to 2012, total radiative
forc-25
ESDD
5, 809–848, 2014Temporal variations in atmospheric CO2
on Rishiri Island in 2006–2013
C. Zhu and H. Yoshikawa-Inoue
Title Page
Abstract Introduction
Conclusions References
Tables Figures
◭ ◮
◭ ◮
Back Close
Full Screen / Esc
Printer-friendly Version Interactive Discussion
Discussion
P
a
per
|
Discus
sion
P
a
per
|
Discussion
P
a
per
|
Discussion
P
a
per
|
viewpoint of the biogeochemical cycle, three processes dominate the turnover of atmo-spheric CO2. They are the exchange of atmospheric CO2with the terrestrial biosphere, the exchange of atmospheric CO2 with the ocean, and the one-dimensional emission of CO2to the atmosphere from anthropogenic activities. Globally, there are exchanges between the atmosphere and the terrestrial biosphere of approximately 110 gigatonnes
5
(Gt) carbon per year. The exchange with the ocean is approximately 80 Gt year−1(Ciais et al., 2013). In addition, anthropogenic activities that are primarily caused by fossil fuel use, cement production and land use change emit approximately 9 Gt C year−1(DOE US, 2008). Of these, around half are absorbed by the terrestrial biosphere and the ocean, while the other half remain in the atmosphere. This anthropogenic emission of
10
CO2is believed to be the dominant cause of global warming.
A group of studies have been conducted to understand the carbon cycle. The ap-proaches that have been adopted are generally in the two categories known as bottom-up and top-down. In the bottom-bottom-up approaches, CO2 fluxes are estimated from the land, ocean and human activities (e.g. Keeling et al., 2011; Prytherch et al., 2010;
15
Saigusa et al., 2008). However, misreporting occurs as a result of simple error, igno-rance, or intention (Nisbet and Weiss, 2010). This makes top-down verification signif-icant because it is based on observations. The top-down approaches are a type of direct estimation, after all sources and sinks are contained in the resulting CO2mixing ratio (concentration). This is a valuable tool to validate carbon inventories estimated by
20
the bottom-up approach (e.g. Carouge et al., 2010a, b). It also constitutes the basic in-formation for building models (Rödenbeck et al., 2009). Measurements of atmospheric CO2thus turn out to be the basis for top-down flux estimations.
The first continuous in situ measurements of atmospheric CO2 started in 1958 at Mauna Loa (MLO), in parallel with the flask sampling in the South Pole in 1957 (Keeling,
25
ESDD
5, 809–848, 2014Temporal variations in atmospheric CO2
on Rishiri Island in 2006–2013
C. Zhu and H. Yoshikawa-Inoue
Title Page
Abstract Introduction
Conclusions References
Tables Figures
◭ ◮
◭ ◮
Back Close
Full Screen / Esc
Printer-friendly Version Interactive Discussion
Discussion
P
a
per
|
Discus
sion
P
a
per
|
Discussion
P
a
per
|
Discussion
P
a
per
(e.g. Niwa et al., 2011, 2012, 2014; Patra et al., 2011), and satellites (Maksyutov et al., 2013; Wunch et al., 2013). The observed data document both the natural oscillation of the global environment and the changing climate resulting from anthropogenic ac-tivities. In the Northern Hemisphere, there is consensus that the seasonal variation in atmospheric CO2 is caused by the changes in photosynthesis and respiration of the
5
terrestrial ecosystem. This is likely induced by temperature and precipitation changes (e.g. Buermann et al., 2007; Keeling et al., 1996). On the other hand, the long-term increasing trend was mainly due to anthropogenic emission and land use changes (Francey et al., 2010; Thoning et al., 1989).
In East Asia, it was reported that anthropogenic CO2emissions and other pollutants
10
have been increasing in the past decades (e.g. Akimoto, 2003; Fang et al., 2014). Meanwhile, boreal forests in the middle to eastern part of the Eurasian continent con-tribute critically to atmospheric CO2variations and global carbon budgets (Ciais et al., 2010; Peylin et al., 2013; Piao et al., 2011). For the 1.42 billion hectares of boreal forests in the world, the biomass sink was estimated to be 0.68±0.34 billion tons C 15
year−1, of which nearly 70 % was in Eurasia (Myneni et al., 2001). Consequently, the sources and sinks from both natural and anthropogenic sectors would influence surface CO2levels in East Asia.
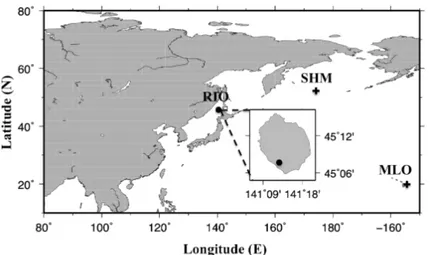
There are CO2observation stations in the remote islands of the open oceans, such as the Mauna Loa Observatory (Fig. 1). The remote sites have the advantage of
rep-20
resenting the continental scale of reference levels of trace gases. For example, the observed CO2variation at the MLO site is co-influenced by both the Eurasian and the North American continents (Buermann et al., 2007; Lintner et al., 2006). On the other hand, there are inland sites that are more convenient for catching synoptic pollution events (e.g. Levin et al., 1995; Ramonet et al., 2010; Zhou et al., 2003). In the boundary
25
ESDD
5, 809–848, 2014Temporal variations in atmospheric CO2
on Rishiri Island in 2006–2013
C. Zhu and H. Yoshikawa-Inoue
Title Page
Abstract Introduction
Conclusions References
Tables Figures
◭ ◮
◭ ◮
Back Close
Full Screen / Esc
Printer-friendly Version Interactive Discussion
Discussion
P
a
per
|
Discus
sion
P
a
per
|
Discussion
P
a
per
|
Discussion
P
a
per
|
Minejima et al. (2012) constrained the compositions of fossil fuel types in China, Korea and Japan based on changes in the∆O2/∆CO2molar ratio during pollution events.
Rishiri Island is the northernmost site in Japan where atmospheric greenhouse gases are measured, although it is not yet being incorporated by the WMO. Previ-ous studies indicated that it is co-influenced by continental and maritime fetches, when
5
the continental fetches are mainly in 90–150◦E, 40–60◦N (Zhu et al., 2012). This re-gion includes part of the extensive boreal forests from the middle to eastern Eurasian Continent (Lefsky, 2010). The changes in carbon sources and sinks in this region con-tribute critically to the variation in atmospheric CO2 and global carbon budgets. Since May 2006, atmospheric CO2has been continuously measured at Rishiri (Inoue et al.,
10
2008). In this work, we report the first 7 years of atmospheric CO2 data showing the temporal variations from the diurnal to interannual scales. Our purposes are (1) to examine the seasonal cycle and the inferred regional phenology; (2) to investigate the interannual amplitude variation (IAV); and (3) to investigate the environmental and circulation-related factors controlling the IAV.
15
2 Experimental section
2.1 The Rishiri Observatory
Rishiri is the northernmost island of Japan, with 5500 residents and an area of 182 km2. Its natural attributes are well protected in the territory of the Rishiri-Rebun-Sarobetsu National Park with no industry (Fig. 1). The center of the island is occupied by Mt.
20
Rishiri (1721 m), which is a Quaternary stratovolcano. Rishiri Observatory (RIO) is located at the south foot of Mt. Rishiri, at approximately 35 m a.s.l. It faces south-southwest at a distance of∼800 m from the coast. The temperature of the laboratory
ESDD
5, 809–848, 2014Temporal variations in atmospheric CO2
on Rishiri Island in 2006–2013
C. Zhu and H. Yoshikawa-Inoue
Title Page
Abstract Introduction
Conclusions References
Tables Figures
◭ ◮
◭ ◮
Back Close
Full Screen / Esc
Printer-friendly Version Interactive Discussion
Discussion
P
a
per
|
Discus
sion
P
a
per
|
Discussion
P
a
per
|
Discussion
P
a
per
2.2 Atmospheric CO2measurement
During sampling, ambient air was drawn at 10 L min−1 by a diaphragm pump from
∼4 m above the ground through a 0.25 in Teflon tube. In the laboratory, an aliquot of
air (0.2 L min−1) was passed through an electric dehumidifier and Nafion tube (Perma Pure, Inc., USA) to remove water vapor. A heatless dryer (CKD HD-0.5, CKD Co., Ltd.)
5
was used to supply the Nafion tube dry air. After removal of water vapor, the air sample was introduced into the sample cell of a non-dispersive infrared gas (NDIR) analyzer (LI 6262, LI-COR Inc., USA) for 4 min, and the airflow was stopped to establish tem-perature and pressure equilibrium. Twenty-five seconds later, the output voltage of the NDIR analyzer was integrated for 30 s by a programmable logic controller (Yokogawa
10
FA-M3R). The CO2concentration was obtained every 5 min and averaged over 1 h. The NDIR analyzer was calibrated every 4 h (8 h during nighttime) by successively introducing four calibrated working gases (340, 380, 420, and 450 ppm CO2in dry air) into the NDIR analyzer cell for 5 min each. The CO2 concentrations of the working gases are traceable to the WMO mole fraction scale (Inoue and Matsueda, 2001). The
15
drift of the output voltage of the NDIR analyzer was estimated by a linear interpola-tion of two successive sets of calibrainterpola-tion data. Based on the replicated measurements of a sample gas in the cylinder, the precision of analysis (±1σ) was estimated to be
smaller than 0.1 ppm during daytime and equal to or slightly larger than 0.1 ppm during nighttime (21:00–05:00 local time, LT).
20
2.3 Extracting the seasonal cycle and the long-term trend
The observed atmospheric CO2 records consist of three components (e.g. Keeling et al., 1996). The first is the local contribution, which leads to the short time variation on a time scale of several hours. The second is the seasonal cycle within a period of one year. This is caused by the “breathing” of the land biosphere, which includes
25
ESDD
5, 809–848, 2014Temporal variations in atmospheric CO2
on Rishiri Island in 2006–2013
C. Zhu and H. Yoshikawa-Inoue
Title Page
Abstract Introduction
Conclusions References
Tables Figures
◭ ◮
◭ ◮
Back Close
Full Screen / Esc
Printer-friendly Version Interactive Discussion
Discussion
P
a
per
|
Discus
sion
P
a
per
|
Discussion
P
a
per
|
Discussion
P
a
per
|
the industrial revolution as a result of fossil fuel consumption and land use change. To investigate the seasonal and long-term trends of atmospheric CO2, the data were se-lected to reflect regional- to global-scale variations and were subjected to a curve-fitting method. Details on the selection and curve fitting are described in the Supplement, and a brief description will be given is this section.
5
Hourly data were first selected to remove local influences. We examined the data continuity after selecting data using thresholds (0.25, 0.5 and 1 ppm) for hour-to-hour variations (any or both consecutive hours) (Fig. S1 in the Supplement). We finally kept those hours if the variations between any two consecutive hourly values were less than 0.25 ppm, a method that was also used by Thoning et al. (1989) for the analysis of
10
Mauna Loa data. After this selection, 47.4 % of the original record was retained. We then examined the daily means using different hours of the day (daytime, nighttime and transition hours) to minimize local influences. Daily means calculated from daytime hours (10:00–15:00 LT) had the lowest noise level and apparent baseline and were chosen to examine large-scale variations (Fig. S2 in the Supplement). This dataset for
15
curve fitting used 14.1 % of the original record.
For the calculated daily means, a curve-fitting method including function fit and residuals filtering was applied to extract seasonal cycles and secular trends follow-ing Thonfollow-ing et al. (1989). Both the numbers of polynomial terms and harmonics of the function fit were set as 3 (Fig. S3a). During the residuals filtering, the cutoff
frequen-20
cies for the short- and long-term variations were set at 120 and 667 d, respectively (Fig. S3b).
2.4 Ancillary data
The IAV at RIO was compared with that of MLO and Shemya Island (SHM, 52.72◦N,
174.10◦E). CO2 data at these sites were obtained from NOAA (Tans and Keeling,
25
ESDD
5, 809–848, 2014Temporal variations in atmospheric CO2
on Rishiri Island in 2006–2013
C. Zhu and H. Yoshikawa-Inoue
Title Page
Abstract Introduction
Conclusions References
Tables Figures
◭ ◮
◭ ◮
Back Close
Full Screen / Esc
Printer-friendly Version Interactive Discussion
Discussion
P
a
per
|
Discus
sion
P
a
per
|
Discussion
P
a
per
|
Discussion
P
a
per
National Climate Data Center (Jones and Moberg, 2003; Peterson and Russell, 1997). The temperature anomaly was evaluated for the period 1981–2000, while the precipita-tion anomaly was evaluated for 1961–1990. The monthly land temperature and precip-itation anomalies over East Asia (EA, 40–60◦N, 90–150◦E), broader East Asia (BEA, 15–75◦N, 90–180◦E), the Northern Hemisphere (NH) and the globe (GL) were calcu-5
lated over 2004–2013. The linear relationships between these climatic parameters and the IAV were investigated. The relationship between IAV with carbon sink strengths (Net Ecosystem Production, NEP) in EA and BEA was also investigated to elucidate the underlying mechanisms. The NEP data were obtained from CarbonTracker Europe as gridded flux (Peters et al., 2007, 2010). The possible changes in circulation around
10
RIO that contribute to IAV derived from atmospheric222Rn were investigated. Measure-ment of atmospheric222Rn at RIO was described elsewhere (Zhu et al., 2012).
The growth rate was examined with respect to the influences of fossil fuel emissions on regional and global scales and natural oscillations in terms of the El Niño/Southern Oscillation (ENSO) and the North Pacific Index (NPI). The fossil fuel emission data
15
were obtained from the Carbon Dioxide Information Analysis Center (CDIAC) (Boden et al., 2013). The ENSO index data were obtained from NOAA (http://www.cpc.ncep. noaa.gov/data/indices/soi). The NPI data were obtained from The National Center for Atmospheric Research (NCAR) (Hurrell et al., 2013).
The planetary boundary layer height and local wind direction were used to
dis-20
cuss local meteorology on diurnal CO2 variations. Planetary boundary layer height was extracted from the Climate Forecast System Reanalysis of the University Cor-poration for Atmospheric Research (UCAR) Data Archives (Saha et al., 2010). Wind direction was measured at Kutsukata meteorological station, which is approximately 11 km from RIO, where the data were obtained from the Japan Meteorological Agency
25
ESDD
5, 809–848, 2014Temporal variations in atmospheric CO2
on Rishiri Island in 2006–2013
C. Zhu and H. Yoshikawa-Inoue
Title Page
Abstract Introduction
Conclusions References
Tables Figures
◭ ◮
◭ ◮
Back Close
Full Screen / Esc
Printer-friendly Version Interactive Discussion
Discussion
P
a
per
|
Discus
sion
P
a
per
|
Discussion
P
a
per
|
Discussion
P
a
per
|
3 CO2variation from diurnal to interannual scales
3.1 Data overview
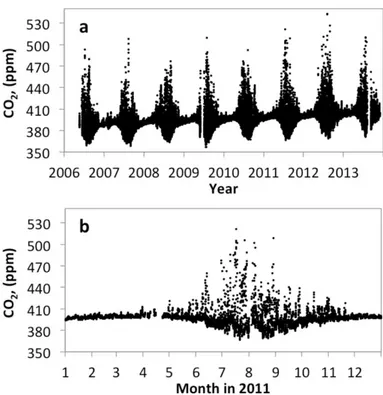
Among all 66 504 h from May 2006 to November 2013, there are 5637 h in which CO2 was not recorded because of system maintenance, power blackouts, and so on. In other words, 91.5 % of the hours were recorded. Atmospheric CO2 at Rishiri
Is-5
land indicated clear seasonal cycles caused by the seasonal change in photosynthetic strengths, as observed at other typical mid-latitude sites in the Northern Hemisphere (Fig. 2). In addition, large episodic high CO2 events appeared frequently and exclu-sively during the summer months. This is likely to be caused by (1) the high emissions from the local soil and vegetation, and (2) the formation of a stable nocturnal boundary
10
layer, as is discussed in the next section.
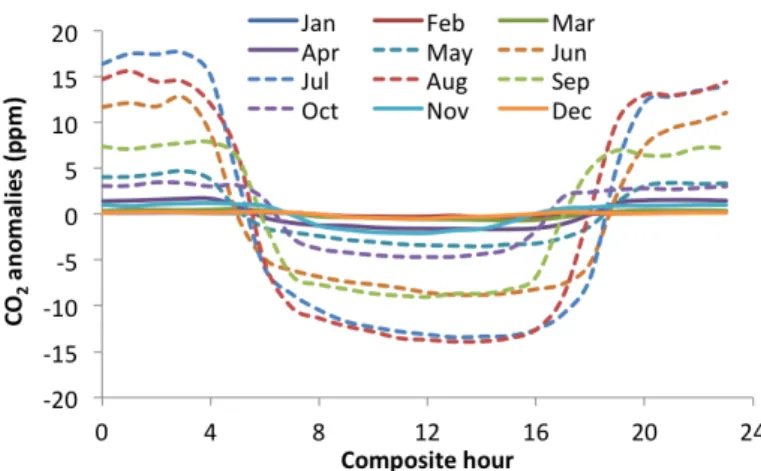
3.2 Diurnal variation
Figure 3 shows the diurnal variation of atmospheric CO2at Rishiri Island obtained from the 7 year records. To obtain the anomalies in Fig. 3, the mean CO2 concentration at each hour of the month was first calculated. The anomalies were then calculated as
15
the departure of each hourly value from the 24 h means of the month. In the different months of a year, the diurnal CO2cycle varied greatly. From May to October, a promi-nent diurnal variation appeared in the amplitudes ranging from 8.1 to 31.0 ppm (Fig. S4 in the Supplement), while the largest values were in July–August (29.5–31.0 ppm). In these summer months, the CO2concentration decreased rapidly for 2–3 h in the early
20
morning after sunrise. From around 08:00 LT, CO2 tended to be relatively steady at low concentrations during the daytime until around 16:00 LT. From sunset to the early evening, CO2 concentration increased rapidly for another 2–3 h. During the nighttime from∼20:00 to∼04:00 LT, CO2concentrations were relatively steady at high
concen-trations. On the contrary, from November to April, the amplitudes of the diurnal
varia-25
ESDD
5, 809–848, 2014Temporal variations in atmospheric CO2
on Rishiri Island in 2006–2013
C. Zhu and H. Yoshikawa-Inoue
Title Page
Abstract Introduction
Conclusions References
Tables Figures
◭ ◮
◭ ◮
Back Close
Full Screen / Esc
Printer-friendly Version Interactive Discussion
Discussion
P
a
per
|
Discus
sion
P
a
per
|
Discussion
P
a
per
|
Discussion
P
a
per
(0.7 ppm) appeared in December–February in which the diurnal cycle with nighttime high and daytime low concentrations was still obvious.
Several factors contribute to this phenomenon in the summer months. The first fac-tor is that of the diurnal variation of the height of the mixing layer. Nocturnal stable boundary layers were formed that broke up in the daytime during calm days (Fig. S5a
5
in the Supplement). This phenomenon also caused the diurnal variation of 222Rn in the summer (Zhu et al., 2012). The second factor is the local vegetation. Local plants caused a photosynthetic drawdown during the daytime, when the respiration by plants and soil contributed to the nighttime buildup. However, in regions where photosynthesis dominates daytime drawdown, CO2 frequently decreased continuously until reaching
10
an afternoon minimum (Haszpra et al., 2008; Murayama et al., 2003; Thoning et al., 1989). We therefore explored the meteorological drivers in terms of local topography.
The observatory is located on the seashore on the southern foot of Mt. Rishiri, where both the sea–land breeze and the mountain–valley airflow would exert an influence on the atmospheric observations. Local meteorology indicates that there is an
on-15
shore wind during daytime and offshore winds during the night. For example, during 6–13 June 2011, a diurnal wind pattern appeared when the wind came mainly from the north where Mt. Rishiri is located, while during the daytime, it comes from the ocean (west, east and south) (Fig. S5b in the Supplement). Continuous fresh air coming in from the surface of the ocean during daytime is likely causing the flat CO2 pattern in
20
the afternoon.
On the other hand, in sites with flat terrain, the nighttime CO2 buildup indicated a continuously increasing pattern, such as at Hegyhátsál, Hungary (Haszpra et al., 2008). However, at sites adjacent to the mountains, the nighttime buildup had a flat pattern, as was observed at Takayama, Japan (Murayama et al., 2003). This was
re-25
ESDD
5, 809–848, 2014Temporal variations in atmospheric CO2
on Rishiri Island in 2006–2013
C. Zhu and H. Yoshikawa-Inoue
Title Page
Abstract Introduction
Conclusions References
Tables Figures
◭ ◮
◭ ◮
Back Close
Full Screen / Esc
Printer-friendly Version Interactive Discussion
Discussion
P
a
per
|
Discus
sion
P
a
per
|
Discussion
P
a
per
|
Discussion
P
a
per
|
S4b in the Supplement). During these hours, the weather was often calm with a near-zero wind speed. For example, in 2011, the mean wind speed was 1.2 m s−1 during those hours (a total of 259 h) when the observed CO2concentrations were higher than 420 ppm, and it was 0.9 m s−1in the hours (a total of 70 h) when the CO2concentrations were higher than 450 ppm. These hours are removed to eliminate local influences.
5
3.3 The seasonal cycle
3.3.1 Seasonal amplitude
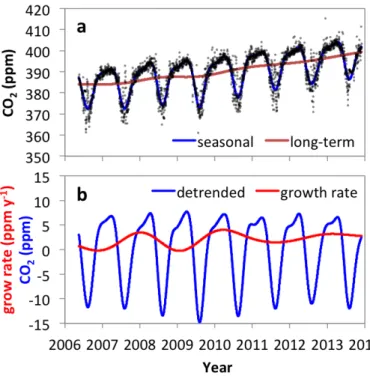
The calculated smoothed fit and the long-term trend along with the daily means were plotted in Fig. 4a. The de-trended seasonal cycle (∆CO2) and the growth rate were plotted in Fig. 4b. The maxima, minima and yearly peak-to-peak amplitudes were
ob-10
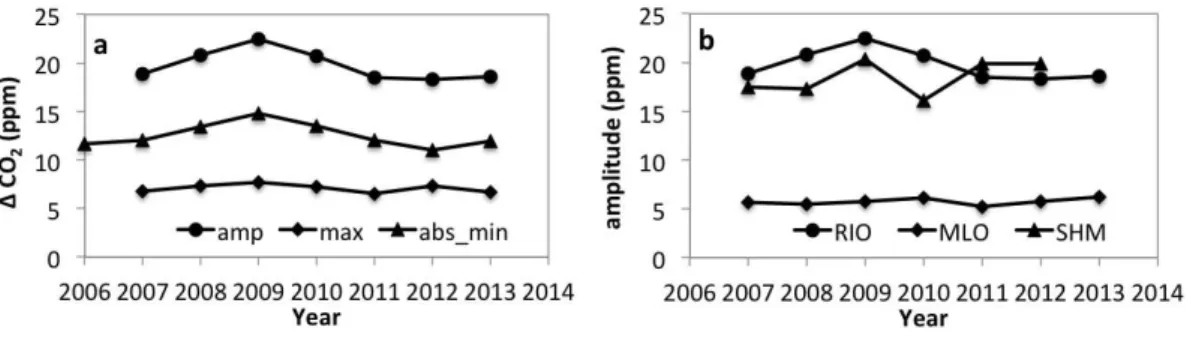
tained from∆CO2. The mean seasonal amplitude of 19.7±1.6 ppm was estimated with
a maximum∆CO2of 7.1±0.4 ppm and a minimum of−12.5±1.2 ppm (Fig. 5a).
Inter-annually, the seasonal amplitude increased until 2009 and decreased thereafter. The variation was similar to that at SHM, located in the western North Pacific (Figs. 1 and 5b). However, the magnitude at RIO was slightly larger than that at SHM in 2007–2010.
15
This was because RIO was closer to the Eurasian continent and tending to be more sensitive to terrestrial sources/sinks. The magnitude of∆CO2at RIO was much larger than at MLO (Figs. 1 and 5b), indicating the increased effect of the terrestrial biosphere in the Eurasian continent on the ambient level at RIO. The magnitude difference was also related to the latitudinal gradient because there was an amplitude decrease
to-20
ward the south in the Northern Hemisphere (Conway et al., 1994; Keeling et al., 1996). The altitude difference between RIO (35 m) and MLO (3397 m) might be another rea-son. The factors that possibly affected the IAV were the variation in the carbon source and sink strength (e.g. Graven et al., 2013) and the changes in air circulation. These constraints will be discussed in Sect. 4.
ESDD
5, 809–848, 2014Temporal variations in atmospheric CO2
on Rishiri Island in 2006–2013
C. Zhu and H. Yoshikawa-Inoue
Title Page
Abstract Introduction
Conclusions References
Tables Figures
◭ ◮
◭ ◮
Back Close
Full Screen / Esc
Printer-friendly Version Interactive Discussion
Discussion
P
a
per
|
Discus
sion
P
a
per
|
Discussion
P
a
per
|
Discussion
P
a
per
3.3.2 The variation phase
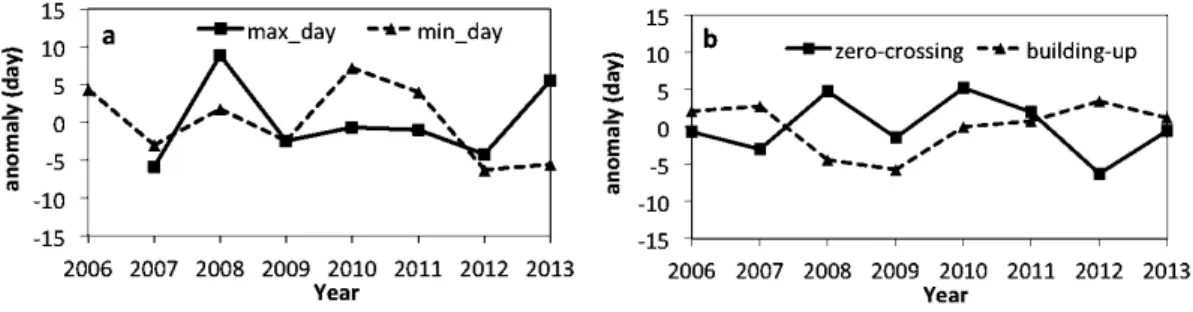
The day of the year on which the maximum CO2 concentrations appear marked the changing of the phenology of the terrestrial biosphere from the dormant season to the growing season. Similarly, the day of minimum CO2concentration was an index of the shift from the growing to the dormant season (Piao et al., 2007; Richardson et al.,
5
2010). At RIO, the maximum CO2appeared on 3 April (Day of Year, DOY 93) ±5.3 d,
and the minimum appeared on 8 August (DOY 220)±5.0 d (Fig. 6a). As the smoothed
curve around the maximum and minimum days varied quite smoothly, comparatively large interannual variations of the date appeared. Similar indices showing the phase of the seasonal cycle were the days when the fitted seasonal cycle crosses the
long-10
term trend. These were the days when the drawdown of the seasonal cycle crosses the long-term trend (the zero-crossing day) and the buildup of the seasonal cycle cross the long-term trend (the buildup day). The zero-crossing day appeared on 2 June (DOY 153)±3.9 d, and the buildup day appeared on 23 October (DOY 296)±3.6 d (Fig. 6b).
Based on the Normalized Difference Vegetation Index (NDVI) and analysis of the
15
climatic parameters of the spring phenology in six temperate biomes of China for the period of 1982–2006, Wu et al. (2012) found that the spring phenology in most ar-eas showed obvious advancing trends during the 1980s and early 1990s and delaying trends thereafter. For this 7 year observation period, the present result of both the max-imum and minmax-imum days, and the zero-crossing and the buildup days did not show an
20
evident shifting trend in phenology.
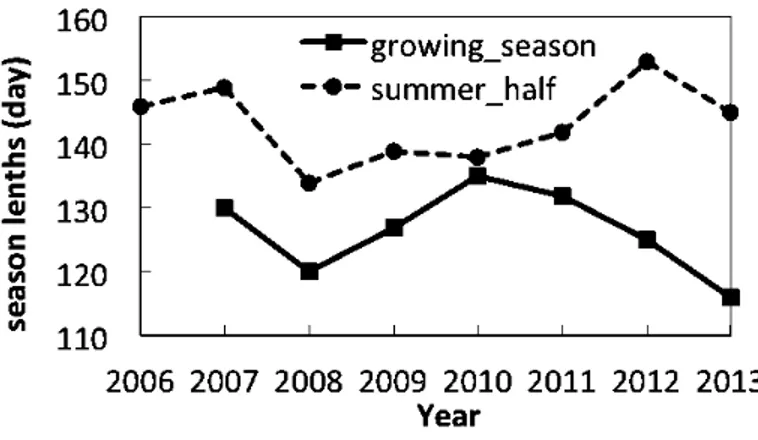
In the period of CO2drawdown between the maximum and minimum days, the photo-synthetic absorption by the terrestrial biosphere was much greater than the respiration. This period could therefore serve as an index of the growing season length. This length was estimated at 126.3±6.7 d (Fig. 7). The longest growing season was observed in 25
ESDD
5, 809–848, 2014Temporal variations in atmospheric CO2
on Rishiri Island in 2006–2013
C. Zhu and H. Yoshikawa-Inoue
Title Page
Abstract Introduction
Conclusions References
Tables Figures
◭ ◮
◭ ◮
Back Close
Full Screen / Esc
Printer-friendly Version Interactive Discussion
Discussion
P
a
per
|
Discus
sion
P
a
per
|
Discussion
P
a
per
|
Discussion
P
a
per
|
The period between the zero-crossing and buildup days could also be assumed as the summer half of the year. Based on the observed CO2 variation, the length of the summer half was estimated at 143.1±6.7 d (Fig. 7). The longest summer half appeared in 2012 at 153 days, while the shortest summer half year of observation period was in 2008 at 134 days. Recent studies suggested the extension of the length of the growing
5
season both in East Asia and around the world in recent decades (Chen et al., 2005; Cong et al., 2012; Jeong et al., 2011). Longer-term observations are needed to exam-ine the relations between the vegetation growing phase and the CO2 variation phase changes.
4 The controlling factors on IAV 10
4.1 The effect of temperature and precipitation on IAV
Previous studies indicated that the dominant continental fetch regions that affect RIO were in the range of 40–60◦N, 90–150◦E of East Asia (Zhu et al., 2012). A recent sim-ulation using the transport model NICAM-TM on the footprint of RIO produced similar results (Y. Niwa, personal communication, 2014). Although RIO was also influenced by
15
the maritime fetch regions, especially in summer, they brought about an air mass with a background or quasi-background level of CO2. The variations of the air–sea CO2flux in comparison with the air–land flux are quite small (Lee et al., 1998; Séférian et al., 2013). Given this fact, the interannual CO2variations at RIO are likely dominantly af-fected by the sources and sinks in the fetch regions of the Eurasian continent. The
20
effects of temperature and precipitation from regional to global scales on the observed IAV were examined.
In the climate–vegetation–CO2relations, the climatic variations caused the changes in terrestrial carbon fluxes, leading to the variations of atmospheric CO2 level (e.g. Yu et al., 2012). Therefore, CO2amplitude in the current year, determined by the maximum
25
ESDD
5, 809–848, 2014Temporal variations in atmospheric CO2
on Rishiri Island in 2006–2013
C. Zhu and H. Yoshikawa-Inoue
Title Page
Abstract Introduction
Conclusions References
Tables Figures
◭ ◮
◭ ◮
Back Close
Full Screen / Esc
Printer-friendly Version Interactive Discussion
Discussion
P
a
per
|
Discus
sion
P
a
per
|
Discussion
P
a
per
|
Discussion
P
a
per
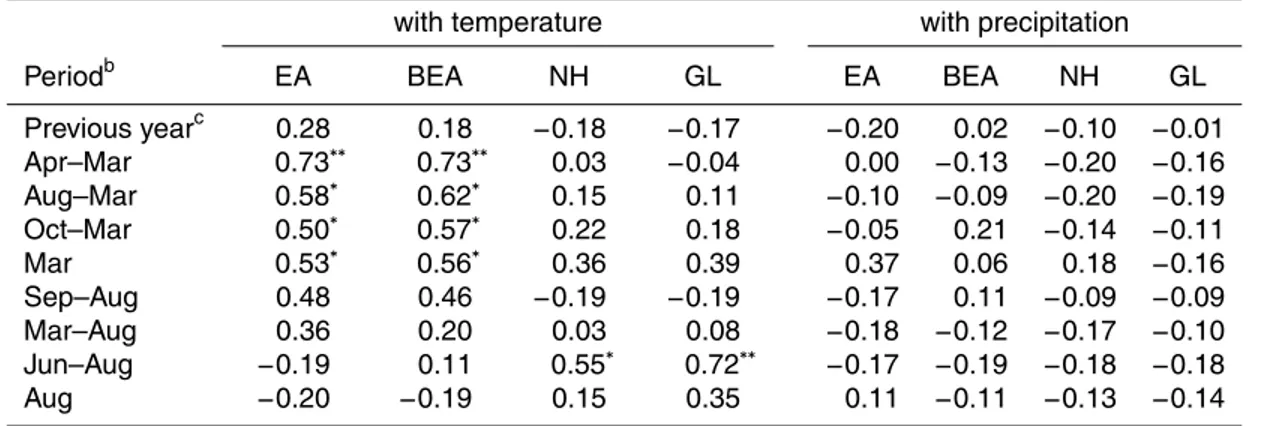
previous months. To constrain this, the relations between amplitude and temperature and precipitation anomalies in different periods of previous months in EA, BEA, NH and GL were investigated (Table S1 in the Supplement). On an annual scale, the amplitude anomaly was not related to temperature anomalies on any spatial scale in the current year. It was also not constrained by temperature anomalies during the months of the
5
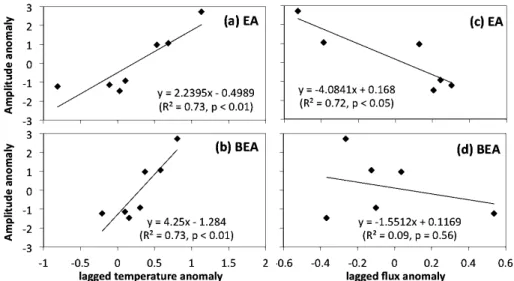
previous year. However, the amplitude anomaly at Rishiri was significantly affected by temperature anomalies in the period from April of 2 years before until the previous March, in EA and BEA (with 1 year time-lag,p <0.01, Fig. 8a and b). Certain shorter time periods within this longer period, specifically August–March, October–March and March itself, are influenced to different degrees (p <0.05, Table 1). On the other hand,
10
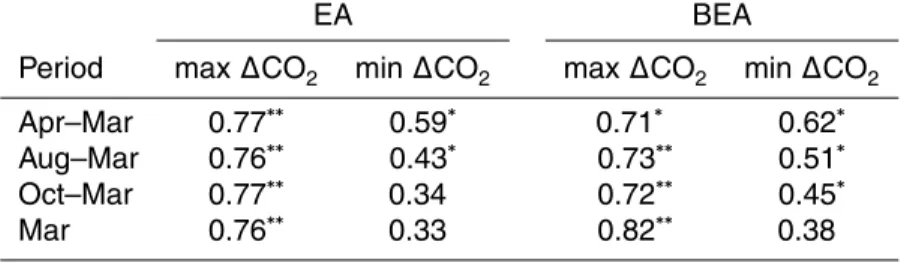
there were no impacts of precipitation anomalies on amplitude without or with time lags (Tables S1 in the Supplement and 1). The effect of temperature on the components of the amplitude was investigated further. In association with the phase variation (the CO2 drawdown and buildup days), this investigation was performed by examining the effect of the lagged temperature anomalies in different periods on the maximum and
mini-15
mum∆CO2values. With a 1 year time-lag (mean temperature anomalies over previous 1–2 years), temperatures strongly affected the maximum ∆CO2 and to some degree affected the minimum∆CO2(Table 2).
A similar phenomenon was also observed at MLO where the East Eurasia temper-ature at mid-to-high latitudes caused a 1–2 year lagged amplitude (Buermann et al.,
20
2007). Several possible mechanisms underlie this phenomenon. The first is the lagged response of the terrestrial biosphere to temperature. Braswell et al. (1997) reported that there was a 1–2 year lagged response of NDVI to temperature anomalies, especially in the boreal ecosystems. Their results indicated that the source and sink strengths of the terrestrial biosphere for the current season are associated with the climatic
variabil-25
ESDD
5, 809–848, 2014Temporal variations in atmospheric CO2
on Rishiri Island in 2006–2013
C. Zhu and H. Yoshikawa-Inoue
Title Page
Abstract Introduction
Conclusions References
Tables Figures
◭ ◮
◭ ◮
Back Close
Full Screen / Esc
Printer-friendly Version Interactive Discussion
Discussion
P
a
per
|
Discus
sion
P
a
per
|
Discussion
P
a
per
|
Discussion
P
a
per
|
in the previous year and attributed this lagged influence to “climate memory” carried by regional snowmelt water. However, in the western boreal North America, the car-bon response lags behind the temperature anomalies by approximately 6 months. The controlling climatic variables on terrestrial carbon balance no doubt varied in diff er-ent places, probably as a result of vegetation changes. The second possible reason
5
is the turnover time of plant leaf litter, wood and other fine organic matter. Although a direct response to the climate was frequently observed, reconciliation of the car-bon budget of a mid-latitude forest covered several years (Barford et al., 2001). This also indicated that the climatic influences on vegetation and therefore on the CO2level have a longer time scale. Finally, other than the direct effects on photosynthesis and
10
respiration, climatic parameters would cause the indirect effects on the biological and ecological processes dominating the carbon flux. Hui et al. (2003) termed this effect as “functional change”. These functional change effects had been reported in bog and prairie ecosystems (Wayne Polley et al., 2008; Teklemariam et al., 2010).
Our estimation of better relations between the leading temperature anomalies and
15
the maximum ∆CO2 implied that the soil respiration is playing a more important role in affecting CO2 amplitude. This is because soil respiration is the main contribution to ecosystem respiration (Re) and is mostly regulated by the air and soil tempera-ture (e.g. Bond-Lamberty and Thomson, 2010; Janssens et al., 2002; Mahecha et al., 2010), especially in the dormant season (e.g. Monson et al., 2006; Zhu et al., 2014).
20
A recent study revealed that global SOC (soil organic carbon) stock changes could be well explained by a temperature anomaly with a resolution of 1–2◦C, while the effect of the precipitation anomaly was negligible (Nishina et al., 2014).
IAV was further examined for its relation with carbon source/sink strengths. It was found that amplitude anomalies were significantly related with NEP anomalies in the
25
ESDD
5, 809–848, 2014Temporal variations in atmospheric CO2
on Rishiri Island in 2006–2013
C. Zhu and H. Yoshikawa-Inoue
Title Page
Abstract Introduction
Conclusions References
Tables Figures
◭ ◮
◭ ◮
Back Close
Full Screen / Esc
Printer-friendly Version Interactive Discussion
Discussion
P
a
per
|
Discus
sion
P
a
per
|
Discussion
P
a
per
|
Discussion
P
a
per
in the next year (second year), where warming would cause an intensified sink. The resulting higher sequestration would further cause a larger CO2 amplitude in the fol-lowing year (third year) through an enlarged Re, especially in the dormant season. In future work, it will be crucial to unveil the mechanisms of these lagged responses of the CO2 level/ecosystem function to the climatic variables to understand the interactions
5
among the climate, the biosphere and the atmosphere.
4.2 Circulation changes
Changes in source regions affect atmospheric compositions at receptors (Fleming et al., 2012). Thus, possible interannual changes in circulation would influence the variations of amplitude. Previous studies have proven the effect of circulation changes
10
on the observed CO2seasonal cycle (Higuchi et al., 2002; Murayama et al., 2007). At RIO, it was found that the222Rn concentration has decreased interannually since 2009 (Fig. S7 in the Supplement). Investigations on interannual variations in different seasons indicated that the decrease was statistically significant in spring by a rate of
−0.11 Bq m−3year−1 (R2=0.84, p <0.05). This implied a change in circulation with
15
decreasing continental fetch and increasing maritime fetch so long as source strengths remain constant. Further investigation indicated that there were positive relations be-tween the maximum∆CO2and222Rn in the spring and between the absolute value of minimum∆CO2and222Rn in summer (Fig. 9). Although these relations did not reached the statistically significant level with the short period of 5 years of data, the results
im-20
plied that the decreasing amplitudes at RIO were also likely caused by the change in air circulation. Kimoto (2005) predicted an increased activity of the East Asia mon-soonal rain band in summer associated with the strengthening of anti-cyclonic cells to its south and north. This might bring about an increased influence of the summer mar-itime fetches to RIO. Meanwhile, Patra et al. (2005) reported that interannual variability
25
ESDD
5, 809–848, 2014Temporal variations in atmospheric CO2
on Rishiri Island in 2006–2013
C. Zhu and H. Yoshikawa-Inoue
Title Page
Abstract Introduction
Conclusions References
Tables Figures
◭ ◮
◭ ◮
Back Close
Full Screen / Esc
Printer-friendly Version Interactive Discussion
Discussion
P
a
per
|
Discus
sion
P
a
per
|
Discussion
P
a
per
|
Discussion
P
a
per
|
CO2amplitude at RIO might be related to the change in ecosystem that was discussed in Sect. 4.1.
5 The growth rate
Other than the seasonal cycle, another part of the signal is the long-term trend. The long-term trend is frequently discussed in terms of variations in growth rate
5
(e.g. Thoning et al., 1989; Wang et al., 2014). The annual CO2 growth rate at RIO was in the range of 1.7–3.4 ppm year−1 from 2007 to 2012, with an average of 2.1 ppm year−1 during this period (Fig. 10). The magnitude as well as the trend were
similar to that at MLO.
The long-term CO2 trend was frequently related to large-scale phenomena, such
10
as ENSO. The linear regression of the monthly CO2growth rate at RIO with an ENSO proxy against the Southern Oscillation Index (SOI) was examined. The results indicated that there was a lagged negative response of the growth rate to SOI. Specifically, the maximum SOI occurred 8 months before the minimum growth rate (Fig. 11a). This was longer than such a relation for MLO, where a 6 month lagged negative response of
15
growth rate to SOI was observed (Thoning et al., 1989). As the uniform atmospheric mixing in the Northern Hemisphere occurs within 2–3 months (Czeplak and Junge, 1974), this “teleconnection” is explained based on the air circulation.
NPI is another index defined to measure interannual to decadal variations in the atmospheric circulation, which is calculated as the area-weighted sea level pressure
20
over the region 30–65◦N, 160◦E–140◦W (Hurrell et al., 2013). We estimated a lagged negative response of growth rate to NPI, where the maximum NPI occurred∼3 months
before the minimum growth rate (Fig. 11b). These results suggested that the circulation changes would cause growth rate variations. However, as the investigations of the long-term trend (growth rate) often require a long period record (Francey et al., 2010; Ito,
25
ESDD
5, 809–848, 2014Temporal variations in atmospheric CO2
on Rishiri Island in 2006–2013
C. Zhu and H. Yoshikawa-Inoue
Title Page
Abstract Introduction
Conclusions References
Tables Figures
◭ ◮
◭ ◮
Back Close
Full Screen / Esc
Printer-friendly Version Interactive Discussion
Discussion
P
a
per
|
Discus
sion
P
a
per
|
Discussion
P
a
per
|
Discussion
P
a
per
6 Conclusions
The seven-year time series CO2 data at Rishiri Island were analyzed to constrain sources and sinks in the East Asia region. After removing local influences, the time series CO2 record was fitted to extract the seasonal cycle and long-term trend. The seasonal cycle, represented by the peak-to-peak amplitude, was analyzed for the
in-5
terannual variation pattern. The CO2amplitudes obtained showed a typical magnitude in the mid-latitudes of approximately 19.7 ppm, with the seasonal maximum appeared around the beginning of April and minimum around the beginning of August. We found that interannual variations in atmospheric CO2at the outflow region of the Asian conti-nent were affected by the temperature in East Asia through strengthened effects on the
10
seasonal maximum with a time lag of 1–2 years. It was likely that the terrestrial ecosys-tem in East Asia received this climatic signal and transmitted it to the atmospheric CO2 amplitude. Interannual variations in222Rn indicated that circulation changes were also likely contributing to the decreasing amplitude since 2009. The observed growth rate was related to large-scale circulations such as the Southern Oscillation Index and the
15
North Pacific Index.
The Supplement related to this article is available online at doi:10.5194/esdd-5-809-2014-supplement.
Acknowledgements. We thank H. Tanimoto, of the National Institute of Environmental Studies, H. Matsueda, of the Geochemical Laboratory, Meteorological Research Institute, and T. Irino, of
20
ESDD
5, 809–848, 2014Temporal variations in atmospheric CO2
on Rishiri Island in 2006–2013
C. Zhu and H. Yoshikawa-Inoue
Title Page
Abstract Introduction
Conclusions References
Tables Figures
◭ ◮
◭ ◮
Back Close
Full Screen / Esc
Printer-friendly Version Interactive Discussion
Discussion
P
a
per
|
Discus
sion
P
a
per
|
Discussion
P
a
per
|
Discussion
P
a
per
|
References
Akimoto, H.: Global air quality and pollution, Science, 302, 1716–1719, 2003.
Barford, C. C., Wofsy, S. C., Goulden, M. L., Munger, J. W., Hammond, P. E., Urbanski, S. P., Hutyra, L., Saleska, S. R., Fitzjarrald, D., and Moore, K.: Factors controlling long- and short-term sequestration of atmospheric CO2 in a mid-latitude forest, Science, 294, 1688–1691,
5
2001.
Boden, T. A., Marland, G., and Andres, R. J.: Global, Regional, and National Fossil-Fuel CO2 Emissions, Carbon Dioxide Information Analysis Center, Oak Ridge National Laboratory, US Department of Energy, Oak Ridge, Tenn., USA, 10.3334/CDIAC/00001_V2013, 2013. Bond-Lamberty, B. and Thomson, A. M.: Temperature-associated increases in the global soil
10
respiration record, Nature, 464, 579–582, 2010.
Braswell, B. H., Schimel, D. S., Linder, E., and Moore III, B.: The response of global terrestrial ecosystems to interannual temperature variability, Science, 278, 870–872, 1997.
Buermann, W., Lintner, B. R., Koven, C. D., Angert, A., Pinzon, J. E., Tucker, C. J., and Fung, I. Y.: The changing carbon cycle at Mauna Loa Observatory, P. Natl. Acad. Sci. USA,
15
104, 4249–4254, 2007.
Carouge, C., Bousquet, P., Peylin, P., Rayner, P. J., and Ciais, P.: What can we learn from European continuous atmospheric CO2 measurements to quantify regional fluxes – Part 1: Potential of the 2001 network, Atmos. Chem. Phys., 10, 3107–3117, doi:10.5194/acp-10-3107-2010, 2010a.
20
Carouge, C., Rayner, P. J., Peylin, P., Bousquet, P., Chevallier, F., and Ciais, P.: What can we learn from European continuous atmospheric CO2measurements to quantify regional fluxes – Part 2: Sensitivity of flux accuracy to inverse setup, Atmos. Chem. Phys., 10, 3119–3129, doi:10.5194/acp-10-3119-2010, 2010b.
Chen, X. Q., Hu, B., and Yu, R.: Spatial and temporal variation of phonological growing season
25
and climate change impacts in temperate eastern China, Global Change Biol., 11, 1118– 1130, 2005.
Ciais, P., Canadell, J. G., Luyssaert, S., Chevallier, F., Shvidenko, A., Poussi, Z., Jonas, M., Peylin, P., King, A. W., Schulze, E.-D., Piao, S., Rödenbeck, C., Peters, W., and Bréon, F.-M.: Can we reconcile atmospheric estimates of the Northern terrestrial carbon sink with
land-30
ESDD
5, 809–848, 2014Temporal variations in atmospheric CO2
on Rishiri Island in 2006–2013
C. Zhu and H. Yoshikawa-Inoue
Title Page
Abstract Introduction
Conclusions References
Tables Figures
◭ ◮
◭ ◮
Back Close
Full Screen / Esc
Printer-friendly Version Interactive Discussion
Discussion
P
a
per
|
Discus
sion
P
a
per
|
Discussion
P
a
per
|
Discussion
P
a
per
Ciais, P., Sabine, C., Bala, G., Bopp, L., Brovkin, V., Canadell, J., Chhabra, A., DeFries, R., Gal-loway, J., Heimann, M., Jones, C., Le Quéré, C., Myneni, R. B., Piao, S., and Thornton, P.: Carbon and Other Biogeochemical Cycles, in: Climate Change 2013: The Physical Science Basis, Contribution of Working Group I to the Fifth Assessment Report of the Intergovern-mental Panel on Climate Change, edited by: Stocker, T. F., Qin, D., Plattner, G.-K., Tignor, M.,
5
Allen, S. K., Boschung, J., Nauels, A., Xia, Y., Bex, V., and Midgley, P. M., Cambridge Univer-sity Press, Cambridge, UK and New York, NY, USA, 2013.
Cong, N., Wang, T., Nan, H., Ma, Y., Wang, X., Myneni, R. B., and Piao, S.: Changes in satellite-derived spring vegetation green-up date and its linkage to climate in China from 1982 to 2010: a multimethod analysis, Global Change Biol., 19, 881–891, doi:10.1111/gcb.12077,
10
2012.
Conway, T. J., Tans, P. P., Waterman, L. S., Thoning, K. W., Kitzis, D. R., Masarie, K. A., and Zhang, N.: Evidence for interannual variability of the carbon cycle from the National Oceanic and Atmospheric Administration/Climate Monitoring and Diagnostics Laboratory global air sampling network, J. Geophys. Res., 99, 22831–22855, 1994.
15
Czeplak, G. and Junge, C.: Studies of interhemispheric exchange in the troposphere by a dif-fusion model, Adv. Geophys., 18, 57–72, 1974.
DOE US: Carbon cycling and biosequestration: integrating biology and climate through sys-tems science: report from the March 2008 workshop, DOE/SC-108, US Department of En-ergy Office of Science, available at: http://genomicscience.energy.gov/carboncycle/report/
20
(last access: 26 June 2014), 2008.
Fang, S. X., Zhou, L. X., Tans, P. P., Ciais, P., Steinbacher, M., Xu, L., and Luan, T.: In situ measurement of atmospheric CO2at the four WMO/GAW stations in China, Atmos. Chem. Phys., 14, 2541–2554, doi:10.5194/acp-14-2541-2014, 2014.
Francey, R. J., Trudinger, C. M., Van Der Schoot, M., Krummel, P. B., Steele, L. P., and
Langen-25
felds, R. L.: Differences between trends in atmospheric CO2and the reported trends in an-thropogenic CO2emissions, Tellus B, 62, 316–328, doi:10.1111/j.1600-0889.2010.00472.x, 2010.
Graven, H. D., Keeling, R. F., Piper, S. C., Patra, P. K., Stephens, B. B., Wofsy, S. C., Welp, L. R., Sweeney, C., Tans, P. P., Kelley, J. J., Daube, B. C., Kort, E. A., Santoni, G. W., and Bent, J. D.:
30
ESDD
5, 809–848, 2014Temporal variations in atmospheric CO2
on Rishiri Island in 2006–2013
C. Zhu and H. Yoshikawa-Inoue
Title Page
Abstract Introduction
Conclusions References
Tables Figures
◭ ◮
◭ ◮
Back Close
Full Screen / Esc
Printer-friendly Version Interactive Discussion
Discussion
P
a
per
|
Discus
sion
P
a
per
|
Discussion
P
a
per
|
Discussion
P
a
per
|
Haszpra, L., Barcza, Z., Hidy, D., Szilágyi, I., Dlugokencky, E., and Tans, P.: Trends and temporal variations of major greenhouse gases at a rural site in Central Europe, Atmos. Environ., 42, 8707–8716, doi:10.1016/j.atmosenv.2008.09.012, 2008.
Higuchi, K., Murayama, S., and Taguchi, S.: Quasi-decadal variation of the atmospheric CO2 seasonal cycle due to atmospheric circulation changes: 1979–1998, Geophys. Res. Lett.,
5
29, 1173, doi:10.1029/2001GL013751, 2002.
Hui, D., Luo, Y., and Katul, G.: Parititioning interannual variability in net ecosystem exchange between climatic variability and functional change, Tree Physiol., 23, 433–442, 2003. Hurrell, J.: National Center for Atmospheric Research, The Climate Data Guide:
North Pacific (NP) Index by Trenberth and Hurrell; monthly and winter, last
10
modified 20 November 2013, available at: https://climatedataguide.ucar.edu/ climate-data/north-pacific-np-index-trenberth-and-hurrell-monthly-and-winter (last ac-cess: 18 March 2014), 2013.
Inoue, H. Y. and Matsueda, H.: Measurements of atmospheric CO2from a meteorological tower in Tsukuba, Japan, Tellus B, 53, 205–219, 2001.
15
Inoue, H. Y., Fukazawa, Y., Tanimoto, H., Matsueda, H., Sawa, Y., and Wada, A.: Atmospheric CO2and O3observed on Rishiri Island from December 2006 to March 2007, Pap. Meteorol. Geophys., 59, 31–38, 2008.
Ito, A.: Decadal variability in the terrestrial carbon budget caused by the Pacific Decadal Oscil-lation and Atlantic Multidecadal OscilOscil-lation, J. Meteorol. Soc. Jpn., 89, 441–454, 2011.
20
Janssens, I. A., Lankreijer, H., Matteucci, G., Kowalski, A. S., Buchmann, N., Epron, D., Pile-gaard, K., Kutsch, W., Longdoz, B., Grünwald, T., Montagnani, L., Dore, S., Rebmann, C., Moors, E. J., Grelle, A., Rannik, Ü., Morgenstern, K., Oltchev, S., Clement, R., Guðmunds-son, J., Minerbi, S., Berbigier, P., Ibrom, A., Moncrieff, J., Aubinet, M., Bernhofer, C., Jensen, N. O., Vesala, T., Granier, A., Schulze, E.-D., Lindroth, A., Dolman, A. J., Jarvis, P. G.,
25
Ceulemans, R., and Valentini, R.: Productivity overshadows temperature in determining soil and ecosystem respiration across European forests, Global Change Biol., 7, 269–278, doi:10.1046/j.1365-2486.2001.00412.x, 2001.
Jeong, S. J., Ho, C. H., Gim, H. J., and Brown, M. E.: Phenology shifts at start vs. end of growing season in temperate vegetation over the Northern Hemisphere for the period 1982–
30
2008, Global Change Biol., 17, 2385–2399, 2011.
ESDD
5, 809–848, 2014Temporal variations in atmospheric CO2
on Rishiri Island in 2006–2013
C. Zhu and H. Yoshikawa-Inoue
Title Page
Abstract Introduction
Conclusions References
Tables Figures
◭ ◮
◭ ◮
Back Close
Full Screen / Esc
Printer-friendly Version Interactive Discussion
Discussion
P
a
per
|
Discus
sion
P
a
per
|
Discussion
P
a
per
|
Discussion
P
a
per
Keeling, C. D.: The concentration and isotopic abundances of carbon dioxide in the atmosphere, Tellus, 12, 200–203, 1960.
Keeling, C. D., Bacastow, R. B., Carter, A. F., Piper, S. C., Whorf, T. P., Heimann, M., Mook, W. G., and Roeloffzen, H.: A three-dimensional model of atmospheric CO2transport based on observed winds: 1. Analysis of observational data, in: Aspects of Climate Variability
5
in the Pacific and the Western Americas, edited by: Peterson, D. H., Geophys. Monogr. Ser., 55, 165–235, 1989.
Keeling, C. D., Chin, J. F. S., and Whorf, T. P.: Increased activity of northern vegetation inferred from atmospheric CO2measurements, Nature, 382, 146–148, 1996.
Keeling, C. D., Piper, S. C., Whorf, T. P., and Keeling, R. F.: Evolution of natural and
anthro-10
pogenic fluxes of atmospheric CO2from 1957 to 2003, Tellus B, 63, 1–22, 2011.
Kimoto, M.: Simulated change of the east Asian circulation under global warming scenario, Geophys. Res. Lett., 32, L16701, doi:10.1029/2005GL023383, 2005.
Komhyr, W. D., Gammon, R. H., Harris, T. B., Waterman, L. S., Conway, T. J., Taylor, W. R., and Thoning, K. W.: Global atmospheric CO2 distribution and variations from 1968–1982
15
NOAA/GMCC CO2flask sample data, J. Geophys. Res., 90, 5567–5596, 1985.
Lee, K., Wanninkhof, R., Takahashi, T., Doney, S. C., and Feely, R. A.: Low interannual variability in recent oceanic uptake of atmospheric carbon dioxide, Nature, 396, 155–159, 1998. Lefsky, M. A.: A global forest canopy height map from the Moderate Resolution Imaging
Spec-troradiometer and the Geoscience Laser Altimeter System, Geophys. Res. Lett., 37, L15401,
20
doi:10.1029/2010GL043622, 2010.
Levin, I., Graul, R., and Trivett, N. B. A.: Long-term observations of atmospheric CO2 and carbon isotopes at continental sites in Germany, Tellus B, 47, 23–34, 1995.
Lintner, B. R., Buermann, W., Koven, C. D., and Fung, I. Y.: Seasonal circulation and Mauna Loa CO2variability, J. Geophys. Res., 111, D13104, doi:10.1029/2005JD006535, 2006.
25
Mahecha, M. D., Reichstein, M., Carvalhais, N., Lasslop, G., Lange, H., Seneviratne, S. I., Vargas, R., Ammann, C., Arain, M. A., Cescatti, A., Janssens, I. A., Migliavacca, M., Mon-tagnani, L., and Richardson, A. D.: Global convergence in the temperature sensitivity of res-piration at ecosystem level, Science, 329, 838–840, doi:10.1126/science.1189587, 2010. Maksyutov, S., Takagi, H., Valsala, V. K., Saito, M., Oda, T., Saeki, T., Belikov, D. A., Saito, R.,
30
ESDD
5, 809–848, 2014Temporal variations in atmospheric CO2
on Rishiri Island in 2006–2013
C. Zhu and H. Yoshikawa-Inoue
Title Page
Abstract Introduction
Conclusions References
Tables Figures
◭ ◮
◭ ◮
Back Close
Full Screen / Esc
Printer-friendly Version Interactive Discussion
Discussion
P
a
per
|
Discus
sion
P
a
per
|
Discussion
P
a
per
|
Discussion
P
a
per
|
Minejima, C., Kubo, M., Tohjima, Y., Yamagishi, H., Koyama, Y., Maksyutov, S., Kita, K., and Mukai, H.: Analysis of∆O2/∆CO2ratios for the pollution events observed at Hateruma Island, Japan, Atmos. Chem. Phys., 12, 2713–2723, doi:10.5194/acp-12-2713-2012, 2012.
Monson, R. K., Lipson, D. L., Burns, S. P., Turnipseed, A. A., Delany, A. C., Williams, M. W., and Schmidt, S. K.: Winter forest soil respiration controlled by climate and microbial community
5
composition, Nature, 439, 711–714, 2006.
Murayama, S., Saigusa, N., Chan, D., Yamamoto, S., Kondo, H., and Eguchi, Y.: Temporal vari-ations of atmospheric CO2concentration in a temperate deciduous forest in central Japan, Tellus B, 55, 232–243, doi:10.1034/j.1600-0889.2003.00061.x, 2003.
Murayama, S., Higuchi, K., and Taguchi, S.: Influence of atmospheric transport on the
inter-10
annual variation of the CO2 seasonal cycle downward zero-crossing, Geophys. Res. Lett., 34, L04811, doi:10.1029/2006GL028389, 2007.
Myhre, G., Shindell, D., Bréon, F.-M., Collins, W., Fuglestvedt, J., Huang, J., Koch, D., Lamar-que, J.-F., Lee, D., Mendoza, B., Nakajima, T., Robock, A., Stephens, G., Takemura, T., and Zhang, H.: Anthropogenic and Natural Radiative Forcing, in: Climate Change 2013: The
15
Physical Science Basis, Contribution of Working Group I to the Fifth Assessment Report of the Intergovernmental Panel on Climate Change, edited by: Stocker, T. F., Qin, D., Plat-tner, G.-K., Tignor, M., Allen, S. K., Boschung, J., Nauels, A., Xia, Y., Bex, V., and Midg-ley, P. M., Cambridge University Press, Cambridge, UK and New York, NY, USA, 2013. Myneni, R. B., Dong, J., Tucker, C. J., Kaufmann, R. K., Kauppi, P. E., Liski, J., Zhou, L.,
Alex-20
eyev, V., and Hughes, M. K.: A large carbon sink in the woody biomass of northern forests, P. Natl. Acad. Sci. USA, 98, 14784–14789, 2001.
Nisbet, E. and Weiss, R.: Top-down versus bottom-up, Science, 328, 1241, doi:doi:10.1126/science.1189936, 2010.
Nishina, K., Ito, A., Beerling, D. J., Cadule, P., Ciais, P., Clark, D. B., Falloon, P., Friend, A. D.,
25
Kahana, R., Kato, E., Keribin, R., Lucht, W., Lomas, M., Rademacher, T. T., Pavlick, R., Schaphoff, S., Vuichard, N., Warszawaski, L., and Yokohata, T.: Quantifying uncertainties in soil carbon responses to changes in global mean temperature and precipitation, Earth Syst. Dynam., 5, 197–209, doi:10.5194/esd-5-197-2014, 2014.
Niwa, Y., Patra, P. K., Sawa, Y., Machida, T., Matsueda, H., Belikov, D., Maki, T., Ikegami, M.,
30
ESDD
5, 809–848, 2014Temporal variations in atmospheric CO2
on Rishiri Island in 2006–2013
C. Zhu and H. Yoshikawa-Inoue
Title Page
Abstract Introduction
Conclusions References
Tables Figures
◭ ◮
◭ ◮
Back Close
Full Screen / Esc
Printer-friendly Version Interactive Discussion
Discussion
P
a
per
|
Discus
sion
P
a
per
|
Discussion
P
a
per
|
Discussion
P
a
per
Niwa, Y., Machida, T., Sawa, Y., Matsueda, H., Schuck, T. J., Brenninkmeijer, C. A. M., Imasu, R., and Satoh, M.: Imposing strong constraints on tropical terrestrial CO2 fluxes using passenger aircraft based measurements, J. Geophys. Res., 117, D11303, doi:10.1029/2012JD017474, 2012.
Niwa, Y., Tsuboi, K., Matsueda, H., Sawa, Y., Machida, T., Nakamura, M., Kawasato, T.,
5
Saito, K., Takatsuji, S., Tsuji, K., Nishi, H., Dehara, K., Baba, Y., Kuboike, D., Iwatsubo, S., Ohmori, H., and Hanamiya, Y.: Seasonal variations of CO2, CH4, N2O and CO in the mid-troposphere over the Western North Pacific observed using a C-130H Cargo Aircraft, J. Meteorol. Soc. Jpn., 92, 55–70, doi:10.2151/jmsj.2014-104, 2014.
NOAA Earth System Research Laboratory: The NOAA annual greenhouse gas index (AGGI),
10
available at: http://www.esrl.noaa.gov/gmd/aggi/, last access: 18 March 2014.
Patra, P. K., Ishizawa, M., Maksyutov, S., Nakazawa, T., and Inoue, G.: Role of biomass burning and climate anomalies for land–atmosphere carbon fluxes based on inverse modeling of at-mospheric CO2, Global Biogeochem. Cy., 19, GB3005, doi:10.1029/2004GB002258, 2005. Patra, P. K., Niwa, Y., Schuck, T. J., Brenninkmeijer, C. A. M., Machida, T., Matsueda, H., and
15
Sawa, Y.: Carbon balance of South Asia constrained by passenger aircraft CO2 measure-ments, Atmos. Chem. Phys., 11, 4163–4175, doi:10.5194/acp-11-4163-2011, 2011.
Peters, W., Jacobson, A. R., Sweeney, C., Andrews, A. E., Conway, T. J., Masarie, K., Miller, J. B., Bruhwiler, L. M. P., P’etron, G., Hirsch, A. I., Worthy, D. E. J., van der Werf, G. R., Randerson, J. T., Wennberg, P. O., Krol, M. C., and Tans, P. P.: An atmospheric perspective
20
on North American carbon dioxide exchange: CarbonTracker, P. Natl. Acad. Sci. USA, 104, 18925–18930, 2007.
Peters, W., Krol, M. C., Van Der Werf, G. R., Houweling, S., Jones, C. D., Hughes, J., Schae-fer, K., Masarie, K. A., Jacobson, A. R., Miller, J. B., Cho, C. H., Ramonet, M., Schmidt, M., Ciattaglia, L., Apadula, F., Heltai, D., Meinhardt, F., Di Sarra, A. G., Piacentino, S.,
Sfer-25
lazzo, D., Aalto, T., Hatakka, J., Ström, J., Haszpra, L., Meijer, H. A. J., Van Der Laan, S., Neubert, R. E. M., Jordan, A., Rodó, X., Morguí, J.-A., Vermeulen, A. T., Popa, E., Rozan-ski, K., Zimnoch, M., Manning, A. C., Leuenberger, M., Uglietti, C., Dolman, A. J., Ciais, P., Heimann, M., and Tans, P. P.: Seven years of recent European net terrestrial carbon dioxide exchange constrained by atmospheric observations, Global Change Biol., 16, 1317–1337,
30
doi:10.1111/j.1365-2486.2009.02078.x, 2010.
ESDD
5, 809–848, 2014Temporal variations in atmospheric CO2
on Rishiri Island in 2006–2013
C. Zhu and H. Yoshikawa-Inoue
Title Page
Abstract Introduction
Conclusions References
Tables Figures
◭ ◮
◭ ◮
Back Close
Full Screen / Esc
Printer-friendly Version Interactive Discussion
Discussion
P
a
per
|
Discus
sion
P
a
per
|
Discussion
P
a
per
|
Discussion
P
a
per
|
Peylin, P., Law, R. M., Gurney, K. R., Chevallier, F., Jacobson, A. R., Maki, T., Niwa, Y., Pa-tra, P. K., Peters, W., Rayner, P. J., Rödenbeck, C., van der Laan-Luijkx, I. T., and Zhang, X.: Global atmospheric carbon budget: results from an ensemble of atmospheric CO2inversions, Biogeosciences, 10, 6699–6720, doi:10.5194/bg-10-6699-2013, 2013.
Piao, S., Friedlingstein, P., Ciais, P., Viovy, N., and Demarty, J.: Growing season extension and
5
its effects on terrestrial carbon flux over the last two decades, Global Biogeochem. Cy., 21, GB3018, doi:10.1029/2006GB002888, 2007.
Piao, S., Wang, X., Ciais, P., Zhu, B., Wang, T., and Liu, J.: Changes in satellite-derived vegeta-tion growth trend in temperate and boreal Eurasia from 1982 to 2006, Global Change Biol., 17, 3228–3239, doi:10.1111/j.1365-2486.2011.02419.x, 2011.
10
Prytherch, J., Yelland, M. J., Pascal, R. W., Moat, B. I., Skjelvan, I., and Neill, C. C.: Direct measurements of the CO2 flux over the ocean: development of a novel method, Geophys. Res. Lett., 37, L03607, doi:10.1029/2009GL041482, 2010.
Ramonet, M., Ciais, P., Aalto, T., Aulagnier, C., Chevallier, F., Cipriano, D., Conway, T. J., Haszpra, L., Kazan, V., Meinhardt, F., Paris, J.-D., Schmidt, M., Simmonds, P.,
Xueref-15
Rémy, I., and Necki, J. N.: A recent build-up of atmospheric CO2 over Europe, Part 1: Ob-served signals and possible explanations, Tellus B, 62, 1–13, 2010.
Richardson, A. D., Black, T. A., Ciais, P., Delbart, N., Friedl, M. A., Gobron, N., Hollinger, D. Y., Kutsch, W. L., Longdoz, B., Luyssaert, S., Migliavacca, M., Montagnani, L., Munger, J. W., Moors, E., Piao, S. L., Rebmann, C., Reichstein, M., Saigusa, N., Tomelleri, E., Vargas, R.,
20
and Varlagin, A.: Influence of spring and autumn phonological transitions on forest ecosys-tem productivity, Philos. T. Roy. Soc. B, 365, 3227–3246, 2010.
Rödenbeck, C., Gerbig, C., Trusilova, K., and Heimann, M.: A two-step scheme for high-resolution regional atmospheric trace gas inversions based on independent models, Atmos. Chem. Phys., 9, 5331–5342, doi:10.5194/acp-9-5331-2009, 2009.
25
Saha, S., Moorthi, S., Pan, H.-L., Wu, X., Wang, J., Nadiga, S., Tripp, P., Kistler, R., Woollen, J., and Behringer, D.: The NCEP climate forecast system reanalysis, B. Am. Meteorol. Soc., 91, 1015–1057, doi:10.1175/2010BAMS3001.1, 2010.
Saigusa, N., Ichii, K., Murakami, H., Hirata, R., Asanuma, J., Den, H., Han, J., Ide, R., Li, S.-G., Ohta, T., Sasai, T., Wang, S.-Q., and Yu, G.-R.: Impact of meteorological anomalies in
30
ESDD
5, 809–848, 2014Temporal variations in atmospheric CO2
on Rishiri Island in 2006–2013
C. Zhu and H. Yoshikawa-Inoue
Title Page
Abstract Introduction
Conclusions References
Tables Figures
◭ ◮
◭ ◮
Back Close
Full Screen / Esc
Printer-friendly Version Interactive Discussion
Discussion
P
a
per
|
Discus
sion
P
a
per
|
Discussion
P
a
per
|
Discussion
P
a
per
Séférian, R., Bopp, L., Swingedouw, D., and Servonnat, J.: Dynamical and biogeochemical control on the decadal variability of ocean carbon fluxes, Earth Syst. Dynam., 4, 109–127, doi:10.5194/esd-4-109-2013, 2013.
Teklemariam, T. A., Lafleur, P. M., Moore, T. R., Roulet, N. T., and Humphreys, E. R.: The direct and indirect effects of inter-annual meteorological variability on ecosystem carbon dioxide
5
exchange at a temperate ombrotrophic bog, Agr. Forest Meteorol., 150, 1402–1411, 2010. Tans, P. and Keeling, R.: NOAA/ESRL site, available at: http://www.esrl.noaa.gov/gmd/ccgg/
trends/, last access: 3 April 2014.
Thoning, K. W., Tans, P. P., and Komhyr, W. D.: Atmospheric carbon dioxide at Mauna Loa Observatory: 2. Analysis of the NOAA/GMCC data, 1974–1985, J. Geophys. Res., 94, 8549–
10
8565, 1989.
Wang, X., Piao, S., Ciais, P., Friedlingstein, P., Myneni, R. B., Cox, P., Heimann, M., Miller, J., Peng, S., Wang, T., Yang, H., and Chen, A.: A two-fold increase of carbon cycle sensitivity to tropical temperature variations, Nature, 506, 212–215, doi:10.1038/nature12915, 2014. Wayne Polley, H., Frank, A. B., Sanabria, J., and Phillips, R. L.: Interannual variability in carbon
15
dioxide fluxes and flux–climate relationships on grazed and ungrazed northern mixed-grass prairie, Global Change Biol., 14, 1620–1632, doi:10.1111/j.1365-2486.2008.01599.x, 2008. WMO: Executive Council, forty-fourth session, Geneva, 22 June–4 July 1992: abridged report
with resolutions, World Meteorological Organization, Geneva, Switzerland, 1992.
WMO: World Meteorological Organization – World Data Centre for Greenhouse Gases
(WD-20
CGG) Data Summary: Greenhouse Gases and Other Atmospheric Gases, No. 37, Japan Meteorological Agency, available at: http://ds.data.jma.go.jp/gmd/wdcgg/pub/products/ summary/sum37/sum37.pdf (last access: 18 March 2014), 2013.
Wu, X. and Liu, H.: Consistent shifts in spring vegetation green-up date across temperate biomes in China, 1982–2006, Global Change Biol., 19, 870–880, doi:10.1111/gcb.12086,
25
2012.
Wunch, D., Wennberg, P. O., Messerschmidt, J., Parazoo, N. C., Toon, G. C., Deutscher, N. M., Keppel-Aleks, G., Roehl, C. M., Randerson, J. T., Warneke, T., and Notholt, J.: The covaria-tion of Northern Hemisphere summertime CO2 with surface temperature in boreal regions, Atmos. Chem. Phys., 13, 9447–9459, doi:10.5194/acp-13-9447-2013, 2013.