Rev Bras
Cineantropom
Hum
DOI: http://dx.doi.org/10.5007/1980-0037.2017v19n4p395
original article
Is the internal training load different between
starters and nonstarters volleyball players
submitted to the same external load training?
A case study
A carga interna de treinamento é diferente entre atletas
de voleibol titulares e reservas? Um estudo de caso.
Thiago Andrade Goulart Horta1
Danilo Reis Coimbra2
Renato Miranda1
Francisco Zacaron Werneck3
Maurício Gattás Bara Filho1
Abstract – he same training stimulus can provide diferent physiological adaptations for athletes of the same team. hus, the aim of this study was to analyze and compare the load training of starters and nonstarters players, athletes of a men’s volleyball team at diferent times of the season. he sample consisted of ifteen men’s volleyball superleague athletes who were divided into two groups of starters and nonstarters players. he train-ing load of the ten weeks of the team’s preparation period for the main championship season in which no games were performed was selected for the study. he method of subjective perceived of efort (session-RPE) proposed by Foster et al. (2001) was used to quantify the training load. he group of starters players had higher total weekly train-ing load (TWTL) and RPE values in the average of the ten weeks of traintrain-ing (p<0.05). Higher TWTL values for starters players in the preparatory and pre-competitive period compared to nonstarters players was also demonstrated (p<0.05). When diferent weeks were analyzed separately, weeks three and seven presented higher TWTL and RPE values for starters players compared with nonstarters players (p<0.05). he results presented in this study showed that starters players showed greater internal training load compared to nonstarters players.
Key words: Athletes; Training; Volleyball.
Resumo – O mesmo estímulo de treinamento pode proporcionar diferentes adaptações isiológicas para os atletas de uma mesma equipe. Dessa forma, o objetivo do estudo foi analisar e comparar as cargas de treinamento de atletas titulares e reservas de uma equipe de voleibol masculino em diferentes períodos da temporada. A amostra foi composta por quinze atletas da superliga masculina de vôlei que foram divididos em dois grupos de titulares e reservas. A carga de trei-namento de dez semanas pertencentes ao período de preparação da equipe para o campeonato principal da temporada em que não houve a realização de jogos foi selecionada para o estudo. Foi utilizado para a quantiicação da carga de treinamento o método da percepção subjetiva do esforço da sessão (PSE) proposto por Foster et al. (2001). O Grupo titular apresentou maiores valores de carga de treinamento semanal total (CTST) e de PSE na média das 10 semanas de treinamento (p<0,05). Foi demonstrado também maior valor de CTST para os titulares no período preparatório e competitivo em relação aos reservas (p<0,05). Quando as diferentes semanas foram analisadas separadamente, a semana 3 e 7 apresentaram a CTST e a PSE maiores para os titulares comparado com os reservas (p<0,05). Os resultados apresentados pelo presente estudo mostraram que atletas considerados titulares apresentaram maior carga interna
1 Federal University of Juiz de Fora. School of Physical Education and Sports. Juiz de Fora, MG. Brazil.
2 University of the State of Santa Catarina. Department of Health Sciences. Department of Health Sciences and Sports. Florianópolis, SC. Brazil.
3 Federal University of Ouro Preto. Sports Center - Laboratory of Stu-dies and Research of Exercise and Sports. Ouro Preto, MG, Brazil.
INTRODUCTION
Volleyball is an intermittent sport modality with moments of explosive efort interspersed with short periods of recovery1,2. From the start of the
rally with the service until the end of it, there is an average period of 4 to 10 seconds3. Considering the limited size of the volleyball court4, players
cover relatively long distances during a game, reaching 1757 ± 462 meters in a 4-set game. hese eforts are manifested through short high speed races, dives and jumps in diferent directions of the game court, requiring high demand of the neuromuscular system1. With these actions occurring
repeatedly throughout the game with an average duration of approximately 90 minutes, the volleyball athlete needs to have well-developed anaerobic alactic system through the ATP-CP system, as well as a good development of the aerobic oxidative system1. hus physical itness, components such as
velocity, agility, power of lower and upper limbs and also maximal aerobic power, are of fundamental importance for volleyball athletes2.
Positions in volleyball are deined by setters, right side hitters, outside hitter (opposite), middle blocker and libero, with each of the positions having speciic functions and movements during the game5. Sheppard
et al.1, for example, identiied diferent frequencies of attack and block
jumps per set in Olympic and International level volleyball games, as well as anthropometric diferences between athletes of diferent functions. Despite the diferences manifested by each position in volleyball, athletes generally present high stature and considerable body mass, with the major-ity presenting ectomorphic traits as a body characteristic of somatotype6.
hus, for volleyball athletes to be in optimal conditions for the perfor-mance of their functions, the process of systematic training and monitoring of activities is of fundamental importance to achieve sporting success7. As
in other sporting modalities, monitoring volleyball training loads is critical to assessing the consistency of planned and executed loads. According to Impellizeri et al.8, the external load is the prescribed training (time, distance
traveled, number of jumps, speed) and internal load is the psychophysiologi-cal efort of the athlete to perform a certain external training load (heart rate, rating of perceived exertion, lactate concentration). In this sense, internal load monitoring can promote positive efects (increase in performance) and reduce negative efects (fatigue, nonfunctional overreaching, and injuries).
Recently, diferent methods have been proposed for the monitoring of training loads in collective sports such as: heart rate monitoring; lactate blood concentration; monitoring of the distance traveled by GPS (global positioning satellite system) and accelerometers; rating of perceived exer-tion3,9,10,11. However, some of the aforementioned training monitoring
methods may not be practical to use in a daily training routine. In this sense, the rating of perceived exertion (session-RPE proposed by Foster et al.12) stands out as a simple and practical method to monitor the internal
his method has been studied in collective sports7,14,15,16 and is valid for
monitoring the internal load in volleyball athletes14,16,17.
Basically, session-RPE represents a subjective measurement evaluation after the exercise session, which relects the psychophysical response gener-ated and stored in the central nervous system, due to the eferent neural impulses coming from the motor cortex12,18,19. RPE can also be deined
as a conscious sensation of task intensity, with sensory activation of some areas of the brain related to proprioception, pain and thermal discomfort21.
Recent studies have investigated factors that may be directly related to the rating of perceived exertion, such as number of motor actions, techniques and speciic characteristics of some sports modalities17,22.
A peculiar characteristic of collective sports is the division of teams in relation to being starters or nonstarters players. From games and training sessions, a starter team is formed, with only occasional changes occurring throughout the season22-25. he search for a place in the starters team
can promote an internal competition during the training and games of the competitive season to consolidate the position in the starters team. his can cause athletes from the same team to perform the same external training load with diferent efort. Kraemer et al.25 identiied diferences
between starters and nonstarters players and reported that there are few research studies between starters and nonstarters soccer players regarding physiological and performance parameters. In another study, Caterisano et al.22 also identiied diferences between starters and nonstarters basketball
players. According to the authors, a possible explanation for these results would be related to diferences in the time of exposure to games of the season by starters and nonstarters players22,25.
his makes us think if there is any diference in the rating of perceived exertion of the training session by players who gain the position of starters compared to the other players of the team. Factors such as physical itness level, psychophysiological status and stress tolerance associated with the way the athlete manages to deal with stressors inherent to training are also identiied as possible inluencers of the internal training load23. Moreover,
factors such as the team’s characteristic, opponent’s level, player’s position, technical ability and speciic abilities are analyzed by coaches at the mo-ment of deining the irst team24. hus, the aim of the present study was
to analyze the training loads of starters and nonstarters players of a male volleyball team and compare these groups in diferent periods of the season.
METHODOLOGICAL PROCEDURES
Sample
Athletes were divided into two groups: starters players (7 players aged 25.9 ± 3.8 years, 100.8 ± 9.8 kg, 194.0 ± 5.8 cm and 8.0 ± 1.4% fat) and nonstarters players (8 players aged 23.1 ± 3.1 years, 93.4 ± 8.0 kg, 194.6 ± 7.7 cm and 6.0 ± 2.0% fat). he study was approved by the local Ethics Committee under opinion No. 036159/2013. he athletes attested the voluntary participation allowing the use and disclosure of information.
Procedures
On the irst day of the training season, athletes were submitted to medical and anthropometric evaluation. he irst training activity occurred the next day consisting of resistance training with weights and speciic technical training in the volleyball court. Monitoring of the training load began on the same day after familiarization with the method. hese athletes were monitored during the initial 20 weeks of training using the Session Rating of perceived exertion (session-RPE) method proposed by Foster et al.12.
Among these 20 weeks, 10 were excluded, having as criterion the existence of friendly and oicial games (state and regional championships), and the team performed a total of 24 games in the analyzed period. In this way, 10 weeks were selected (W1, W2, W3, W4, W5, W7, W13, W14, W15 and W19) where only training sessions occurred.
During weeks from W1 to W5, the starters team was not deined. his period was planned and deined as preparatory. From W6 week, when the team began to participate in games (competitive period), the starters team was deined. hus, data analysis during all 10 weeks, stratifying starters and nonstarters players, was based on the athletes’ position from week W6.
Athletes who started matches in more than 65% of the games played were considered as a criterion for deinition of the starters team. Athletes who had less than 65% of the games played as starters were considered nonstarters players. It is important to point out that of the seven starters athletes, four of them achieved a percentage of 80% of games in the ana-lyzed period with the other starters athletes having lower percentages but over 65% of the total games played.
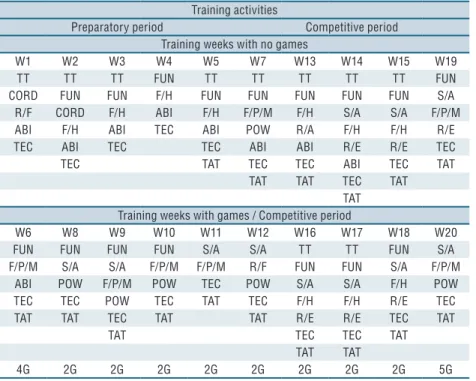
Training program
program and the spatial distribution of the diferent objectives over the two periods analyzed, as well as the number of games performed during the competitive period, are shown in Table 1.
Table 1. Training description in the period analyzed
Training activities
Preparatory period Competitive period Training weeks with no games
W1 W2 W3 W4 W5 W7 W13 W14 W15 W19
TT TT TT FUN TT TT TT TT TT FUN
CORD FUN FUN F/H FUN FUN FUN FUN FUN S/A
R/F CORD F/H ABI F/H F/P/M F/H S/A S/A F/P/M
ABI F/H ABI TEC ABI POW R/A F/H F/H R/E
TEC ABI TEC TEC ABI ABI R/E R/E TEC
TEC TAT TEC TEC ABI TEC TAT
TAT TAT TEC TAT
TAT Training weeks with games / Competitive period
W6 W8 W9 W10 W11 W12 W16 W17 W18 W20
FUN FUN FUN FUN S/A S/A TT TT FUN S/A
F/P/M S/A S/A F/P/M F/P/M R/F FUN FUN S/A F/P/M
ABI POW F/P/M POW TEC POW S/A S/A F/H POW
TEC TEC POW TEC TAT TEC F/H F/H R/E TEC
TAT TAT TEC TAT TAT R/E R/E TEC TAT
TAT TEC TEC TAT
TAT TAT
4G 2G 2G 2G 2G 2G 2G 2G 2G 5G
W = week; TT = tests; CORD = coordination; R / F = force resistance; HAB = ability; TEC = technical; FUN = functional; F / H = hypertrophic force; TAT = tactical; F / P / M = pure / mixed force; POT = power; R / A = aerobic resistance; S / A = speed / agility; R / E = special resistance; G = game.
Training load quantiication
In order to quantify the internal training load of Starters and Nonstart-ers teams, the rating of perceived exertion (RPE) method was used. his method consists of responding 30 minutes after the end of the session to the following question: “How was your training session?” he response is provided through the CR10 scale proposed by Borg in 1982 and modi-ied by Foster et al.19, which ranges from 0 (rest) to 10 (maximum efort).
According to Foster et al.19, athletes respond in relation to their rating of
Statistical analysis
Data were presented as mean ± standard error. Assumptions of normality and homoscedasticity of data were evaluated by the Shapiro-Wilk test and the Levene test, respectively. Once the parametric assumptions were met, the diference of TWTL means between starters and nonstarters players was tested using one-way ANOVA of repeated measurements, followed by the multiple comparisons of means with Bonferroni correction. To detect in which weeks diferences occurred, Student’s t-test for independ-ent samples was used. he diference of RPE means and training volume separately between starters players and nonstarters players was also tested using ANOVA for repeated measures. he efect size was calculated by Cohen’s d. All analyses were performed using SPSS software v.19 (SPSS Inc, Chicago, IL), considering signiicance level of 5% (p ≤ 0.05).
RESULTS
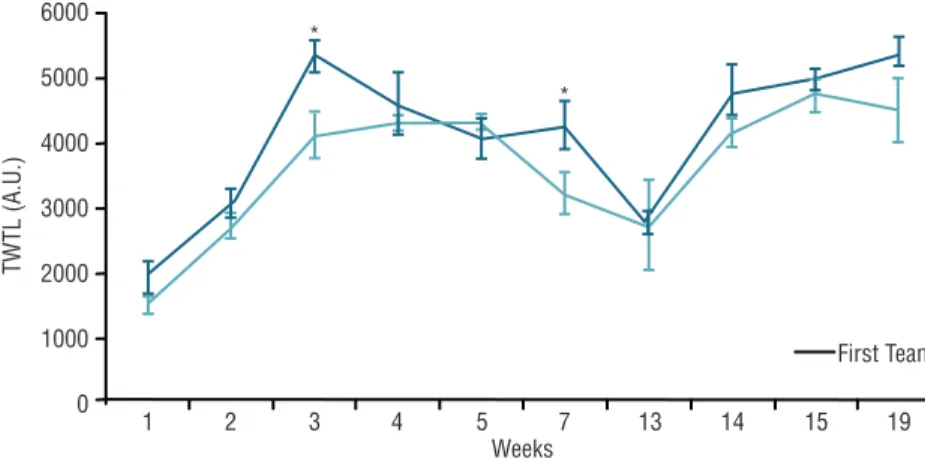
In the analysis of the 10 training weeks, a signiicant efect was observed for the repeated measure factor (F9.117 = 24.781, p <0.001) and for the factor being starters player or not (F1.13 = 6.625, p = 0.02). he behavior of TWTL of the 10 weeks analyzed in the study is presented in igure 1. Over the 10 weeks, starters players presented higher TWTL when compared to nonstarters players (4.132 ± 140 vs. 3.636 ± 131 AU, p = 0.02, TE = 3.66). In the multiple comparisons of means, there was a signiicant interaction between starters players and nonstarters players in the week 3 of the pre-paratory period and in the week 7 of the competitive period (Figure 1).
Figure 1. Mean ± standard error of the total weekly training load (TWTL) of starters (First Team)
and nonstarters athletes over 10 weeks of training. * Significant difference between starter and nonstarters players (p <0.05).
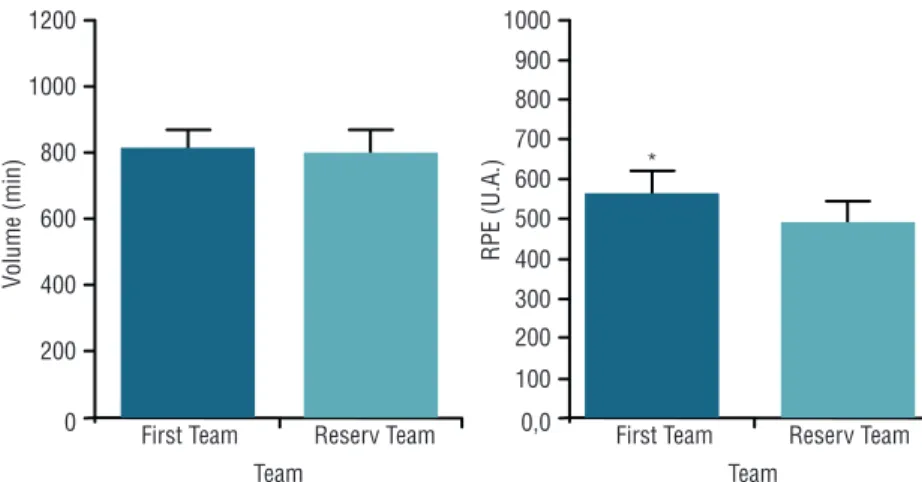
Figure 2. Mean ± standard error of the volume (minutes) and RPE of sessions of starters players
(First Team) and nonstarters players (Reserve Team) during the 10 weeks of training analyzed. * Significant difference between starters and nonstarters players (p <0.05).
On average, higher internal load values were observed for the irst team when compared to reserve team both before the deinition of the starters team (Week 3: 5.370 ± 320 vs. 4,130 ± 300 AU) and after the deinition (Week 7: 4,277 ± 354 vs. 3,232 ± 331 AU). It is interesting to note that even before the deinition, training period prior to week 6, the week that started the team’s competitive period, athletes who later came to be con-sidered starters presented higher training load values compared to athletes considered as nonstarters players, as shown in Figure 1.
In the analysis of the preparatory and competitive period, a signiicant efect was observed for the repeated measure factor (F1.13 = 12.364, p = 0.004) and for the factor being starters player or not (F1.13 = 6.625, p = 0.02). here was no signiicant interaction between weeks and being starters player or not (F1.13 = 0.268, p = 0.61). On average, starters players presented higher TWTL values in relation to nonstarters players in the preparatory period (3,806 ± 503 vs. 3,393 ± 284 AU) and in the competitive period (4,460 ± 528 vs. 3,879 ± 617 AU) (Figure 3).
Figure 3. Mean ± standard error of the total weekly training load (TWTL) of male starters (First
DISCUSSION
he main aim of the present study was to analyze the behavior of the internal load between starters and nonstarters players in the routine of high-performance volleyball training. It was found that starters athletes presented higher internal training load when compared to the group of athletes considered nonstarters players. his inding is reinforced by the fact that athletes received the same external training load over the weeks. In a way, this result corroborates the indings of other researchers, since athletes receiving the same external training load may present diferent internal loads 8. When comparing TWTL between starters and nonstarters
players, respectively, in the two periods analyzed, Preparatory (3.806 ± 503 vs. 3.393 ± 284 AU) and Competitive (4.460 ± 528 vs. 3,879 ± 617 AU), signiicant diferences were observed between groups in the present study. Impellizzeri et al.8 investigating methods of evaluating the internal load
in soccer, veriied that in a team receiving the same external load, athletes with higher internal loads recorded in the training had greater improve-ments in aerobic itness compared to athletes with lower internal loads.
We have no information about other studies that have analyzed the behavior of the internal load through the method of the rating of perceived exertion (RPE) between starters and nonstarters players in volleyball or in any other sport modality, making a direct discussion in relation to the training load more diicult. However, some studies have analyzed performance indicators and physiological markers between starters and nonstarters players of diferent sports modalities, presenting results that point to some speciicities in relation to this characterization of athletes in collective sports teams26,27.
In this context, Marques et al.26 observed during a competitive season
of volleyball players diference between starters and nonstarters players only in the maximum strength of the supine test for evaluation of the up-per limb strength, and no diference was found in the other tests analyzed (vertical jump test and Medicine Ball throw).
In Basketball, Gonzalez et al.27 observed changes in performance
be-tween starters and nonstarters players of the National Basketball League (NBA). he authors concluded that improvements in lower limb strength, repeated jumping ability, and reaction time during the season may be related to the playing time performed by starters players once the team received the same amount of external training load. Sampaio et al.28 analyzed a
Portuguese Professional Basketball League team and identiied that the greatest strength in the diferentiation between groups was related to de-fensive actions (fouls committed, and dede-fensive rebounds), and in the worst teams (teams not classiied for playofs), a greater number of diferentiation variables between the groups of athletes was found.
Kraemer et al.25 with athletes from the American Men’s College
performance were found only in starters athletes without diferences in relation to hormonal variables Testosterone and Cortisol. Caterisano et al.22 with University Basketball players observed increase of 1.1% in VO
2
max in starters athletes and decrease of 9.5% in VO2 max in nonstarters players over two seasons. Signiicant decrease in the strength of upper and lower limbs was presented by starters players, and the group of nonstarters players presented decrease only for the lower limbs.
Another important aspect is the technical issue between starters and nonstarters players of a team. his variable can often deine the situation of the athlete in relation to being starters player or not. In this sense, Gómez et al.24 analyzing data from the 2005 season of the National Women’s Basketball
Championship showed that athletes had more success in 2-point baskets, free throws, assists and defensive rebounds, and presented lower values of fouls com-mitted, in relation to nonstarters players. In addition to the technical aspects evidenced by results between starters and nonstarters players, starters athletes would have more conidence and tactical awareness about their performances, demonstrating the psychological factor involved in the selection of these athletes.
It is evident that the use of diferent methodologies in the attempt to compare physical parameters and speciic demands of the most diverse sports modalities in relation to being starters player present inconsistent results. It is possible that other factors, such as the intensity and accumu-lation that the sequences of games and competitions place on the body of starters athletes in their psychophysiological extension, have a direct inluence on the manifestation of positive or negative diferences when compared to nonstarters players, who consequently have lower volume of games. In our study, the group of athletes considered nonstarters players performed additional court training and physical training in order to bal-ance their demands with those of athletes who participated in the majority of games. Even though some types of training are similar to the game situation, a number of peculiar characteristics of the game may directly inluence the psychophysical state between starters and nonstarters players. According to Moreira et al.29, aspects of oicial competitions such as
pres-sure to achieve good results, the unpredictability of environments related to oicial matches, the importance of the game, among others, emerge as potential stressors characteristic of competitive games.
CONCLUSION
It could be concluded that starters players presented greater internal train-ing load in comparison to nonstarters players in all analyzed periods of the season, even in initial weeks in which the deinition of the starters team still did not occur. he result presented opens questions that cover a wide ield of investigations in the universe of training of collective sports teams. We believe that psychological, technical, physical characteristics, statistical performance results, coach evaluation, characteristics of opposing teams, economic power and level of team performance, are some of several possible factors that can inluence the diferentiation between starters and non-starters players of a sports team. his study was limited to analyzing only weeks with normal training routine, without games (friendly or oicial), or trips, considering that in these weeks, the training load was reduced by the technical commission due to the games. However, we understand that the weeks that were not monitored may have inluenced the adaptive responses of both starters and nonstarters players, so these results, although innovative, should be interpreted with caution.
Further studies are needed for future conirmations or not of this be-havioral training load pattern of volleyball and other modalities between starters and nonstarters players using the method of rating of perceived exertion (RPE) to quantify the internal load generated by athletes.
REFERENCES
1. Sheppard JM, Gabbett TJ, Stanganelli LR. Analysis of playing positions in ellite men’s volleyball: Considerations for competition demands and physiologic char-acteristics. J Strength Cond Res 2009;23(6):1858-66.
2. Gabbett T, Georgief B. Physiological and anthropometric characteristics of australian junior national, state, and novice volleyball players. J Strength Cond Res 2007;21(3):902-8.
3. Mroczek D, Januszkiewicz A, Kawczynski AS, Borysiuk Z, Chmura J. Analysis of male volleyball players’ motor activities during a top-level match. J Strength Cond Res 2014;28(8):2297-305.
4. Johnson TM, Brown LE, Coburn JW, Judelson DA, Khamoui AV, Tran TT, Uribe BP. Efect of four diferent starters stances on Sprint time in collegiate volleyball players. J Strength Cond Res 2010;24(10):2641-6.
5. Marques MC, Tillaar RVD, Gabbett TJ, Reis VM, Gonzalez-Badillo JJ. Physi-cal itness qualities of professional Volleyball players: determination of Positional diferences. J Strength Cond Res 2009;23(4):1-6.
6. Palao JM, Manzanares P, Valadés D. Anthropometric, physical, and age difer-ences by the player position and the performance level in volleyball. J Hum Kinet 2014;44(1):223-36.
7. Miloski B, Freitas VH, Nakamura FY, Nogueira FCA, Bara-Filho MG. Seasonal training load distribution of professional futsal players: efects on physical itness, muscle damage and hormonal status. J Strength Cond Res 2016;30(6):1525-33.
8. Impellizzeri FM, Rampinini E, Marcora SM. Physiological assessment of aerobic training in soccer. J Sports Sci 2005;23(6):583-92.
CORRESPONDING AUTHOR
Thiago Andrade Goulart Horta Avenida Barão do Rio Branco 1191 Ap.1506 - Centro
CEP: 36035-000 – Juiz de Fora, MG. Brasil.
Email: thiagogoulart198@yahoo. com.br
10. Della Valle DM, Haas JD. Quantiication of training load and intensity in fe-male collegiate rollers: validation of a daily assessment tool. J Strength Cond Res 2013;27(2):540-8.
11. Rodriguez-Marroyo JA, Medina J, Garcia-Lopez J, Garcia-Tormo JV, Foster C. Correspondence between training load executed by volleyball players and the one observed by coaches. J Strength Cond Res 2014; 28(6):1588-94.
12. Foster, C. Monitoring training in athletes with reference to overtraining syndrome. Med Sci Sports Exerc 1998;30(7):1164-8.
13. Milanez VF, Lima MCS, Gobatto CA, Perandini LAB, Nakamura FY, RIBEIRO LFP. Correlates of session-rate of perceived exertion (RPE) in a Karate training session. Sci Sports 2011;26(1):38-43.
14. Bara Filho MG, Andrade FC, Nogueira RA, Nakamura FY. Comparação de diferentes métodos de controle da carga interna em jogadores de voleibol. Rev Bras Med Esporte 2013;19(2):143-6.
15. Impellizzeri FM, Rampinini E, Coutts AJ, Sassi A, Marcora SM. Use of RPE-based training load in soccer. Med Sci Sports Exerc 2004;36(6):1042-7.
16. Moreira A, Freitas CG, Nakamura FY, Aoki MS. Percepção de esforço da sessão e a tolerância ao estresse em jovens atletas de voleibol e basquetebol. Rev Bras Cineantropom Desempenho Hum 2010;12(5):345-51.
17. Pereira G, Correia C, Ugrinowitsch LC, Nakamura F, Rodacki A, Fowler F, Kokubun E. he rating of perceived exertion predicts intermittent vertical jump demand and performance. J Sports Sci 2011;29(9):1-6.
18. Nakamura FY, Moreira A, Aoki MS. Monitoramento da carga de treinamento: a percepcao subjetiva do esforço da sessão é um método coniável? Rev Educ Fis/ UEM 2010;21(1):1-11.
19. Foster C, Heimann KM, Esten PL, Brice G, Porcari JP. A new approach to moni-toring exercise training. J Strength Cond Res 2001;15(1):109–15.
20. Marcora S. Perception of efort during exercise is independent of aferent feedback from skeletal muscles, heart, and lungs. J Appl Physiol 2009;106(6):2060–2062.
21. Nunes JA, Costa EC, Viveiros L, Moreira A, Aoki MS. Monitoramento da carga in-terna no basquetebol. Rev Bras Cineantropom Desempenho Hum 2011;13(1):67-72.
22. Caterisano A, Patrick BT, Edenield WL, Batson MJ. he efects of a basketball season on aerobic and strength parameters among college men: starters vs. reserves. J Strength Cond Res 1997;11(1):21-4.
23. Marcelino RO, Sampaio JE, Mesquita IM. Attack and serve performances ac-cording to the match period and quality of opposition in elite volleyball matches. J Strength Cond Res 2012;26(12):3385-91.
24. Gómez MA, Lorenzo A, Ortega E, Sampaio J, Ibáñez SJ. Game related statistics discriminating between starters and nonstarters players in women’s national bas-ketball association league (wnba). J Sports Sci Med 2009;8(2):278-283.
25. Kraemer WJ, Duncan NF, Nigel JP, keijo H, Jef SV, Wayne JS, et al. Changes in exercise performance and hormonal concentrations over a big ten soccer season in starters and nonstarters. J Strength Cond Res 2004;18(1):121–28.
26. Marques MC, Silva AJ, Conceição, AT, Ágata A, Costa AM, Marinho DA. Changes in physical parameters performance in starters and non-starters elite volleyball players: A short report. Int J Volleyball Research 2010;10(1):20-5.
27. Gonzalez AM, Hofman JR, Rogowski JP, Burgos W, Manalo E, Weise K, Fragala MS, Stout JR. Performance changes in NBA basketball players vary in starters vs. nonstarters over a competitive season. J Strength Cond Res 2013;27(3):611-15.
28. Sampaio J, Ibáñes S, Lorenzo A, Gómez MA. Discriminative Game-Related Statistics Between Basketball Starters and Nonstarters when Related to Team Quality and Game Outcome. Perceptual and Motor Skills 2006;103(2):486–94.