1Universidade Federal do Rio Grande do Sul, Faculdade de Medicina, Programa de Pós-Graduação em Ciências Médicas:
Endocrinologia. R. Ramiro Barcelos 2350, Prédio 12, 4° andar, 90035-003, Porto Alegre, RS, Brasil. Correspondência para/Correspondence to: JC ALMEIDA. E-mail: <[email protected]>.
2Universidade Federal do Rio Grande do Sul,Instituto de Matemática, Departamento de Estatística. Porto Alegre, RS, Brasil.
Development of a Healthy Eating Index
for patients with type 2 diabetes
Desenvolvimento de um Índice de Alimentação
Saudável para pacientes com diabetes tipo 2
Juliana Peçanha ANTONIO1
Flávia Moraes SILVA1
Suzi Alves CAMEY2
Mirela Jobim de AZEVEDO1
Jussara Carnevale de ALMEIDA1
A B S T R A C T
Objective
This study sought to develop a dietary index for assessment of diet quality aiming for compliance with dietary recommendations for diabetes: The Diabetes Healthy Eating Index.
Methods
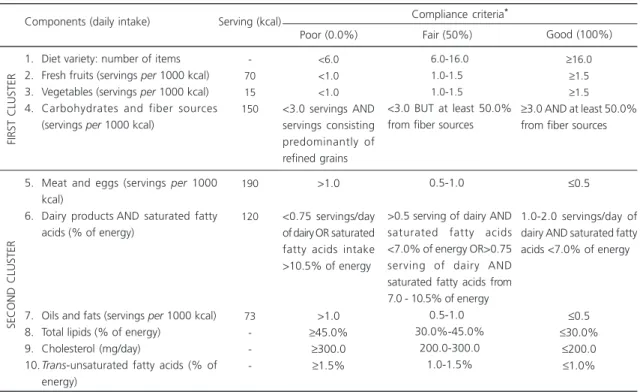
Cross-sectional study with 201 outpatients with type 2 diabetes (61.4±9.7 years of age; 72.1% were overweight; 12.1±7.7 years of diagnosis; 7.3±1.3% mean HbA1c). Clinical and laboratory evaluations were performed together with 3-day weight diet records. The dietary index developed included 10 components: “diet variety”, “fresh fruits”, “vegetables”, “carbohydrates and fiber sources”, “meats and eggs”, “dairy products and saturated fatty acids”, “oils and fats”, “total lipids”, “cholesterol”, and “trans -unsaturated fatty acids”. Theperformance of each component was evaluated using the Item Response Theory, and diet quality was scored from 0-100%.
Results
Conclusion
This dietary index proposed assesses diet quality in compliance with the specific nutritional recommendations for diabetes. In clinical practice, this novel index may be a useful tool for the assessment and management of diet of patients with type 2 diabetes.
Keywords: Diabetes Mellitus Type 2. Diet. Food consumption.
R E S U M O
Objetivo
Desenvolver índice dietético para avaliar a qualidade da dieta considerando a adesão às recomendações nutricionais específicas para diabetes: Índice de Alimentação Saudável para o Diabetes.
Métodos
Estudo transversal com 201 pacientes ambulatoriais com diabetes tipo 2 (idade=61,4±9,7 anos; 72,1% com excesso de peso; duração do diabetes=12,1±7,7 anos; HbA1c=7,3±1,3%) que realizaram 3 dias de registros com pesagem de alimentos, avaliação clínica e laboratorial. O índice foi elaborado com 10 componentes: “variedade da dieta”, “frutas frescas”, “vegetais”, “carboidratos e fontes de fibra”, “carnes e ovos”, “laticínios e ácidos graxos saturados”, “óleos e gorduras”, “lipídeos totais”, “colesterol” e “ácidos graxos trans-insaturados”. O desempenho dos componentes foi avaliado pela análise de Teoria de Resposta ao Item e a qualidade da dieta foi convertida em escala de 0-100%.
Resultados
Nessa amostra, a qualidade da dieta foi de 39,8±14,3% (IC95%=37,8-41,8%) e somente 55 pacientes apresentaram pontuação total >50%. Boa adesão foi observada para apenas quatro componentes: “lipídeos totais”, “variedade”, “fontes de fibra” e “laticínios e ácidos graxos saturados”. Os componentes que diferenciaram pacientes com baixa qualidade daqueles com boa qualidade foram “vegetais”, “variedade”, “laticínios e ácidos graxos saturados” e “lipídeos totais”. Os maiores determinantes da qualidade da dieta foram os componentes “variedade”, “vegetais” e “lipídeos totais”.
Conclusão
O índice proposto avalia a qualidade da dieta de acordo com a adesão às recomendações nutricionais específicas do diabetes. Na prática clínica, esse novo instrumento pode ser uma ferramenta útil para a avaliação e manejo da dieta em pacientes com diabetes tipo 2.
Palavras-chave:Diabetes Mellitus Tipo 2. Dieta. Consumo de alimentos.
I N T R O D U C T I O N
Diabetes Mellitus is a major public health
problem due to its high prevalence, morbidity, and mortality, as well as to the high costs involved in
its management1,2. Intensive control of
hyperglycemia and hypertension, mainly using pharmacological therapy, has reduced the development of chronic micro- and, possibly,
macrovascular complications of diabetes2.
Lifestyle change have been recommended by the Brazilian Diabetes Society as an important intervention to improve diabetes management, and it includes weight loss, regular physical activity, healthy diet and behavior, and diabetes
self-management education3. The dietary
recommendations from the Brazilian Diabetes Society includes monitoring the amount and type of carbohydrates ingested and reduction of total fat intake (saturated fatty acid intake, especially, should not exceed 7% of daily calories), cholesterol, and trans-unsaturated fatty acids. Furthermore, an increased intake of dietary fiber (14 g fiber/ 1000 kcal) and foods containing whole grains
(one-half of all grain intake) is also reccomended3.
In clinical practice, food intake is often assessed to support the production and implementation of nutritional recommendations to promote health, prevent illness, and improve
been developed to evaluate the overall population diet quality of and can reveal the intake of various dietary components (food groups, nutrients, and
diversity or variety) with one single variable5. The
Healthy Eating Index is the most frequently used
dietary index for the general population6. This
index evaluates compliance with recommended food groups and specific nutrient intake according
to dietary guidelines7, and it has been adapted to
different populations and settings including
Canada, Australia7,and Brazil8. Some authors9-11
have evaluated the Healthy Eating Index in
patients with diabetes. Only one transversal study9
evaluated the clinical characteristics that are related to diet quality in 151 Greek patients with type 2 diabetes. Cigarette smoking and alcohol consumption, female gender, presence of cardiovascular disease, peptic ulcer, obesity, and diabetic foot syndrome contributed to the adoption of a high quality diet (80% minimum score). Among the morbidities associated with diabetes, only diabetic nephropathy contributed
to lower scores of diet quality9. Some other studies
including a small size sample of Chinese people10
or Brazilian patients11 found that a higher
proportion of patients need diet quality
improvements: 80.0 and 52.2%11 of patients10,
respectively. However, in those studies, the index was not adapted to include specific dietary
recommendations for diabetes3.In fact, nutrition
recommendations for people with diabetes are more demanding than those for the general
population12 regarding saturated fatty acids (7.0%
as compared to 10.0% of total energy, respectively), cholesterol (200 mg/day as compared to 300 mg/ day, respectively), and carbohydrates (monitoring the amounts and quality instead of reducing the consumption of the of foods high in sugar). Accordingly, it can be said that a dietary quality index specifically developed for these patients is necessary. Therefore, the present study sought to develop a dietary index for assessment of diet quality aiming for compliance with specific dietary recommendations for diabetes.
M E T H O D S
This cross-sectional study was conducted in patients with type 2 diabetes, who were selected according to the World Health Organization criteria: age >30 years at onset of diabetes, no previous episodes of ketoacidosis or documented ketonuria, and initiation of insulin therapy (when present) at least 5 years after
diagnosis13. The patients treated at the outpatient
endocrinology clinic of the Hospital de Clínicas
de Porto Alegre, State of Rio Grande do Sul, Brazil, who had not received any dietary counseling by a registered dietitian in the previous 12 months, were recruited (for information bias). Selection criteria were: age <80 years, Body Mass Index
(BMI) <35 kg/m2, serum creatinine <2.0 mg/dL
(176 µmol/L), and normal liver and thyroid function tests.
A total of 317 eligible patients underwent clinical and laboratory evaluation. Hypertension
was defined as blood pressure ≥140/90 mmHg
on two separate occasions or use of antihypertensive drugs. Diabetic nephropathy was diagnosed on the basis of a random spot urine sample or 24 hours urinary albumin excretion. Micro- and macroalbuminuria were always confirmed when
present14. A dilated fundus examination was
performed and diabetic retinopathy was graded as present or absent. Economic status was evaluated by a questionnaire designed according
to the Brazilian reality15. Current medications were
determined based on a review of medical records
of the patients’ most recent visits preceding the
dietary assessment. The patients were classified as current smokers, former smokers, or non-smokers and were self-identified as racially white or non-white. The frequency of physical exercise was graded according to their activities during a
typical day16. Body weight and height were
measured using an anthropometric scale and recorded to the nearest 100 g for weight and to the nearest 0.1 cm for height. BMI was then
calculated as weight (kg)/height (m)2. Waist
at the level of the umbilicus, and recorded to the nearest 1 cm. Measurements were made using flexible non-stretch fiberglass tape.
Blood samples were obtained after a 12 hours fast. Plasma glucose was determined using the glucose oxidase method, creatinine values
using the Jaffe’s reaction, glycated hemoglobin
(HbA1c, reference range 4.7-6.0 %) using HPLC, total cholesterol and Triglycerides (TG) using enzymatic colorimetric methods, and High-Density Lipoprotein (HDL) cholesterol using the homogeneous direct method. Low-Density Lipoprotein (LDL) cholesterol was calculated using
the Friedewald’s equation (LDL=total cholesterol
- HDL-TG/5). Urinary albumin excretion was measured using immunoturbidimetry, and urinary urea was measured using an enzymatic ultraviolet method. All tests were performed at the Clinical
Pathology Laboratory of the Hospital de Clínicas
de Porto Alegre.
The patients’ regular diet was assessed
using 3-day weighed dietary records (two non-consecutive weekdays and one weekend day), previously standardized and validated to our
diabetic population17,18. The patients were issued
commercial scales and measuring cups. A detailed explanation was given, and the technique was demonstrated to each subject by a nutritionist.
The within-person coefficientof variation used
to estimate energy and macronutrient intake of
the 3-day weighed dietary record was <12%18.
The adequacy of the weight-records was
assessed based on the protein intake ratio
estimated by urinary nitrogen output, which
ranged from 0.79 to 1.2618. Values outside this
range were considered indicative of under- or
overreporting18 thus 117 patients were excluded.
The nutritional composition of dietary records was
calculated using the NutriBase Clinical® Nutritional
Manager software, United States Departament of Agriculture Database for Standard Reference,
version 20 (CyberSoft Inc., Phoenix, Arizona)19.
Nutrient values of frequently consumed foods were complemented, when necessary, with data obtained from local manufacturers of specific industrialized foods.
Overall diet quality was assessed based on a combination of food groups and nutrients using the Diabetes Healthy Eating Index (DHEI). This index and the criteria for evaluation of diet variety
were based on the original Healthy Eating Index20.
Food groups were described according to the recommendations from the Brazilian Dietary
Guidelines12, and the nutrient intake was described
according to current Brazilian Diabetes Society
recommendations3.The DHEI was based on 10
dietary components: 1) “Variety”: number of food items reported in 3-day weighed dietary records; 2) “Fresh fruits”: all fruits, raw, or cooked (servings
per 1000 kcal/day); 3) “Vegetables”: all vegetables,
raw, and cooked (servings per 1000 kcal/day); 4)
“Carbohydrates and fiber sources”: component composed of the relationship between the consumption of whole grains and beans and the sum of total carbohydrate sources [refined and
whole grains, sugar, and sweets (servings per
1000 kcal/day (fiber sources); 5) “Meats and eggs”: red and white meat, processed meats, and
cooked eggs (servings per 1000 kcal/day); 6)
“Dairy products and saturated fatty acids”: component composed of milk, yogurt, and cheese
(servings per 1000 kcal/day) and the proportion
of energy intake from saturated fatty acids; 7) “Oils and fats”: cooking oil, butter, margarine
(servings per 1000 kcal/day); 8) Total lipids (% of
total energy); 9) Cholesterol (mg/day), and 10) Trans-unsaturated fatty acids (% of total energy). A food item was considered for analysis when its reported intake had at least 50% of calories corresponding to 1 serving of its corresponding food group of the food group. Each item of the food preparations was considered for evaluation
of diet variety20,i.e., a sandwich might contribute
to both carbohydrates and meat groups.
sum of scores of each individual component (maximum values=10) corresponded to the overall diet quality, scored on a scale of 0 to 100%.
The results were expressed as mean ± standard deviation, median (interquartile range), or number of patients (%), as appropriate. Values
were considered statistically significant if p values
were lower than 0.05 (two-tailed). Statistical analysis was performed using the PASW Statistics 18 for Windows software environment (IBM Corporation, 2010, New York, United States).
Assessment of each DHEI component was
performed using a posteriori analysis based on
the Item Response Theory (IRT)21. Briefly, IRT is a
set of mathematical models that represent the probability that an individual will give a certain response to an item as a function of the parameters of the item and the latent trait (here the dietary quality) of the respondent. The Graded Response Model, which is appropriate for
polytomous items, was used in this study21. The
item response category characteristic curves
describe the individual’s probability to answer
each category given his or her latent trait. Item information curves allow for the analysis of the extent to which a component of the instrument (the DHEI, in this case) contains the information needed to measure the parameter of interest
(dietary quality). IRT was carried out using the R
software (ltm package version 2.15.2, 2012, Vanderbilt University, Nashville Tennessee, United
States)22.
This study was conducted in accordance with the ethical principles of the Declaration of Helsinki, and all procedures involving patients were approved by the Hospital Research Ethics
Committee of the Hospital de Clínicas de Porto
Alegre under Protocol number nº 08-488, on November 7, 2008. Written Informed Consent was obtained from all patients.
Table 1. Diabetes Healthy Eating Index components: criteria used to evaluate compliance with the dietary recommendations in 201 with type 2 diabetes patients from Porto Alegre (RS), Brazil, 2012.
1. Diet variety: number of items 2. Fresh fruits (servings per 1000 kcal) 3. Vegetables (servings per 1000 kcal) 4. Carbohydrates and fiber sources
(servings per 1000 kcal)
5. Meat and eggs (servings per 1000 kcal)
6. Dairy productsAND saturated fatty acids (% of energy)
7. Oils and fats (servings per 1000 kcal) 8. Total lipids (% of energy)
9. Cholesterol (mg/day)
10.Trans-unsaturated fatty acids (% of energy)
-70 15 150
190
120
73
-<6.0 <1.0 <1.0
<3.0 servings AND servings consisting predominantly of refined grains
>1.0
<0.75 servings/day of dairy OR saturated fatty acids intake >10.5% of energy
>1.0
≥45.0%
≥300.0
≥1.5%
6.0-16.0 1.0-1.50
1.0-1.50 <3.0 BUT at least 50.0% from fiber sources
0.5-1.00
>0.5 serving of dairy AND saturated fatty acids <7.0% of energy OR>0.75 serving of dairy AND saturated fatty acids from 7.0 - 10.5% of energy
0.5-1.00 30.0%-45.0%
200.0-300.0 1.0-1.5%
≥16.0
≥1.5
≥1.5
≥3.0 AND at least 50.0% from fiber sources
≤0.5
1.0-2.0 servings/day of dairy AND saturated fatty acids <7.0% of energy
≤0.5
≤30.0%
≤200.0
≤1.0%
FIRST CLUSTER
SECOND CLUSTER
Components (daily intake) Serving (kcal)
Poor (0.0%) Fair (50%) Good (100%)
Compliance criteria*
Note: *Criteria for compliance according to the Brazilian Diabetes Society dietary recommendations3, the Brazilian Dietary Guidelines12 and the
original Healthy Eating Index20. The sum of scores of each individual component (maximum score=10) is the overall dietary quality, and it is scored
R E S U L T S
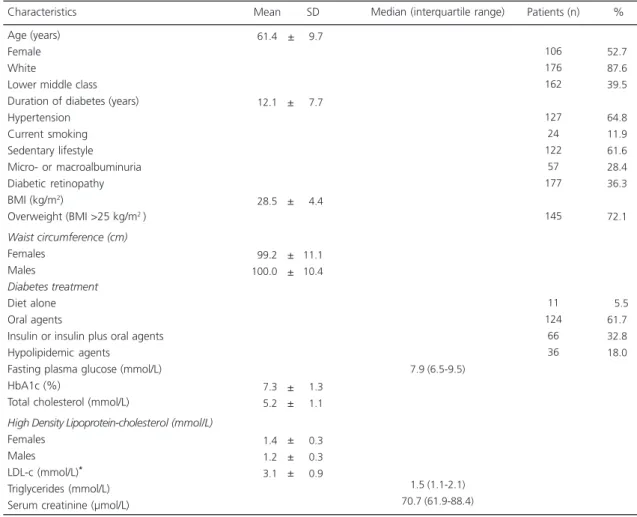
The main clinical and laboratory characteristics of the sample are described in Table
2. Patients’ mean age of was 61.4±9.7 years,
52.7% were female, 72.1% were overweight, 39.5% were categorized as lower middle class, mean years of diabetes diagnosis was 12.1±7.7 years, and mean HbA1c was 7.3±1.3%. The 3-day total daily energy intake was 1859±474 kcal, and the overall DHEI was 39.8±14.3% (95%CI=37.8-41.8%). Only 55 patients (27.4%)
had a total DHEI score ≥50%.
The Diabetes Healthy Eating Index components were grouped into two clusters according to clinical criteria and to their effect on
the health of diabetic patients. The first cluster included components considered as sources of fiber (“fresh fruits”, “vegetables”, “carbohydrates and fiber sources”) and the diet variety components. The second cluster included the components corresponding to food from animal sources and fats: “meats and eggs”, “dairy and saturated fatty acids”, “oils and fats”, “total
lipids”, “cholesterol”, and “trans-unsaturated
fatty acids”. Briefly, the components that differentiated the patients with low dietary quality from those with good dietary quality were “vegetables”, “diet variety”, “dairy and saturated fatty acids”, and “total lipids”. The greatest determinants of dietary quality were the components “diet variety”, “vegetables”, and “total lipids”.
Table 2.Clinical and laboratory characteristics of 201 patients with type 2 diabetes from Porto Alegre (RS), Brazil, 2012.
Age (years) Female White
Lower middle class Duration of diabetes (years) Hypertension
Current smoking Sedentary lifestyle Micro- or macroalbuminuria Diabetic retinopathy BMI (kg/m2)
Overweight (BMI >25 kg/m2 )
Waist circumference (cm)
Females Males
Diabetes treatment
Diet alone Oral agents
Insulin or insulin plus oral agents Hypolipidemic agents
Fasting plasma glucose (mmol/L) HbA1c (%)
Total cholesterol (mmol/L)
High Density Lipoprotein-cholesterol (mmol/L)
Females Males LDL-c (mmol/L)* Triglycerides (mmol/L) Serum creatinine (µmol/L) Characteristics 061.4 012.1 028.5 099.2 100.0 007.3 005.2 001.4 001.2 003.1 Mean SD 106 176 162 127 24 122 57 177 145 11 124 66 36 Patients (n) 7.9 (6.5-9.5) 1.5 (1.1-2.1) 70.7 (61.9-88.4)
Median (interquartile range) 09.7 07.7 04.4 11.1 10.4 01.3 01.1 00.3 00.3 00.9
Note: *Low Density Lipoprotein-cholesterol (LDL-c) was not calculated in two patients who had triglyceride values >4.48 mmol/L.
BMI: Body Mass Index; SD: Standard Deviation.
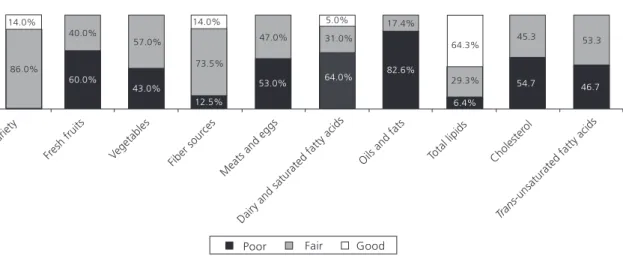
The levels of compliance (%) with the dietary recommendations are illustrated in Figure 1. Most patients had poor or fair compliance obtained for the components assessed by the DHEI. Good compliance was observed only for four components of DHEI: “total lipids” (64.3% of patients), “variety” (14.0% of patients), “fiber sources” (14.0% of patients), and “dairy and saturated fatty acids” (5.0% of patients).
D I S C U S S I O N
The 10-component DHEI is the first tool developed for the assessment of dietary quality in patients with diabetes according to specific dietary recommendations for this population. It was found that outpatients with type 2 diabetes evaluated showed increased difficulty to comply with the dietary recommendations of some DHEI components, namely “carbohydrates and fiber sources”, “diet variety”, “dairy and saturated fatty acids”, and “oils and fats”. The greatest determinants of dietary quality were the components “vegetables” and “diet variety”, “dairy and saturated fatty acids”, and “total lipids”. Regarding overall dietary quality, most patients (73.6%) had a score of <50.0%, demonstrating need for improvement.
The first cluster comprised sources of fiber, components that have been associated with
glycemic control23,blood pressure24, and metabolic
syndrome prevalence25 in patients with type 2
diabetes. Accordingly, the item “carbohydrates and fiber sources” was included considering the importance of the balance between refined-grain and whole-grain intake for metabolic control in
diabetes3. Furthermore, the use of glycemic index
and load may provide a modest additional benefit over that observed when total carbohydrate is
considered alone3. However, the intake of fruit
juices was not included in evaluation of the “fresh fruit” component because we believe that high glycemic index content should be considered. Nevertheless, in the present study, only 20% of patients reported intake of fruit juice (median intake, 87.5 [50-180] mL). Such low fruit juice intake hindered a more detailed evaluation of this factor.
The dietary components included in the second cluster have been associated with lipid
profile3,26 and renal function27,28 in diabetes. The
“dairy and saturated fatty acids” item is another component designed to determine the intake of low-fat or non-fat dairy products as recommended by the Dietary Approaches to Stop Hypertension (DASH) diet plan, which play a key role in reducing
cardiovascular risk29.
Figure 1. Levels of compliance with the nutritional recommendations obtained for the components assessed by the Diabetes Healthy Eating Index (DHEI) in 201 patients with type 2 diabetes.
Dietary indexes are useful tools in clinical practice because they enable the evaluation of
overall diet quality using different dietary items5.
However, to the best of our knowledge, there is no standard reference for evaluation of diet quality in patients with diabetes. A review of the literature did not reveal any validation studies on these indexes. Some authors evaluated the dietary quality of patients with diabetes using the Healthy
Eating Index for the general American population9,30
or developed new scores according to their
country guidelines31,32.In the present study, the
Healthy Eating Index was adapted to specific dietary recommendations for patients with
diabetes3 and adjusted to Brazilian guidelines12,
yielding the DHEI. Due to the unique design of this novel study, it is difficult to compare it with previous studies. We believe that a dietary quality index developed specifically for patients with diabetes is necessary because dietary recommendations for these patients are more strict than those for the general population. In a pilot study of 40 patients with type 2 diabetes, dietary quality scores analyzed using the original Healthy Eating Index were higher than those
calculated using the DHEI: 80.2±11.7% versus
61.7±11.5%, respectively (p<0.001,
paired-samples t test, data unpublished); therefore, this
observation needs to be confirmed by associations with socioeconomic characteristics and/or health outcomes in future studies with larger sample.
If the cutoff points for overall dietary
quality proposed by the original HEI20 had been
used, the following values would have found: 38.3% of patients with poor dietary quality (diet quality score <51), 61.7% of patients with regular dietary quality (score 51-80), and no patients with good dietary quality (score >80). Even if the overall dietary quality cutoff proposed in a previous study
on Greek patients with diabetes (score >80)9 had
been used, there would be no patients with a good-quality. It is known that a score of 50% does not characterize good dietary quality, but in the present study sample, only one patient obtained a score >75%. Therefore, cutoff points lower than
those previously used in other populations were established, which should be reviewed in a larger sample of patients with diabetes.
C O N C L U S I O N
The Diabetes Healthy Eating Index evaluates overall diet quality in patients with diabetes aiming for compliance with specific dietary recommendations for patients with diabetes. In clinical practice, this novel index can be a useful tool for dietary assessment and management of diabetics. Furthermore, it can improve counseling on dietary habits by focusing on the dietary components that need improvement in the compliance with nutritional requirements. However, the DHEI cutoffs should be established and their validity tested in other samples of patients with diabetes taking into account possible associations with metabolic control parameters and even with “hard” outcomes, such as the chronic complications of diabetes.
C O N T R I B U T O R S
JP ANTONIO contributed to data collection and manuscript writing. SA CAMEY contributed to the statistical analysis, conception and revision of the manuscript. FM SILVA and MJ AZEVEDO contributed to the development of this index and critically reviewed the manuscript. JC ALMEIDA reviewed the manuscript, contributed to data interpretation and discussion of results. The final paper version was approved by all authors.
R E F E R E N C E S
1. International Diabetes Federation. The Global Burden. 6th ed. Brussels: International Diabetes
Federation; 2013 [cited 2014 Aug 17]. Available from: http://www.idf.org/sites/default/files/ EN_6E_Ch2_the_Global_Burden.pdf
3. Sociedade Brasileira de Diabetes. Diretrizes da Sociedade Brasileira de Diabetes 2013-2014. São Paulo: AC Farmacêutica; 2014.
4. Fisberg RM, Marchiori DML, Colucci ACA. Assessment of food consumption and nutrient intake in clinical practice. Arq Bras Endocrinol Metab. 2009; 53(5):617-24.
5. Volp ACP, Alfenas RCG, Costa NMB, Minim VPR, Stringueta PC, Bressan J. Dietetic Indices for assessment of diet quality. Rev Nutr. 2010; 23(2):281-95. http://dx.doi.org/10.1590/S1415-52732010000200011
6. United States Department of Agriculture and Department of Health and Human Services. The Healthy Eating Index. [cited 2014 Aug 17]. Available from:http://www.cnpp.usda.gov/HealthyEatingIndex. htm
7. Fransen HP, Ocké MC. Indices of diet quality. Curr Opin Clin Nutr Metab Care. 2008; 11(5):559-65. http://dx.doi.org/10.1097/MCO.0b013e32830a 49db
8. Previdelli AN, Andrade SC, Pires MM, Ferreira SRG, Fisberg RM, Marchioni DM. A revised version of the Healthy Eating Index for the Brazilian population. Rev Saúde Pública. 2011; 45(4):794-8. 9. Mangou A, Grammatikopoulou MG, Mirkopoulou D, Sailer N, Kotzamanidis C, Tsigga M. Associations between diet quality, health status and diabetic complications with type 2 diabetes and comorbid obesity. Endocrinol Nutr. 2012; 59(2):109-16. http:// dx.doi.org/10.1016/j.endonu.2011.10.003 10. Lin Y, Guo H, Deng Z. [Evaluating dietary quality of
type 2 diabetes in Macao by Healthy Eating Index] [abstract]. Wei Sheng Yan Jiu. 2004; 33(6):737-40. 11. Santos CRB, Gouveia LAV, Portella ES, Avila SS, Soares EA, Lanzillotti HS. Índice de alimentação saudável: avaliação do consumo alimentar de diabéticos tipo 2. J Braz Soc Food Nutr. 2009; 34(1):115-29.
12. Brasil. Ministério da Saúde. Secretaria de Atenção à Saúde. Departamento de Atenção Básica. Guia alimentar para a população brasileira: promovendo a alimentação saudável. Brasília: Ministério da Saúde; 2008 [acesso 2014 ago 17]. Disponível em: http://bvsms.saude.gov.br/bvs/publicacoes/guia_ alimentar_populacao_brasileira_2008.pdf 13. World Health Organization. Report of a World
Health Organization and International Diabetes Federation: Screening for Type 2 Diabetes. Geneva: WHO; 2003 [cited 2014 Aug 17]. Available from: http://www.who.int/diabetes/publications/en/ screening_mnc03.pdf
14. Gross JL, Azevedo MJ, Silveiro SP, Canani LH, Caramori ML, Zelmanovitz T. Diabetic nephropathy:
Diagnosis, prevention, and treatment. Diabetes Care. 2005; 28(1):164-76.
15. Associação Brasileira das Empresas de Pesquisa. Critério de classificação econômica Brasil. São Paulo: Abep; 2003 [acesso 2014 ago 17]. Disponível em: http://www.abep.org/novo
16. Tuomilehto J, Lindström J, Eriksson JG, Valle TT, Hämäläinen H, Ilanne-Parikka P, et al. Prevention of type 2 diabetes Mellitus by changes in lifestyle among subjects with impaired glucose tolerance. N Engl J Med. 2001; 344(18):1343-50.
17. Moulin CC, Tiskievicz F, Zelmanovitz T, Oliveira J, Azevedo MJ, Gross JL. Use of weighed diet records in the evaluation of diets with different protein contents in patients with type 2 diabetes. Am J Clin Nutr. 1998; 67(5):853-7.
18. Vaz JS, Bittencourt M, Almeida JC, Gross JL, De Azevedo MJ, Zelmanovitz T. Protein intake estimated by Weighed Diet Records in Type 2 diabetic patients: Misreporting and intra-individual variability using 24-hour nitrogen output as criterion standard. J Am Diet Assoc. 2008; 108(5):867-72. http://dx.doi.org/10.1016/j.jada. 2008.03.022
19. United States Departament of Agriculture. National Nutrient Database for Standard Reference. Composition of foods raw, processed, prepared. Washington (DC): USDA; 2012.
20. Kennedy ET, Ohls J, Carlson S, Fleming K. The Healthy Eating Index: Design and applications. J Am Diet Assoc. 1995; 95(10):1103-8.
21. Sébille V, Hardouin JB, Le Néel T, Kubis G, Boyer F, Guillemin F, et al. Methodological issues regarding power of Classical Test Theory (CTT) and Item Response Theory (IRT)-based approaches for the comparison of patient-reported outcomes in two groups of patients: A simulation study. BMC Med Res Methodol. 2010; 25:10-24. http://dx.doi.org 10.1186/1471-2288-10-24
22. R Development Core Team. R: A language and environment for statistical computing Vienna. R Foundation for Statistical Computing; 2011 [cited 2014 Aug 17]. Available from: http://www.r-project. org
23. Chandalia M, Garg A, Lutjohann D, von Bergmann K, Grundy SM, Brinkley LJ. Beneficial effects of high dietary fiber intake in patients with type 2 diabetes Mellitus. N Engl J Med. 2000; 342(19):1392-98. 24. Paula TP, Steemburgo T, de Almeida JC, Dall’Alba
25. Steemburgo T, Dall’Alba V, Almeida JC, Zelmanovitz
T, Gross JL, Azevedo MJ. Intake of soluble fibers has a protective role for the presence of metabolic syndrome in patients with type 2 diabetes. Eur J Clin Nutr. 2009; 63(1):127-33.
26. American Heart Association. Understanding the complexity of trans fatty acid reduction in the American diet: American Heart Association Trans Fatty Conference 2006: Report of the trans fat conference planning Group. Circulation. 2007; 115:2231-46.
27. Almeida JC, Mello VD, Canani LH, Gross JL, Azevedo MJ. Papel dos lipídeos da dieta na nefropatia diabética. Arq Bras Endocrinol Metabol. 2009; 53(5):634-45.
28. Cárdenas C, Bordiu E, Bagazgoitia J, Calle-Pascual AL. Polyunsaturated fatty acid consumption may play a role in the onset and regression of microalbuminuria in well-controlled type 1 and type 2 diabetic people: A 7-year, prospective, population-based, observational multicenter study. Diabetes Care. 2004; 27(6):1454-7.
29. Mozafarian D, Appel LJ, Van Horn L. Components of cardioprotective diet: New insights. Circulation. 2011; 123(24):2870-91. http://dx.doi.org/10.1161/ CIRCULATIONAHA.110.968735
30. Tse J, Nansel TR, Haynie DL, Mehta SN, Laffel LM. Disordered eating behaviors are associated with poorer diet quality in adolescents with type 1 diabetes. J Acad Nutr Diet. 2012; 112(11):1810-4. http://dx.doi.org/10.1016/j.jand.2012.06.359 31. Lee M, Chae SW, Cha YS, Cho MS, Oh HY, Kim
MK. Development of a Korean Diet Score (KDS) and its application assessing adherence to Korean healthy diet based on the Korean Food Guide Wheels. Nutr Res Pract. 2013; 7(1):49-58. http:// dx.doi.org/10.4162/nrp.2013.7.1.49
32. McNaughton SA, Ball K, Crawford D, Mishra GD. An index of diet and eating patterns is a valid measure of diet quality in an Australian population. J Nutr. 2008; 138(5):86-93.