Diet quality among adolescents:
a population-based study in
Campinas, Brazil
Qualidade da dieta de adolescentes:
estudo de base populacional em
Campinas, SP
Daniela de Assumpção
IMarilisa Berti de Azevedo Barros
IRegina Mara Fisberg
IILuana Carandina
IIIMoises Goldbaum
IVChester Luiz Galvão Cesar
III Faculdade de Ciências Médicas da Universidade Estadual de Campinas,
Campinas, Brasil.
II Faculdade de Saúde Pública da Universidade de São Paulo, São Paulo, Brasil.
III Faculdade de Medicina de Botucatu da Universidade Estadual Paulista,
Botucatu, Brasil.
IV Faculdade de Medicina da Universidade de São Paulo, São Paulo, Brasil.
Agradecimentos: À FAPESP (processo nº 88/14099-7) e à Secretaria Estadual de Saúde de São Pau-lo, pelo inanciamento do trabalho de campo; à Secretaria de Vigilância em Saúde do Ministério da Saúde, pelo suporte inanceiro para a análise dos dados através do Centro Colaborador em Análise de Situação de Saúde da Faculdade de Ciências Médicas (UNICAMP) e à CAPES pela bolsa de mes-trado recebida por D. de Assumpção e ao CNPq, pela bolsa de produtividade de M.B.A. Barros, M. Goldbaum e C.L.G. Cesar e R.M. Fisberg.
Correspondência: Daniela de Assumpção. Departamento de Saúde Coletiva, FCM/UNICAMP - Caixa Postal 6111 - CEP 13083-970 Campinas, SP. Email: [email protected]
Abstract
We assessed the overall diet quality and adequacy of diet consumption of each com-ponent of the diet of adolescents according to demographic, socioeconomic and body mass index (BMI) data. A cross-sectional population-based study analyzed a repre-sentative sample of 409 adolescents, aged 12-19 years, using the Healthy Eating Index (HEI). We estimated the prevalence of diets classified in the first quartile of the HEI and the average scores of each component of the HEI. Linear and Poisson multiple regres-sions were used in the analysis. The mean score of HEI was 59.7. We observed a lower prevalence of inadequate diets in the seg-ment with heads of household presenting higher schooling. The lower socioeconomic status segments, measured by income and schooling, showed a lower consumption of vegetables, fruits, dairy products and a less diversified diet, and a higher intake of cereals and legumes. Overweight/obese adolescents consume more meat and eggs and less fruit compared to low weight/normal weight adolescents. Girls had a higher intake of to-tal fat and lower sodium intake. The results identified diet components that deserve more attention in the strategies to promote healthy eating, and the more vulnerable segments among adolescents.
Keywords: Adolescent. Feeding behavior.
Resumo
O objetivo deste estudo foi avaliar a qua-lidade global da dieta e a adequação do consumo de cada componente da dieta de adolescentes segundo fatores demográficos, socioeconômicos e índice de massa corpo-ral (IMC). Trata-se de estudo transversal, de base populacional, que analisou amostra representativa de 409 adolescentes, de 12 a 19 anos, utilizando o Índice de Qualidade da Dieta (IQD). Foram estimadas as preva-lências de dietas classificadas no 1º quartil do IQD e as médias de escores de cada componente do IQD. Regressões múltiplas linear e de Poisson foram utilizadas nas análises. O escore médio do IQD foi de 59,7. Observou-se menor prevalência de dietas inadequadas no segmento de melhor es-colaridade do chefe da família. Os estratos de menor nível socioeconômico, avaliados por renda e escolaridade, mostram um consumo inferior de verduras e legumes, frutas, leite e derivados e menor variedade da dieta e uma ingestão superior de cereais e derivados e leguminosas. Adolescentes com sobrepeso/obesidade consomem mais carnes e ovos e menos frutas comparados aos que apresentam baixo peso/eutrofia. As meninas tiveram maior ingestão de gordura total e menor ingestão de sódio. Os resultados identificam os componentes que merecem atenção nas estratégias de promo-ção de alimentapromo-ção saudável e os segmentos mais vulneráveis à má alimentação.
Palavras-chave: Adolescente. Com
por-tamento alimentar. Ingestão de alimentos. Inquérito dietetico. Dieta. Nutrição.
Introduction
Adolescence is a stage of life characte-rized by significant changes in biological, psychological and social dimensions, and is considered of fundamental importance to the formation of habits and attitudes, including dietary habits, which have an impact on the present and future health of the adolescent 1. Literature has shown
evi-dence of the determinant role of a healthy diet in the prevention of different types of diseases, such as diabetes, cardiovascular disturbances, and various neoplasms 2.
In 2009, the National Survey of the Health of Schoolchildren (PeNSE) 3,
inves-tigated the food consumption of adolescent students at public and private schools in Brazil. Food identified as healthy (beans, vegetables, fruits and milk) and unhealthy (soft drinks, sweet biscuits and cold meats) were used to evaluate diet. Results indicated the frequent consumption of unhealthy food, especially among girls. The intake of fruit and vegetables was extremely low for both genders, and was directly influenced by socio-economic level, which confirmed the findings of other studies in Brazil 4,5.
These dietary inadequacies become even more relevant as a result of the high pre-valence of overweight and obesity among adolescents 6.
When considering the repercussions of diet on the general state of health and the in-cidence of disease, researchers have sought to develop indices to evaluate quality of diet in a global and synthetic form 7. The Healthy
Eating Index – (HEI), which represents such an index, was developed by the Department of Agriculture of the United States, with the aim of evaluating nutritional care needs and the recommendations of dietary guidelines8.
The HEI was adapted for use in Brazil by Fisberg et al. 9.
quality and adequacy of intake of each of the ten components of the HEI, according to demographic and socioeconomic variables and body mass index (BMI), of adolescents in the city of Campinas, SP.
Methods
Data used in the present study was gathered from a multicenter health survey, performed between 2001 and 2002, in four areas of the state of São Paulo, including the city of Campinas. Campinas has around one million inhabitants and is an impor-tant industrial and technological center in the state of São Paulo. In 2000, adolescents comprised 17.8% of the population of the city10.
The survey sample was determined by random sampling procedures, stratified and by conglomerate, and was divided in two stages: census sector and households. The census sectors of the city of Campinas were grouped into three strata according to percentage of head of household with university education, with ten sectors then randomly selected from each stratum.
After an inventory of households in the 30 randomly selected census sectors was performed, a random selection by gender and age was performed within the households.
In order to guarantee minimum sam-ple numbers for determined population subgroups, eight fields of age and sex were defined, among them the segment of males aged 12 to 19 years and females aged 12 to 19 years. For each field of gender and age, a minimum sample size of 200 individuals was calculated, based on an estimated pre-valence of 50% (which corresponds to ma-ximum variability), with a confidence level of 95%, maximum error of 0.10 and a design effect (deff) of 2. For the present study data was analyzed from only two strata which would correspond to a minimum sample size of 400 individuals.
Information was collected in households by trained researchers, through the appli-cation of a questionnaire organized into 19
thematic blocks, with the majority of ques-tions closed. The tool had been previously tested in a pilot study.
For the present study, data for adoles-cents aged 12 to 19 years was analyzed. The adolescents were of both genders, not institutionalized, resident in the urban area of the city of Campinas, and had their daily food intake evaluated by 24-hour dietary recall (R24h).
Study variables
The dependent variables were derived from the Healthy Eating Index adapted for the population of Brazil by Fisberg et al. 9 in
a study performed on a subsample of this same multicenter survey and later modified by Godoy et al.11.
The index used was comprised of six components related to food groups (cereals, bread, roots and tubers; vegetables; fruit; milk and dairy products; meat and eggs; pul-ses), three components related to nutrients (total fat, cholesterol and sodium) and one which evaluated variety of diet. Each of the ten components of HEI was evaluated and scored from zero to ten, so that total HEI score could reach a maximum value of 100 points. Intermediate values of ingestion were calculated proportionally considering the interval between the minimum and maximum scoring criteria established for each component (Chart 1). The calculation for HEI was based on information obtained through the application of a 24h recall sur-vey (R24h). The method recommended by Thompson and Byers12 was used to apply
include the different chemical composition of foods11.
The dependent variables in the study were: a) prevalence of diets in the 1st quartile
of distribution of HEI scores, which corres-ponded to diets with lower scores, being diets of poor quality; and b) the average score of each of the ten HEI components.
The independent variables were: Demographic: gender, age, ethnic ba-ckground, religion and number of people in household.
Socioeconomic: level of schooling of head of family, monthly family income per capita (measured in minimum salaries) and occupation of adolescent.
Nutritional status assessed by BMI was calculated from the weight and height sup-plied. The nutritional status of adolescents was classified as underweight, healthy wei-ght, overweight and obese, according to the cutoffs recommended by the World Health Organization (WHO, 2007) 13, with
percen-tages used referring to the midpoint of age. The interview data was entered into a database created using the Epi Info 6.04b program (Center for Disease Control and Prevention, Atlanta, USA). The prevalence of diets in the 1st quartile of the HEI according
to the independent variables was calculated, with the association verified by χ² test and
with a 5% significance level. Prevalence ra-tions and confidence intervals of 95% were calculated using Poisson simple regression analysis. For the multiple regression model, constructed using Poisson multiple regres-sion analysis, the variables with p value < 0.20 in bivariate analysis were introduced, with variables with a value of p < 0.05 remai-ning in the model.
The mean scores for each of the ten com-ponents of the HEI were also calculated and the association between these components and independent variables was calculated. A multiple linear regression model was deve-loped for each component of the HEI with variables with a value of p < 0.20 in bivariate analysis being introduced, with variables with a value of p < 0.05 remaining in the model. All the models included adjustment for total energy of diet.
Statistical analysis was performed with the Stata 10 program (Stata Corporation, College Station, USA) which allowed the following characteristics of sample design to be considered: strata, weighting and conglomerates.
The present study was approved by the
Chart 1 - Criteria for the minimum and maximum score of each Healthy Eating Index component.
Quadro 1 - Critérios para a pontuação máxima e mínima de cada componente do Índice de Qualidade da Dieta.
Components Criteria for minimum score
(0 point)
Criteria for maximum score (10 points) 1. Cereals, breads and roots group Not consumed 5 to 9 portions
2. Vegetables group Not consumed 4 to 5 portions
3. Fruits group Not consumed 3 to 5 portions
4. Milk and derivatives group Not consumed 3 portions
5. Meat and eggs group Not consumed 1 to 2 portions
6. Pulses group Not consumed 1 portion
7. Total fat group 45% or more of VET* ≤30% and >20% of VET*
8. Cholesterol 450mg or more 300mg or more
9. Sodium 4800mg or more 2400mg or more
10. Variety of diet 3 or more diferent types of food per day
8 or more diferent types of food per day
Fonte: Godoy et al. 12 / Source: Godoy et al. 12
Ethics Research Committee of the Faculdade de Ciências Médicas of UNICAMP, through an addendum to process 369/2000.
Results
Among 433 adolescents identified in re-sidences selected to participate in the study, 12 refused to participate, so that the study comprised interviews with 421 individuals.
Of the 421 adolescents in the study, 12 were excluded as a result of having an energy consumption of less than 1% (< 641,934 Kcal) or greater than 99% (> 6546,23 Kcal) of observed distribution, taking into account the recommendation of Nielsen et al.14. As
such, the information of 409 adolescents was analyzed, with an average age of 15.5 years (standard deviation = 2.33).
The sample comprised similar propor-tions of boys and girls, with a slightly larger participation of adolescents aged between 12 and 15 years. The strata of lower income and level of schooling of head of family represented more than 50% of individuals studied. Adolescents of caucasion ethnic background represented 71% of the sample, those of catholic faith comprised 61%, those with an occupational activity 21%, those that resided in households with 4 to 5 people represented 58%, and those that were clas-sified as eutrophic corresponded to 77.7%. The average HEI score was 59.7 (IC95%: 58.6-60.7), being 58.9 (IC95%: 57.3-60.4) for girls and 60.5 (IC95%: 58.8-62.1) for boys.
In relation to socioeconomic variables, a gradient of improved food quality could be clearly observed to correspond to an increased number of years of schooling of the head of the family. Adolescents with a head of family with 12 or more years of schooling had a 46% lower risk of having a HEI score in the 1st quartile and those with
per capita income equal to or greater than three minimum salaries had a 29% lower risk than families with income lower than one minimum salary (Table 1).
The results of Poisson multiple regres-sion analysis (data not included in tables) revealed that the prevalence of adolescents
with diets in the 1st quartile of the HEI was
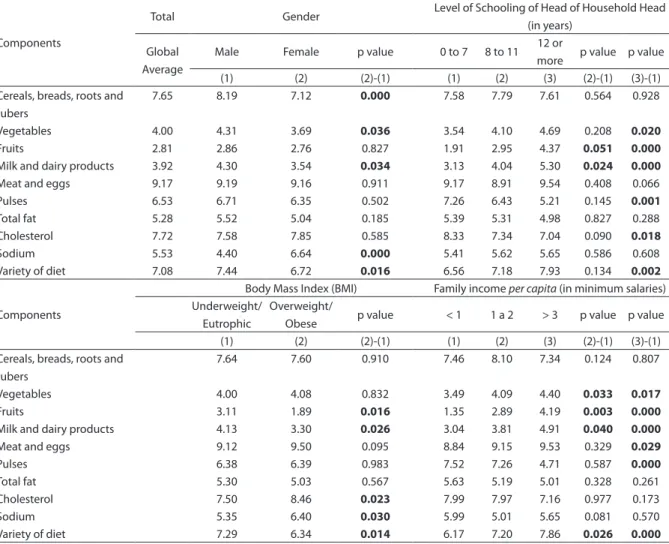
significantly lower (RP=0.54; IC95%: 0.32-0.92) in households with a head of family with a greater level of schooling. When the scores of each component of the HEI (Table 2) were evaluated, low scores (< 5) were found for the components vegetables, fruits, and milk and dairy products, and only the component meat and eggs had a high score (> 8), with the remaining components having intermediate scores (5 to 8). The ave-rages of boys were significantly superior to those of girls for four components (cereals and derivatives, vegetables, milk and dairy products and variety of diet), while girls had a higher average than boys only for the com-ponent sodium. There were higher scores for the components vegetables, fruits, milk and dairy products and variety of diet, and lower scores for the components pulses and cholesterol among the group of adolescents whose head of family had 12 or more years of schooling compared to those with up to seven years of schooling. Overweight or obe-se adolescents had higher average intakes in the cholesterol and sodium groups and lower average scores for fruits, milk and dairy products, and variety of diet. In segments with higher per capita income, there was greater consumption of the components vegetables, fruits, milk and dairy products, meat and eggs and variety of diet and lower consumption of pulses (Table 2).
Table 1 - Prevalence and prevalence ratio (PR) of diets in the irst quartile of HEI, according to demographic, socioeconomic and BMI variables in 12 to 19 year-old adolescents. Campinas, São Paulo State, Brazil, 2002. Tabela 1 - Prevalência e razão de prevalência (RP) de dietas no 1º quartil do IQD, segundo variáveis demográicas, socioeconômicas e IMC em adolescentes de 12 a 19 anos. Campinas, SP, 2002.
Variables N %
Prevalence 1º Quartile (IC 95%)
RP (IC95%)
Gender 0,1695*
Male 205 49.4 21.4 (15.9-28.2) 1.00
Female 204 50.5 28.0 (21.9-35.1) 1.31 (0.88-1.95)
Total 409 100 24.7 (20.7-29.3)
Age Group (years) 0.0886*
12-15 211 51.4 21.7 (17.1-27.1) 1.00
16-19 198 48.5 28.0 (22.2-34.7) 1.29 (0.96-1.74)
Ethnic Background 0.8542*
Caucasian 293 71.0 24.5 (19.9-29.7) 1.00
Non-Caucasian 116 29.0 25.4 (17.7-35.0) 1.04 (0.70-1.54)
Religion 0.9683*
Catholic 254 61.0 24.8 (19.8-30.7) 1.00
Protestant 96 25.0 25.4 (15.9-37.9) 1.02 (0.60-1.74)
Others 58 14.0 23.7 (14.3-36.5) 0.95 (0.57-1.58)
Number of people living in household 0.7925*
1-3 66 16.0 21.8 (13.6-33.1) 1.00
4-5 236 58.0 25.3 (19.3-32.3) 1.16 (0.67-2.01)
6 or + 107 26.0 25.3 (18.0-34.3) 1.16 (0.76-1.76)
Level of schooling of head of family (years) 0.0751*
0-7 175 44.0 31.0 (25.0-37.8) 1.00
8-11 135 33.0 22.0 (14.6-31.9) 0.71 (0.45-1.12)
12 and + 98 23.0 16.8 (9.5-27.8) 0.54 (0.32-0.92)
Per capita income (in minimum salaries**) 0.0492*
<1 129 32.0 31.7 (26.3-37.6) 1.00
1 to 2 145 36.0 20.5 (13.8-29.2) 0.64 (0.43-0.97)
≥3 135 32.0 22.5 (16.9-29.4) 0.71 (0.51-0.98)
Occupation of adolescent 0.1651*
Yes 86 21.0 29.7 (23.4-36.8) 1.26 (0.90-1.75)
No 321 79.0 23.6 (18.7-29.3) 1.00
Body Mass Index (BMI) 0.4659*
Underweight 14 3.7 12.2 (2.74-40.9) 0.51 (0.13-2.02)
Eutrophic 303 77.7 24.1 (19.2-29.8) 1.00
Overweight 52 13.8 28.7 (18.9-41.1) 1.19 (0.73-1.96)
Obese 19 4.7 32.3 (16.0-54.5) 1.34 (0.72-2.49)
*Valor de p de teste χ². / *p-value of Chi-square test.
**Salário mínimo vigente à época da pesquisa: março a abril/2001 = R$ 151,00; maio/2001 a março/2002 = R$ 180,00 e abril a setembro/2002 = R$ 200,00. **Minimum wage at the time of the survey: March to April/2001 = R$ 151.00; May/2001 to March/2002 = R$ 180.00 and April to September/2002 = R$ 200.00.
the highest strata (at the threshold of sta-tistical significance). For BMI, overweight or obese adolescents had a lower average score for the component fruits (at the threshold of statistical significance) and a higher average score for the group meat and eggs.
Discussion
Additionally, differences were identified between sex, schooling, income and the BMI of the adolescent in relation to different components of the quality of diet index.
The HEI score (59.7) revealed by the present study was similar to that found in population studies of adolescents performed in municipal districts in the state of São Paulo
11,15, and in Chile 16. It was slightly lower than
the score verified in the study by Fernández et al. 17, of adolescents in the city of Guadalajara
(Spain) and that found for North American adolescents by Goodwin et al. 18.
In the segment of greater level of scho-oling of the head of the family (12 years or more) a lower prevalence of poor quality of
diet was observed among adolescents in Campinas, as was observed in studies per-formed in other countries 18,19. Education is a
factor of inequality, capable of perpetuating the cycle of poverty from generation to ge-neration and preventing the individual from reaching the goals necessary for human de-velopment, one of which is adequate diet 20.
Regarding the components of the HEI, those that had lower scores were fruits, vegetables, and milk and dairy products. These findings are consistent with other Brazilian studies that also observed low in-take of fruits, vegetables and milk and dairy products in the diet of adolescents 3,11,15. The
component with the highest score was meat
Table 2 - Mean score of the components of the HEI according to the sex and schooling of head of household, BMI and income per capita. Campinas, São Paulo State, Brazil, 2002.
Tabela 2 - Média de pontos dos componentes do IQD segundo sexo, escolaridade do chefe da família, IMC e renda familiar per capita. Campinas, SP, 2002.
Components
Total Gender Level of Schooling of Head of Household Head
(in years)
Global Average
Male Female p value 0 to 7 8 to 11 12 or
more p value p value
(1) (2) (2)-(1) (1) (2) (3) (2)-(1) (3)-(1)
Cereals, breads, roots and tubers
7.65 8.19 7.12 0.000 7.58 7.79 7.61 0.564 0.928
Vegetables 4.00 4.31 3.69 0.036 3.54 4.10 4.69 0.208 0.020
Fruits 2.81 2.86 2.76 0.827 1.91 2.95 4.37 0.051 0.000
Milk and dairy products 3.92 4.30 3.54 0.034 3.13 4.04 5.30 0.024 0.000
Meat and eggs 9.17 9.19 9.16 0.911 9.17 8.91 9.54 0.408 0.066
Pulses 6.53 6.71 6.35 0.502 7.26 6.43 5.21 0.145 0.001
Total fat 5.28 5.52 5.04 0.185 5.39 5.31 4.98 0.827 0.288
Cholesterol 7.72 7.58 7.85 0.585 8.33 7.34 7.04 0.090 0.018
Sodium 5.53 4.40 6.64 0.000 5.41 5.62 5.65 0.586 0.608
Variety of diet 7.08 7.44 6.72 0.016 6.56 7.18 7.93 0.134 0.002
Components
Body Mass Index (BMI) Family income per capita (in minimum salaries) Underweight/
Eutrophic
Overweight/
Obese p value < 1 1 a 2 > 3 p value p value
(1) (2) (2)-(1) (1) (2) (3) (2)-(1) (3)-(1)
Cereals, breads, roots and tubers
7.64 7.60 0.910 7.46 8.10 7.34 0.124 0.807
Vegetables 4.00 4.08 0.832 3.49 4.09 4.40 0.033 0.017
Fruits 3.11 1.89 0.016 1.35 2.89 4.19 0.003 0.000
Milk and dairy products 4.13 3.30 0.026 3.04 3.81 4.91 0.040 0.000
Meat and eggs 9.12 9.50 0.095 8.84 9.15 9.53 0.329 0.029
Pulses 6.38 6.39 0.983 7.52 7.26 4.71 0.587 0.000
Total fat 5.30 5.03 0.567 5.63 5.19 5.01 0.328 0.261
Cholesterol 7.50 8.46 0.023 7.99 7.97 7.16 0.977 0.173
Sodium 5.35 6.40 0.030 5.99 5.01 5.65 0.081 0.570
and eggs, a result similar to the findings of studies of adolescents in other countries 16,17
and some municipal districts in the state of São Paulo 15.
In the present study, adolescents from the segment of higher family income had a lower consumption of the group cereals and derivatives, as verified by Levy-Costa et al. 21 using data from the “Pesquisa de
Orçamentos Familiares” (Household Food Budget Survey - HFBS) to evaluate the evolution of food consumption in the me-tropolitan areas of Brazil.
A higher score was observed for the component vegetables, at the threshold of statistical significance, in the segment
of greater schooling of head of family, as reported in other studies 11,22,23.
The component fruits had the highest score in segments of higher income, corro-borating findings of other studies 3,21,24. In
situations of food insecurity the consump-tion of fruits is drastically reduced as a result of the higher prices of this type of food. The study by Panigassi et al. 25 demonstrated a
strong decreasing tendency in the intake of fruits from those families with secure diets to those with light, moderate or serious food insecurity. For BMI, lower consump-tion of fruits (at the threshold of statistical significance) was identified in adolescents with overweight/obesity. Using data on the
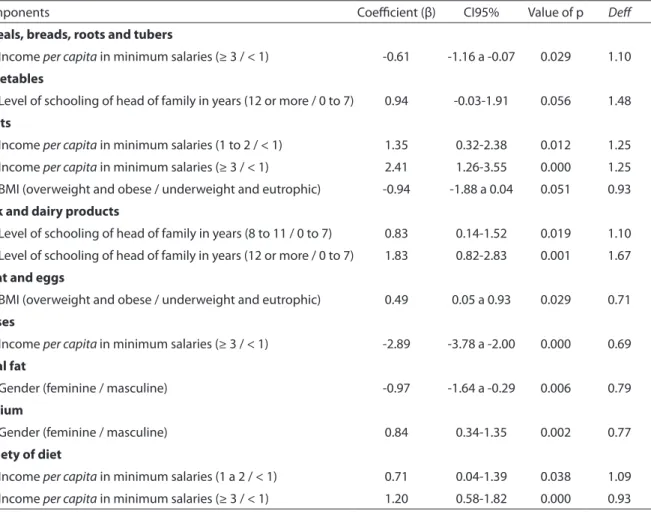
Tabela 3 - Modelo de regressão linear múltipla: variáveis associadas a cada componente do IQD em adolescentes de 12 a 19 anos. Campinas, SP, 2002.
Table 3 - Multiple linear regression model: variables associated with each HEI component in 12 to 19 year-old adolescents. Campinas, São Paulo State, Brazil, 2002.
Components Coeicient (β) CI95% Value of p Def
Cereals, breads, roots and tubers
Income per capita in minimum salaries (≥ 3 / < 1) -0.61 -1.16 a -0.07 0.029 1.10
Vegetables
Level of schooling of head of family in years (12 or more / 0 to 7) 0.94 -0.03-1.91 0.056 1.48 Fruits
Income per capita in minimum salaries (1 to 2 / < 1) 1.35 0.32-2.38 0.012 1.25 Income per capita in minimum salaries (≥ 3 / < 1) 2.41 1.26-3.55 0.000 1.25 BMI (overweight and obese / underweight and eutrophic) -0.94 -1.88 a 0.04 0.051 0.93
Milk and dairy products
Level of schooling of head of family in years (8 to 11 / 0 to 7) 0.83 0.14-1.52 0.019 1.10 Level of schooling of head of family in years (12 or more / 0 to 7) 1.83 0.82-2.83 0.001 1.67
Meat and eggs
BMI (overweight and obese / underweight and eutrophic) 0.49 0.05 a 0.93 0.029 0.71 Pulses
Income per capita in minimum salaries (≥ 3 / < 1) -2.89 -3.78 a -2.00 0.000 0.69 Total fat
Gender (feminine / masculine) -0.97 -1.64 a -0.29 0.006 0.79
Sodium
Gender (feminine / masculine) 0.84 0.34-1.35 0.002 0.77
Variety of diet
Income per capita in minimum salaries (1 a 2 / < 1) 0.71 0.04-1.39 0.038 1.09 Income per capita in minimum salaries (≥ 3 / < 1) 1.20 0.58-1.82 0.000 0.93
food intake of North American children and adolescents participating in the National Health and Nutrition Examination Survey, Lorson et al.26 also found that obese
indivi-duals ate significantly less fruit compared to eutrophic individuals, a finding that has been verified by other authors27. Fruit is rich
in micronutrients and fibers28 and has low
energy density, which provides a positive increase in satiety and satiation, contribu-ting to the control of healthy body weight29.
For the component milk and dairy pro-ducts, significantly higher scores were found for higher levels of schooling, corroborating findings of a number of studies performed in other locations11,22,23. The results of PeNSE 3 revealed a positive association with the
regular consumption of milk with level of maternal schooling. Milk and derivative products are sources of calcium, an essential nutrient, especially in adolescence, for the processes of bone formation and proper linear growth and for the prevention of the development of osteoporosis in adult life28.
For the group meat and eggs, a signifi-cantly higher score was found in overweight or obese adolescents, as has been observed by other studies27,30.
A lower average score was observed for the pulses group, in the segment with higher family income. PeNSE3 showed a significant
reduction in the regular frequency of bean consumption with an increase in maternal schooling level, and among adolescents studying in private schools. Results of stu-dies in Brazil found that the consumption of beans and other pulses revealed a tendency to decline with increased spending power21,
although beans are excellent sources of protein, fibers, carbohydrates, and micro-nutrients, and possess a nutritional profile suitable for all ages31.
For the component total fat, there was greater consumption among girls than among boys, a result that can be explained by the more regular intake of sweet biscuits and cold meats according to the findings of PeNSE3. For the component sodium, there
was lower consumption among girls, as was also observed in the study by Godoy
et al.11. Feskanich et al.32 and Brown et
al.33 also verified greater intake of sodium
among boys. The excessive consumption of sodium is an important risk factor for arterial hypertension, coronary disease and cerebrovascular accident2. Based on HFBS
data for 2002-03, Sarno et al.34 found that the
quantity of available sodium for consump-tion in Brazilian households (4.5 grams/ person/day) more than twice exceeded the maximum recommended dose, making this intake a significant issue for public health policy in relation to non-communicable diseases. Actions aimed at addressing this issue have been conducted through a part-nership between the Department of Health and the food industry that provides for the gradual reduction of sodium in various industrialized products by 201435.
In relation to variety of diet it was found that greater family income led to a higher average score for the component, as was also found by Godoy et al. 11 in relation to the
level of schooling of the head of the family. Variety of food is an essential requisite of a healthy diet, as it guarantees the provision of a range of nutrients, preventing the deve-lopment of nutritional deficiencies28.
The present study revealed the existence of social inequality in the diet of adoles-cents, influencing the scores of various HEI components, and also the global indicator. These findings indicate the necessity of special attention for more socially vulnera-ble segments, but even among groups with higher levels of income and schooling, the intake of fruits, vegetables and milk and derivatives was below recommended levels, which indicates the importance of overall orientation.
The design effect (deff) is a useful para-meter in epidemiological studies that use conglomerates at any stage of the sampling process, as it signals the suitability of the sample complex in terms of precision, taking as a base data supplied by a simple random sample 36. Table 3 shows the values
small differences between the average score of each component, of up to 0.49 for the meat and eggs group, with the majority of components with deff close to 1. This means that the sample complex did not affect the precision of the calculations.
One of the limits of the present sample refers to the application of only one 24-hour recall survey, which does not necessarily reflect the usual food intake of adolescents, due to the variability of consumption. Memory errors, difficulty in quantifying the size of portions, the under or over reporting of food, among others, are also concerns 37.
However, R24h is considered a suitable tool for evaluating the average intake of foods and nutrients for a large number of indivi-duals 38. Another limitation of this study was
the fact that the survey covered a broad sub-ject, without specific focus or concentrating on any one diet item. The cross-sectional study, in turn, prevents the interpretation of results for cause and effect, such as associa-tion with BMI. The use of self-reported in-formation for size and height represented a further limitation, especially in adolescents passing through a phase of rapid growth and physical development. A study of ado-lescents in Florianopolis revealed that only the minimum percentage reported weight and health exactly 39. However the author
verified that the reported measurements were very close to true measurements, and considered the information valid for use in epidemiological studies 39, as has been
established by other authors 40. This study
referred to data collected in 2001-2002 and serves as a base line for monitoring the quality of diet of adolescents when using data from the periodic health surveys im-plemented for this population group. With respect to the instrument used to evaluate quality of diet it is necessary to consider if the HEI is capable of capturing the com-plexity of food consumption patterns, used for directing health promotion strategies and nutritional education. It is, however,
an instrument with limitations, as each of the components contributes equally to the total score, without considering the impact of each food group on health 41. The overall
HEI score, compared to the score of its com-ponents, displays less frequent associations with its independent variables, as synthesi-zing the elements of diet does not reveal the specifics of each component. In this study the association with overall indicator was only verified in bivariate analysis for income and level of schooling of head of family, and for components, associations with income, schooling, gender and BMI was verified. In the study of Godoy et al. 11, the overall HEI
was associated only with gender, however when each component was analyzed with sex and level of schooling of head of family a number of associations were observed. The results of the study revealed that as well as overall HEI it is relevant to analyses each component of the indicator separately. The findings of this study warn of the existence of poor dietary quality of ado-lescents and the need to promote healthy eating, especially for groups that are more socially vulnerable. It also indicated the need to monitor the dietary habits of this age group to detect tendencies of change, and the incorporation of a healthy dietary profile, as well as to accompany the level of social inequality prevalent in diet.
Collaborators
References
1. World Health Organization. Child and adolescent health and development: progress report 2009: highlights. Geneva; 2010.
2. Brasil. Ministério da Saúde. Secretaria de Vigilância em Saúde. Departamento de Análise de Situação de Saúde.
Plano de ações estratégicas para o enfrentamento das doenças crônicas não transmissíveis (DCNT) no Brasil 2011-2022. Brasília; 2011.
3. Levy RB, Castro IRR, Cardoso LO, Tavares LF, Sardinha LMV, Gomes FS et al. Consumo e comportamento alimentar entre adolescentes brasileiros: Pesquisa Nacional de Saúde do Escolar (PeNSE), 2009. Rev Cien Saúde Colet 2010; 15(S2): 3085-97.
4. Toral N, Slater B, Cintra IP, Fisberg M. Comportamento alimentar de adolescentes em relação ao consumo de frutas e verduras Rev Nutr 2006; 19(3): 331-40.
5. Instituto Brasileiro de Geografia e Estatística. Pesquisa de Orçamentos Familiares – 2008-2009: análise do consumo alimentar pessoal no Brasil. Rio de Janeiro; 2011.
6. Instituto Brasileiro de Geografia e Estatística. Pesquisa de Orçamentos Familiares – 2008-2009: antropometria e estado nutricional de crianças, adolescentes e adultos no Brasil. Rio de Janeiro; 2010.
7. Cervato AM, Vieira VL. Índices dietéticos na avaliação da qualidade global da dieta. Rev Nutr 2003; 16(3): 347-55.
8. Kennedy ET, Ohls J, Carlson S, Fleming K. The Healthy Eating Index: Design and applications. J Am Diet Assoc
1995; 95: 1103-8.
9. Fisberg RM, Slater B, Barros RR, Lima FD, Cesar CLG, Carandina L et al. Índice de Qualidade da Dieta: avaliação da adaptação e aplicabilidade. Rev Nutr 2004; 17(3): 301-8.
10. Alves MCGP. Plano de amostragem. In: Barros MBA, Cesar CLG, Carandina L, Goldbaum M, org.
As dimensões da saúde: inquérito populacional em Campinas. São Paulo: Aderaldo & Rothschild; 2008. p. 46-55.
11. Godoy FC, Andrade SC, Morimoto JM, Carandina L, Goldbaum M, Barros MBA et al. Índice de qualidade da dieta de adolescentes residentes no distrito do Butantã, município de São Paulo, Brasil. Rev Nutr 2006; 19(6): 663-71.
12. Thompson FE, Byers T. Dietary assessment resource manual. J Nutr 1994; (S124): 2245-317.
13. Onis M de, Onyango AW, Borghi E, Siyam A, Nishida C, Siekmann J. Development of a WHO growth reference for school-aged children and adolescents. Bull World Health Organ 2007; 85: 660-67.
14. Nielsen SJ, Adair L. An alternative to dietary data exclusions. J Am Diet Assoc 2007; 107: 792-99.
15. Andrade SC de, Barros MBA, Carandina L, Goldbaum M, Cesar CLG, Fisberg RM. Dietary Quality Index and associated factors among adolescents of the State of Sao Paulo, Brazil. J Peds 2010; 156(3): 456-60.
16. Pinheiro AC, Atalah E. Propuesta de una metodología de análisis de la calidad global de la alimentación. Rev Méd Chile 2005; 133(2): 175-82.
17. Fernández I, Aguilar Vilas MV, Mateos Vega CJ, Martínez Para MC. Calidad de la dieta de una población de jóvenes de Guadalajara. Nutr Hosp 2009; 24: 200-6.
18. Goodwin DK, Knol LK, Eddy JM, Fitzhugh EC, Kendrick O, Donohue RE. Sociodemographic correlates of overall quality of dietary intake of US adolescents. Nutr Res
2006; 26: 105-10.
19. Garriguet D. Diet quality in Canada. Stat Canada 2009; 20(3): 1-12.
20. Gomes MA, Pereira MLD. Família em situação de vulnerabilidade social: uma questão de políticas públicas. Cien Saúde Colet 2005; 10(2): 357-63.
21. Levy-Costa RB, Sichieri R, Pontes NS, Monteiro CA. Disponibilidade domiciliar de alimentos no Brasil: distribuição e evolução. Rev Saúde Pública 2005; 39(4): 530-40.
22. Fisberg RM, Morimoto JM, Bueno MB. Hábito alimentar: Qualidade da dieta. In: Barros MBA, Cesar CLG, Carandina L, Goldbaum M (org). As dimensões da saúde. Inquérito populacional em Campinas. São Paulo: Aderaldo & Rothschild; 2008. p. 59-66.
23. Ortiz-Hernández L, Gómez-Tello BL. Food consumption in Mexican adolescents. Rev Panam Salud Publica/Pan Am J Public Health 2008; 24(2): 127-35.
24. Riediger ND, Shooshtari S, Moghadasian MH. The influence of sociodemographic factors on patterns of fruit and vegetable consumption in Canadian adolescents. J Am Diet Assoc 2007; 107: 1511-8.
25. Panigassi G, Segall-Corrêa AM, Marin-León L, Pérez-Escamilla R, Maranha LK, Sampaio MFA. Insegurança alimentar intrafamiliar e perfil de consumo de alimentos. Rev Nutr 2008; 21(S): 135-44.
26. Lorson BA, Melgar-Quinonez HR, Taylor CA. Correlates of fruit and vegetable intakes in US children. J Am Diet Assoc 2009; 109: 474-78.
27. Amin TT, Al-Sultan AI, Ali A. Overweight and obesity and their relation to dietary habits and sócio-demographic characteristics among male primary school children in Al-Hassa, Kingdom of Saudi Arabia. Eur J Nutr 2008; 47(6): 310-18.
29. Rolls BJ, Ello-Martin JA, Tohill BC. What can intervention studies tell us about the relationship between fruit and vegetable consumption and weight management? Nutr Rev 2004; 62(1): 1-17.
30. Villa I, Yngve A, Poortvliet E, Grjibovski A, Liiv K, Sjöström M et al. Dietary intake among under-, normal- and overweight 9- and 15-year-old Estonian and Swedish schoolchildren. Public Health Nutr 2007; 10(3): 311-22.
31. Winham D, Webb D, Barr A. Beans and good health. Nutr Today 2008; 43(5): 201-9.
32. Feskanich D, Rockett HRH, Colditz GA. Modifying the Healthy Eating Index to assess diet quality in children and adolescents. J Am Diet Assoc 2004; 104(9): 1375-83.
33. Brown IJ, Tzoulaki I, Candeias V, Elliott P. Salt intakes around the world: implications for public health. Int J Epidemiol 2009; 38(9): 791-813.
34. Sarno F, Claro RM, Levy RB, Bandoni DH, Ferreira SRG, Monteiro CA. Estimativa de consumo de sódio pela população brasileira, 2002-2003. Rev Saúde Pública
2009; 43(2): 219-25.
35. Ministério da Saúde. Consea acompanhará acordos para redução de sódio e gordura nos alimentos.. Disponível em http://portal.saude.gov.br/portal/aplicacoes/ noticias/default.cfm? pg=dspDetalheNoticia&id_ area=124&CO_NOTICIA=12686 [Acessado em 4 de julho de 2011]
36. Sousa MH, Silva NN. Estimativas obtidas de um levantamento complexo. Rev Saúde Pública 2003; 37(5): 662-70.
37. Fisberg RM, Martini LA, Slater B. Métodos de inquéritos alimentares. In: Fisberg RM, Slater B, Marchioni DML, Martini LA. Inquéritos alimentares: métodos e bases científicos. São Paulo: Editora Manole; 2005. p. 1-31.
38. Willett WC. Nutritional epidemiology. 2nd ed. New York: Oxford University Press; 1998.
39. Júnior JCF. Validade das medidas autorreferidas de peso e estatura para o diagnóstico do estado nutricional de adolescentes. Rev Bras Saúde Matern Infant 2007; 7(2): 167-174.
40. Fonseca H, Silva AM, Matos MG, Esteves I, Costa P, Guerra A et al. Validity of BMI based on self-reported weight and height in adolescents. Acta Paediatrica 2010; 99(1): 83-88.
41. Waijers PMCM, Feskens EJM, Ocké MC. A critical review of predefined diet quality scores. Br J Nutr 2007; 97(2): 219-31.