1
Secretaria do Estado da Saúde de São Paulo, Instituto de Saúde, Centro de Pesquisa e Desenvolvimento para o Sistema Único de Saúde. R. Santo Antônio, 590, Bela Vista, São Paulo, SP, Brasil. Correspôndência para/Correspondence to: SRDM SALDIVA. E-mails: <[email protected]>; <[email protected]>.
2
Universidade de São Paulo, Faculdade de Medicina, Departamento de Obstetrícia e Ginecologia. São Paulo, SP, Brasil. 3
Universidade de São Paulo, Faculdade de Medicina, Departamento de Pediatria. São Paulo, SP, Brasil. Support: Fundação de Amparo à Pesquisa do Estado de São Paulo (Protocol nº 2009/17315-9).
Feeding and nutritional profiles of children
at 12 months of age living in the western
region of the city of
São Paulo
:
The Procriar Project
Perfil alimentar e nutricional de crianças no
final do primeiro ano de vida residentes
na região Oeste do município de
São Paulo
:
Projeto ProcriAr
Silvia Regina Dias Medici SALDIVA1
Patrícia Gama BONINI1
Sonia Isoyama VENANCIO1
Rossana Pulcineli Vieira FRANCISCO2
Sandra Elisabete VIEIRA3
A B S T R A C T
Objective
To analyze the feeding profiles, nutritional statuses and influences of maternal characteristics on food consumption of infants at the end of the first year of life.
Methods
and vegetables and a minimum acceptable diet composed of minimum dietary diversity and minimum meal frequency. Logistic regression models were constructed to evaluate the association between maternal variables and the outcomes studied.
Results
A total of 254 infants were evaluated, of whom 10.7% were overweight. The majority of the infants did not receive a minimum acceptable diet (58.7%), 28.0% consumed petit suisse cheese and 42.0% received added sugar in their preparations. Mothers less than 20 years old or with more schooling were more likely to offer unhealthy foods to their children (p=0.03). Fruits, legumes and vegetables (consumption was higher among children of mothers over 20 years old (p=0.04).
Conclusion
The study revealed a high prevalence of overweight and an inadequacy of food consumption among children. The finding that adolescent mothers and/or mothers with more schooling tend to offer inadequate food to children may favor the definition of specific educational strategies.
Keywords: Infant nutrition. Overweight. Supplementary feeding.
R E S U M O
Objetivo
Analisar o perfil alimentar, o estado nutricional e a influência das características maternas sobre o consumo alimentar de lactentes ao final do primeiro ano de vida.
Métodos
Trata-se de um estudo transversal aninhado a uma coorte de gestantes que avaliou crianças com idade média de 12,1 meses. Foram aferidos o peso e comprimento e calculado o índice de massa corporal. O consumo alimentar foi obtido através de recordatório de 24 horas, avaliado de forma qualitativa. Os desfechos estudados dicotomicamente (sim/não) foram: sobrepeso (índice de massa corporal ≥+2 score-Z), consumo de alimentos considerados não saudáveis (açúcar, queijo petit suisse, bolacha recheada, refrigerantes entre outros), consumo de frutas, legumes e verduras e dieta mínima aceitável composta pela diversidade mínima da dieta e frequência mínima de refeições. Foram construídos modelos de regressão logística para avaliar a associação entre variáveis maternas e os desfechos estudados.
Resultados
Foram avaliados 254 lactentes sendo 10,7% classificados com excesso de peso. A maioria não recebeu dieta mínima aceitável (58,7%), 28,0% consumiram queijo petit suisse e 42,0% receberam açúcar adicionado às preparações. Mães com menos de 20 anos ou com maior escolaridade tiveram maior chance de oferecer ali-mentos não saudáveis aos filhos (p=0,03). O consumo de frutas, legumes e verduras foi maior entre os filhos de mães acima de 20 anos (p=0,04).
Conclusão
O estudo revelou alta prevalência de sobrepeso e inadequação do consumo alimentar entre as crianças. A identificação de que mães adolescentes e/ou com maior escolaridade tendem a oferecer alimentação inadequada às crianças pode favorecer a definição de estratégias educativas específicas.
Palavras-chave: Nutrição do lactente. Sobrepeso. Suplementação alimentar.
I N T R O D U C T I O N
Eating habits in the first year of life are determinants of the formation of eating habits and the health and nutrition profiles of children [1]. Inadequate food consumption is
associated with increased morbidity, especially infectious diseases, malnutrition, overweight and micronutrient deficiencies [2].
(WHO) recommends that strategies for the prevention and control of childhood obesity be directed especially at the first years of life because this time frame is a window of opportunity for interventions on eating habits, physical activity and sleep duration [3]. These interventions should mainly involve the family due to their importance in the formation of eating habits, self-control of food intake and formation of a pattern of eating behavior. The home environment and family lifestyle exert a strong influence on food preferences and may affect the nutritional balance of food [4-7].
In the face of current scientific evidence on the deleterious consequences of inadequate infant feeding in the short and long term, the WHO and the Brazilian Ministry of Health have developed manuals and guides for parents and caregivers with strategies for adequate dietary guidance during this phase of life [8-11].
National studies on the dietary patterns of children in the first two years of life note a predominantly dairy diet with insufficient amounts of vegetables, legumes and meats and the inclusion of food considered unhealthy [12-14]. This scenario attracted the attention of national and international organizations, which recently intensified actions to promote healthy supplementary food.
In this context, the present study aims to analyze the feeding profiles of infants at the end of the first year of life. The infants were born to mothers participating in a cohort of pregnant women of the ProcriAr Project. Additionally, we studied the influence of maternal characteristics on the patterns of food consumption by the infants.
M E T H O D S
This study is part of the study “Influence of Nutritional Factors and Urban Atmospheric Pollutants on Lung Health of Children: A cohort study in pregnant women from the western area
of the city of São Paulo – ProcriAr” (“Influência dos fatores Nutricionais e Poluentes Atmosféricos Urbanos na Saúde Pulmonar de Crianças: um estudo de coorte em gestantes da Zona Oeste do município de São Paulo: ProcriAr”), which was approved by the Research Ethics Committees of CAPPesq (0068/10) and the São Paulo city hall (CAEE: 0205.0.162.162-10).
This is a cross-sectional study nested within a cohort of pregnant women (N=384). The study involves a non-probabilistic sample in which complete data for children between 10 and 13 months of age obtained at the last cohort follow-up visit were analyzed. Approximately 30% of the children were lost during follow-up.
In the original cohort study, the inclusion criteria were pregnant women with a gestational age less than 13 weeks (confirmed by ultrasonography) who were enrolled in prenatal care at 3 health units of the west region of the city of São Paulo Unidade Basica de Saúde
([UBS, Basic Health Unit] Jardim Boa Vista, UBS
Jardim São Jorge and UBS Paulo VI). Those with twins and with the following morbidities were excluded: hypertension, diabetes Mellitus, cardiopathies, pneumopathies or other chronic diseases. Quarterly domiciliary visits were performed during the pregnancy in which clinical exams were performed to evaluate health conditions and questionnaires were applied on food consumption by the pregnant women. Additional information was collected on age, ethnicity, schooling, income, marital status and formal work.
infant anthropometer (Sanny, São Bernardo do Campo, SP, Brazil; scale in centimeters).
For the nutritional diagnosis of the children, Body Mass Index (BMI) was used following the reference standard of the WHO [16] according to gender and age and was analyzed with the Anthro v.3.2.2 program (World Health Organization, Geneva, Switzerland). Children with values lower than -2 Z-scores were considered to have malnutrition, those with values above -2 and below +1 were considered eutrophic, those with values greater than +1 and less than or equal to +2 were considered at risk of overweight, and those with values above +2 Z-scores were considered overweight [16].
Infant food intake was assessed by applying a 24–hour recall to the mothers following the WHO recommendations [8]. The dietary practices of the children were analyzed qualitatively according to the following indicators adopted by the WHO: consumption of solid or pasty foods, minimum dietary diversity, minimum frequency of meals and minimum acceptable diet [8,9].
For construction of the indicator “consumption of solid or pasty foods”, the original indicator was adapted considering the recommendations of the Ministry of Health of Brazil [10], which suggests that a child should receive the same food consumed by the family from the age of 8 months with minor modifications that include mashed, shredded, crushed or minced food. For this study, rice, beans, pasta, potatoes, meats, eggs, vegetables and fruits in pieces and mashed food were considered.
The Minimum Dietary Diversity (MDD) indicator was constructed from the consumption of any amount of food from each of the following groups: (1) cereals, breads and tubers; (2) legumes and vegetables; (3) fruits; (4) milk and dairy products, including breast milk, cow milk, infant formulas, yogurts and cheeses; (5) meats, offal and eggs and (6) leguminous foods. The MDD indicator was considered adequate
when the child consumed at least one food from 4 or more of the above groups.
The Minimum Meal Frequency indicator took into account the number of meals received during a day without distinction between meals and snacks. In this study, we considered only salty preparations, such as rice, beans, pasta, potatoes, meats, eggs and offal, for lunch and dinner. Consumption of milk, breads, plain biscuits and fruits was considered a snack depending on the time at which the child ate them. This indicator was used as a proxy for energy intake [9].
Following the recommendation of the Ministry of Health [10], this indicator was considered adequate for breastfed children when they consumed 5 meals/day; for those not breastfed, the addition of one more meal (collation) was recommended for a total of 6 meals/day. However, the WHO [9] recommends one meal less for each category (i.e., 4 meals for breastfed children and 5 for non-breastfed children). In this study, the two recommendations were evaluated for comparison purposes.
The concomitant consumption of these foods was evaluated for the Fruit, Legume and Vegetable (FLV) consumption indicator.
The Minimum Acceptable Diet (MAD) indicator is composed of both minimum dietary diversity and minimum meal frequency following the recommendations of the Brazilian Guide [10,11].
The “unhealthy food consumption” indicator was also analyzed according to the “Ten steps for a healthy diet: Food guide for children under two years old” (“Dez passos para uma alimentação saudável: Guia alimentar para crianças menores de dois anos”) of the Ministry of Health of Brazil [10].
drinks and processed juices as well as sugar added to the preparations. For the calculation of the indicator of unhealthy foods, the consumption of at least one of the foods mentioned above was considered.
A descriptive analysis of the results was performed, and logistic regression models were elaborated by adopting “unhealthy food consumption” and “FLV consumption” as the outcomes. The following maternal explanatory variables were considered: age (≤20 years or >20 years), ethnicity (white or brown/black), schooling (≤8 years or >8 years), marital status (married/consensual union or single/separate/ widow), income (≤3 minimum wages or >3 minimum wages), work (work outside the home or housewife/student), birth weight (<2500g or ≥2500g), consumption of breast milk (yes or no), and gender of the child (female or male). In the final model, the gender and weight excess variables were inserted as fitting variables, and those presenting p<0.20 were included in the bivariate analysis. The significance level adopted was p≤0.05 considering two-tailed alternative hypotheses.
The data analyses were performed using the Epi Info (Centers for Disease Control and Prevention, Atlanta, Georgia, United States) 3.5 program and Stata version 11 (College Station, Texas, United States).
R E S U L T S
A total of 254 children participated in this study. The characteristics of the studied children and their mothers are presented in Table 1.
Table 2 presents the indicators of the quality of food received by children. More than half of the children consumed food in pieces that was rich in iron and attained the minimum diet diversity. Most breastfed and non-breastfed children met the WHO recommendation regarding the number of meals per day, but less than half of the children were considered adequate
Table 1. Characteristics of mothers and children aged 10 to 13 months. ProcriAr Project. São Paulo (SP), Brazil, 2016.
Characteristics n %
Mothers Age
±20 years 25 13.8
>20 years 219 86.2
Ethnicity
White 99 39.1
Brown/Black 154 60.9
Education
≤8 years 193 76.3
>8 years 60 23.7
Missing 1
Income
≤3 minimum wages 157 61.8
>3 minimum wages 42 16.5
Not declared 55 21.7
Marital status
Single/Separate 88 34.8
Married/Consensual Union 165 65.2
Work out of the home
Yes 116 45.7
No 138 54.3
Type of delivery
Normal/Forceps 100 54.4
Caesarean section 84 45.6
Parity
Primiparous 111 43.7
Multiparous 143 56.3
Childrens
Gender
Male 121 47.6
Female 133 52.4
Birth weight
Low weight 16 06.4
Adequate weight 233 93.6
Mean age 12.1 months
Nutritional diagnosis
BMI/Age
Undernourished 3 01.2
Eutrophic 158 62.7
Risk of overweight 64 25.4
Overweight 22 08.7
according to the Brazilian Guide. Slightly more than half of the children did not meet the MAD.
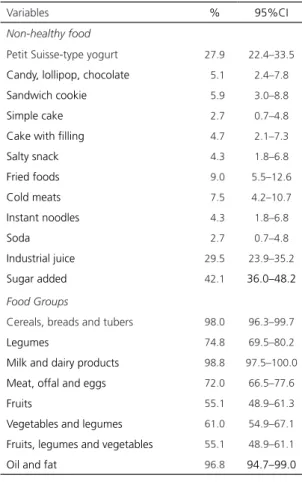
The food consumption is detailed in Table 3. In the analysis of the unhealthy patterns of food marker consumption for this age group, the high consumption of petit suisse type cheese, industrialized juice and the addition of sugar to the preparations stands out.
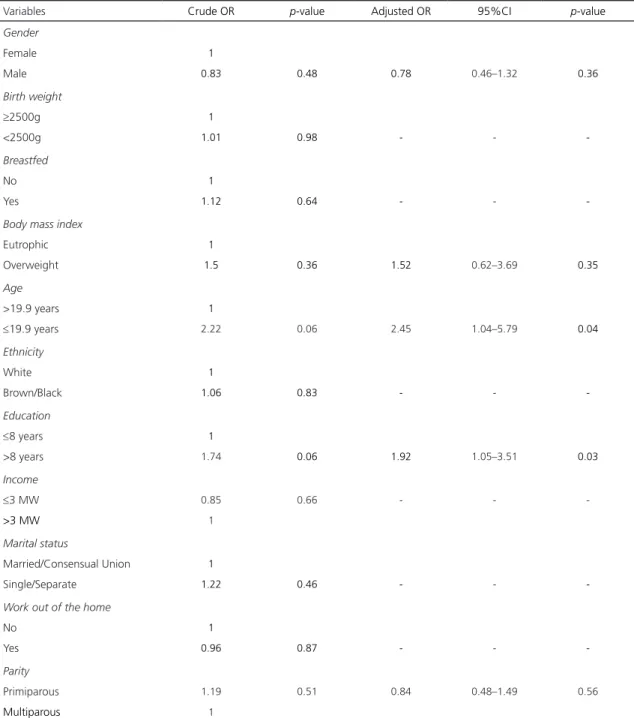
The logistic analysis results (Table 4) showed that mothers under the age of 20 years or with more schooling were more likely to offer unhealthy foods to their children.
Table 2. Feeding characteristics of infants aged 10 to 13 months. São Paulo (SP), Brazil, 2016.
Food quality indicators n %
Consumption of solid or pasty foods
In pieces 159 63.1
Mashed 76 30.2
Sieved/Liquefied 17 06.7
Food consumption of iron source
Yes 232 91.3
No 20 07.9
Minimum dietary diversity
<4 Food Groups 41 16.1
≥4 Food Groups 218 85.8
Breastfeeding
Yes 109 42.9
No 145 57.1
Minimum meal frequency Breastfed Children
Up to 3 meals 17 15.6
4 meals* 41 37.6
5 or more meals** 51 46.8
Non-breastfed children
Up to 4 meals 29 20.0
5 meals* 61 42.1
6 meals** 55 37.9
Minimum acceptable diet
Appropriate 105 41.3
Inappropriate 149 58.7
Note: *World Health Organization [8,9] (recommends 4 meals for
breastfed children and adding one additional meal for non-breastfed children); **Ministry of Health [10] (recommends 5 meals for breastfed
children and one meal for the non-breastfed children).
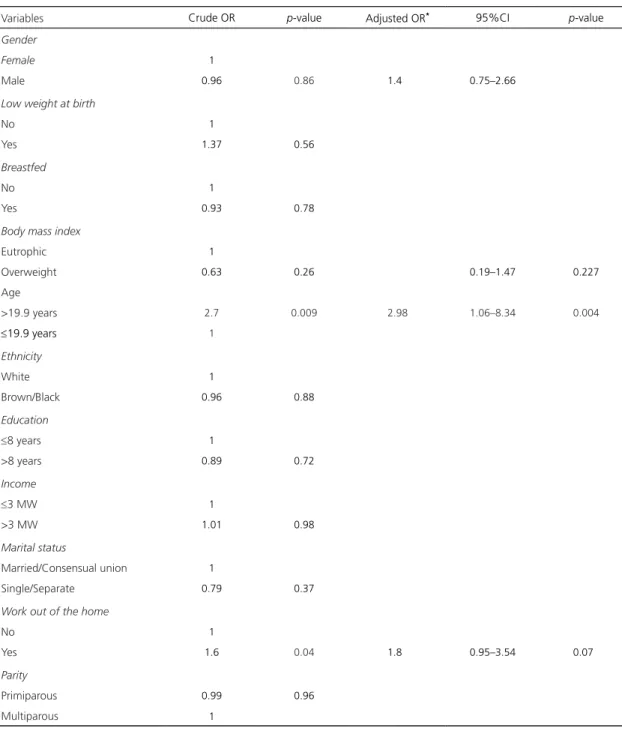
We also observed that FLV consumption was higher among the children whose mothers were 20 years or older in the adjusted analysis and with the interaction of the mother’s schooling and income variables (Table 5).
D I S C U S S I O N
The present study presents a high prevalence of overweight infants at the end of the first year of life. The food consumption analysis showed that an unhealthy nutritional balance of the diet and maternal characteristics, such as age and education, were associated with the dietary profiles of the children.
Table 3. Proportions and 95% Confidence Intervals (95%CI) of consumption of food considered unhealthy and of food groups according to the Ministry of Health proposal (2013) in children aged 10 to 13 months. São Paulo (SP), Brazil, 2016.
Variables % 95%CI
Non-healthy food
Petit Suisse-type yogurt 27.9 22.4–33.5
Candy, lollipop, chocolate 05.1 2.4–7.8
Sandwich cookie 05.9 3.0–8.8
Simple cake 02.7 0.7–4.8
Cake with filling 04.7 2.1–7.3
Salty snack 04.3 1.8–6.8
Fried foods 09.0 5.5–12.6
Cold meats 07.5 4.2–10.7
Instant noodles 04.3 1.8–6.8
Soda 02.7 0.7–4.8
Industrial juice 29.5 23.9–35.2
Sugar added 42.1 36.0–48.2
Food Groups
Cereals, breads and tubers 98.0 96.3–99.7
Legumes 74.8 69.5–80.2
Milk and dairy products 98.8 97.5–100.0
Meat, offal and eggs 72.0 66.5–77.6
Fruits 55.1 48.9–61.3
Vegetables and legumes 61.0 54.9–67.1
Fruits, legumes and vegetables 55.1 48.9–61.1
Table 4. Estimates of crude and adjusted Odds Ratios (OR) with respective 95% Confidence Intervals (95%CI) and p-values for variables associated with unhealthy food intake in children aged 10 to 13 months. São Paulo (SP), Brazil, 2016.
Variables Crude OR p-value Adjusted OR 95%CI p-value
Gender
Female 1
Male 0.83 0.48 0.78 0.46–1.32 0.36
Birth weight
≥2500g 1
<2500g 1.01 0.98 - -
-Breastfed
No 1
Yes 1.12 0.64 - -
-Body mass index
Eutrophic 1
Overweight 1.5 0.36 1.52 0.62–3.69 0.35
Age
>19.9 years 1
≤19.9 years 2.22 0.06 2.45 1.04–5.79 0.04
Ethnicity
White 1
Brown/Black 1.06 0.83 - -
-Education
≤8 years 1
>8 years 1.74 0.06 1.92 1.05–3.51 0.03
Income
≤3 MW 0.85 0.66 - -
->3 MW 1
Marital status
Married/Consensual Union 1
Single/Separate 1.22 0.46 - -
-Work out of the home
No 1
Yes 0.96 0.87 - -
-Parity
Primiparous 1.19 0.51 0.84 0.48–1.49 0.56
Multiparous 1
The excess weight was higher than the 6.5% reported by the PNDS–2006 for children under 2 years of age in Brazil and similar to the value reported for the southeast region (10.0%). However, this research was performed ten years ago in children under two years of age, which may indicate worsening of children’s nutritional statuses [17]
Table 5. Estimates of crude and adjusted Odds Ratios (OR) with respective 95% Confidence Intervals (95%CI) and p-values for variables associated with fruit, legume and vegetable consumption in children aged 10 to 13 months. São Paulo (SP), Brazil, 2016.
Variables Crude OR p-value Adjusted OR* 95%CI p-value
Gender
Female 1
Male 0.96 0.86 1.4 0.75–2.66
Low weight at birth
No 1
Yes 1.37 0.56
Breastfed
No 1
Yes 0.93 0.78
Body mass index
Eutrophic 1
Overweight 0.63 0.26 0.19–1.47 0.227
Age
>19.9 years 2.7 0.009 2.98 1.06–8.34 0.004
≤19.9 years 1
Ethnicity
White 1
Brown/Black 0.96 0.88
Education
≤8 years 1
>8 years 0.89 0.72
Income
≤3 MW 1
>3 MW 1.01 0.98
Marital status
Married/Consensual union 1
Single/Separate 0.79 0.37
Work out of the home
No 1
Yes 1.6 0.04 1.8 0.95–3.54 0.07
Parity
Primiparous 0.99 0.96
Multiparous 1
Note: *Adjusted analysis considering the interaction between income and maternal schooling.
and 7 months of age was 67.4% [18], in Rio de Janeiro, 60.3% of children under 1 year of age received food at the proper consistency [19], and in Guarapuava, Southern Brazil, the prevalence of adequacy was 77.0% in children between 6 and 8 months of age [20]. However, Garcia et
study were particularly worrisome because the infants were analyzed at the end of the first year of life, when recommendations indicated that they should eat the food consumed by the family. Notably, another repercussion of the late introduction of solid foods was shown by a study in England in which children who were introduced food in pieces after 9 months of age faced greater problems with food and as a consequence consumed less varieties of foods (mainly fruits and vegetables) at 7 years of age [21]
Regarding the consumption of foods considered unhealthy, our results are in line with research previously conducted in Brazil, although the age groups were different. The repercussions of this consumption are deleterious and are associated with anemia, overweight and food allergies, as shown by some studies [22-24]. Additionally, these ultraprocessed foods are manufactured with large amounts of oil, fats, sugars, sodium, additives, flavorings and flavor enhancers to make the products more palatable and are poor in protein, fiber and micronutrients [25], which impairs the food quality offered to children and reduces the consumption of healthy foods [26]. A study in children who consumed sweetened foods early showed that they lost interest in healthy foods, increased their interest in sweet foods and consequently were overweight in the long run [27].
The minimum dietary diversity indicator was met by the majority of the children (96%) studied, showing that the children were able to meet the WHO recommendation in terms of variety [8]. However, because this indicator is considered a proxy for micronutrient density, the ideal is the presence of all food groups daily in the age group studied.
The indicator that evaluates the minimum meal frequency differs from the number of adequate meals proposed by the WHO (2010) and the Brazilian Food Guide, which adds one more meal for each group of children (lactating or not). Considering the WHO recommendation,
we found that the majority of breastfed or non-breastfed children met the recommendation. However, according to the Brazilian Guide, less than half of the children were adequate, especially the group of non-lactating children, in which approximately 63% of the children did not meet the minimum meal frequency. Saldan
et al. [20] also found differences in prevalence in the comparison between the WHO indicator (99%) and the Brazilian Guide (75%). This result should be considered a concern because it is an indicator that is considered a proxy for energy intake [10]. A population study conducted in Nigeria showed that indicators of minimum meal frequency and minimum dietary diversity worsened significantly during the period from 2003–2013 regardless of the socioeconomic statuses of the mothers. Furthermore, mothers with a higher schooling level and access to health services were more likely to meet the minimum acceptable diversity and minimum acceptable diet recommendations [28].
When analyzed separately, the above indicators appear to be more sensitive in populations with food deprivation and low socioeconomic development [29]. However, analysis of the minimum acceptable diet, which was a composite indicator, seemed to better reflect the feeding situation in Brazilian children because less than half of the children received a minimum acceptable diet (45.5%). The study in Rio de Janeiro showed a drop of 67.7% to 56.5% in dietary adequacy from 1998–2008 [19].
In the present study, we observed that adolescent mothers were 2.4 times more likely to offer foods considered unhealthy for their children and were less likely to offer fruits and vegetables (Odds Ratio [OR] = 0.33). Additionally, women with a higher education (>8 years) were 1.9 times more likely to offer unhealthy foods.
consumption of unhealthy foods [30-32]. In relation to this problem, we can consider two hypotheses: the price of fruits and vegetables is high compared to cookies, salty snacks and sweetened liquids and, therefore, easier to provide to children; and teenage mothers tend to adopt unhealthy eating habits, in which FLV consumption is less frequent, and end up offering a similar diet to their children [33].
Among the limitations of this study, we highlight those inherent to studies conducted with self-reported information, which is subject to recall biases or influenced by socially appropriate beliefs or behaviors. The use of 24–hour recall may lead to overestimation of some indicators of infant feeding. Another aspect concerns the studied population, who are children remnants of a cohort study of pregnant women from the western area of the city of São Paulo.
Nevertheless, the results are relevant because they show a high prevalence of infants at the end of the first year of life who do not receive the adequate number of meals per day, do not meet the acceptable minimum diet and receive unhealthy foods at an early age. The finding that adolescent mothers and/or mothers with more schooling tend to offer inadequate supplementary feeding to their children can favor the definition of specific educational strategies for these groups.
In this scenario, permanent education should be implemented for health professionals, and strategies should be expanded to advance the promotion of healthy complementary food. Although we recognize that Brazil has taken an important step in adopting policies to promote healthy complementary feeding, much work still needs to be done in basic health care, including the continuous monitoring of feeding practices during childhood.
A C K N O W L E D G E M E N T S
To Fundação de Amparo à Pesquisa do Estado de São Paulo and Ana Lucia da Silva Castro, Maressa
dos Santos, Larissa Victoriano Moraes, Nathani de Camargo Pereira, Niara Lima da Silva, Isis Bonfitto Gonçalves and Claudia Rodrigues de Oliveira Sales for data collection. To the mothers for collaboration and patience.
C O N T R I B U T I O N S
SRDM SALDIVA contributed to the conception of the study, data analysis and writing of the manuscript. PG BONINI collaborated in the preparation of the database, bibliographic review and writing of the manuscript. SI VENANCIO, RPV FRANCISCO and S VIEIRA collaborated in the design of the study and revision of the manuscript.
R E F E R E N C E S
1. Thompson AL, Bentley ME. The critical period of infant feeding for the development of early disparities in obesity. Soc Sci Med. 2013;97:288-96.
2. World Health Organization. Infant and young child feeding: A tool for assessing national practices, policies and programs. Geneva: WHO; 2003.
3. World Health Organization. Consideration of the evidence on childhood obesity for the Commission on Ending Childhood Obesity: Report of the ad hoc working group on science and evidence for ending childhood obesity. Geneva: WHO; 2016.
4. Birch LL, Doub AE. Learning to eat birth to age 2 y. Am J Clin Nutr. 2014;99(3):723S-8S.
5. Alder EM, Willians FL, Anderson AS, Forsyth S, Florey CV, van der Velde P. What influences the timing of the introduction of solid food to infants? Br J Nutr. 2004;92(3):527-37.
6. Francis LA, Hofer SM, Birch LL. Predictors of maternal child-feeding style: Maternal and child characteristics. Appetite. 2001;37(3):231-43. https:// doi.org/10.1006/appe.2001.0427
7. Skouteris H, McCabe M, Swinburn B, Newgreen V, Sacher P, Chadwick P. Parental influence and obesity prevention in pre-schoolers: A systematic review of interventions. Obes Rev. 2011;12(5):315-28.
8. World Health Organization. Indicators for assessing infant and young child feeding practices: Conclusions of a consensus meeting held 6–8 November 2007. Washington (DC): WHO; 2008.
10. Ministério da Saúde (Brasil). Secretaria de Atenção à Saúde. Dez passos para uma alimentação saudável: guia alimentar para crianças menores de dois anos. 2ª ed. Brasília: Ministério da Saúde; 2013.
11. Ministério da Saúde (Brasil). ENPACS: Estratégia Nacional para Alimentação Complementar Saudá-vel. Brasília: Ministério da Saúde; 2010.
12. Farias-Junior G, Osorio MM. Padrão alimentar de crianças menores de cinco anos. Rev Nutr. 2005;18(6):793-802. https://doi.org/10.1590/S141 5-52732005000600010
13. Garcia MT, Granado FS, Cardoso MA. Complementary feeding and nutritional status of 6–24–month–old children in Acrelândia, Acre State, Western Brazilian Amazon. Cad Saúde Pública. 2011;27(2):305-16.
14. Saldiva SR, Escuder MM, Mondini L, Levy RB, Venancio SI. Feeding habits of children aged 6 to 12 months and associated maternal factors. J Pediatr. 2007;83(1):53-8.
15. Ministério da Saúde (Brasil). Secretaria de Atenção à Saúde. Orientações para a coleta e análise de dados antropométricos em serviços de saúde. Norma Técnica do Sistema de Vigilância Alimentar e Nutricional – Sisvan. Brasília: Ministério da Saúde; 2011
16. World Health Organization. Multicentre Growth Reference Study Group. WHO child growth standards: Length/height–for–age, weight–for–age, weight–forlength, weight-for-height and body mass index–for–age: Methods and development. Geneva: WHO; 2006.
17. Cocetti M, Taddei JA, Konstantyner T, Konstantyner TC, Barros Filho AA. Prevalence and factors associated with overweight among Brazilian children younger than 2 years. J Pediatr. 2012;88(6):503-8.
18. Rodríguez Suárez A, Jiménez Acosta S, Pineda Pérez S, Quintana Jardínez I, Mustelier Ochoa H. Lactancia materna y prácticas alimentarias en niñas y niños menores de dos años de edad en Cuba. Rev Esp Nutr Comun. 2011;17(1):13-9.
19. Oliveira DA, Castro IR, Jaime PC. Complementary feeding patterns in the first year of life in the city of Rio de Janeiro, Brazil: Time trends from 1998 to 2008. Cad Saúde Pública. 2014;30(8):1755-64.
20. Saldan PC, Venancio SI, Saldiva SR, de Mello DF. Proposal of indicators to evaluate complementary feeding based on World Health Organization indicators. Nurs Health Sci. 2016;18(3):334-41.
21. Coulthard H, Harris G, Emmett P. Delayed introduction of lumpy foods to children during the complementary feeding period affects child’s food acceptance and feeding at 7 years of age. Mater Child Nutr. 2009;5(1):75-85.
22. Heitor SF, Rodrigues LR, Santiago LB. Introdução de alimentos supérfluos no primeiro ano de vida e as repercussões nutricionais. Ciênc Cuid Saúde. 2011;10(3):430-6.
23. Corrêa EN, Corso AC, Moreira EA, Kazapi IA. Complementary feeding and maternal characteristics of children younger than two years old in Florianópolis, Santa Catarina, Brasil. Rev Paul Pediatr. 2009;27(3):258-64.
24. Ventura AK, Mennella JA. Innate and learned preferences for sweet taste during childhood. Curr Opin Clin Nutr Metabol Care. 2011;14(4):379-84.
25. Monteiro CA, Cannon G, Moubarac JC, Levy RB, Louzada ML, Jaime PC. The UN Decade of Nutrition, the NOVA food classification and the trouble with ultra-processing. Public Health Nutr. 2017;1-13. https://doi.org/10.1017/S1368980017000234
26. Beauchamp GK, Menella JA. Early flavor learning and its impact on later feeding behavior. J Pediatr Gastroenterol Nutr. 2009;48(Suppl.1):S25-30.
27. Park S., Pan L., Sherry B., & Li R. The association of sugar-sweetened beverage intake during infancy with sugar-sweetened beverage intake at 6 years of age. Pediatrics. 2014;134(Suppl.1):S56-S62.
28. Ogbo FA, Page A, Idoko J, Claudio F, Agho KE. Trends in complementary feeding indicators in Nige-ria, 2003–2013. BMJ Open. 2015;5(10):e008467. https://doi.org/10.1136/bmjopen-2015-008467
29. Senarath U, Agho KE, Akram DS, Godakandage SSP, Hazir T, Jayawickrama H, et al. Comparisons of complementary feeding indicators and associated factors in children aged 6–23 months across five South Asian countries. Mater Child Nutr. 2012;(8Suppl.1):89-106. https://doi.org/10.1111/j. 1740-8709.2011.00370.x
30. Hendricks K, Briefel R, Novak T, Ziegler P. Maternal and child characteristics associated with infant and toddler feeding practices. J Am Diet Assoc. 2006;106(1):135-48.
31. Betoko A, Charles MA, Hankard R, Forhan A, Bonet M, Saurel-Cubizolles MJ, et al. Infant feeding patterns over the first year of life: Influence of family characteristics. Eur J Clin Nutr. 2013;67(6):631-7. https://doi.org/10.1038/ ejcn.2012.200
32. Smithers LG, Brazionis L, Golley RK, Mittinty MN, Northstone K, Emmett P, et al. Associations between dietary patterns at 6 and 15 months of age and sociodemographic factors. Eur J Clin Nutr. 2012;66(6):658.
33. Lima APE, Javorski M, Vasconcelos MGL. Práticas alimentares no primeiro ano de vida. Rev Bras Enferm. 2011;645(5):912-8.