DOI: 10.1590/0004-282X20160100
ARTICLE
The immunogenetics of multiple sclerosis. The
frequency of HLA-alleles class 1 and 2 is lower in
Southern Brazil than in the European population
Imunogenética na esclerose múltipla. A frequência dos alelos HLA classe 1 e 2 no sul do
Brasil são menores que da população Europeia
Lineu Cesar Werneck1, Paulo José Lorenzoni1, Raquel Cristina Arndt1, Cláudia Suemi Kamoi Kay1,
Rosana Herminia Scola1
he major histocompatibility complex (MHC), which is also known as the human leukocyte antigen system (HLA), is a set of specialized glycoproteins expressed on the surface of lymphocytes and encoded by genes located on chromo
-some 6p21.3. hese glycoproteins are responsible for recog
-nizing cells that contain a pathogenic organism, that are for
-eign to the body or whose surfaces have sufered changes1. Several polymorphisms have been found in the HLA genes, and this variability determines individual characteristics of the immune responses to infectious agents and foreign cells.
hese responses are critical in cases of transplantation and in the pathogenesis of autoimmune diseases, such as ankylos
-ing spondylitis, type 1 diabetes mellitus, narcolepsy, Reiter’s syndrome, myasthenia gravis and multiple sclerosis (MS)1,2,3.
he irst link between MS and HLA was reported in 1973 and involved HLA-DR2. A similar association for other HLA class II has since been reported by other authors, who as
-sumed that the disease is related to patient ethnicity and pos
-sible to environmental factors that are unknown yet3,4. A strong correlation was found between MS and HLA-DRB1*15:01 in
1Universidade Federal do Paraná, Hospital de Clínicas, Departamento de Clínica Médica, Serviço de Neurologia, Curitiba PR, Brasil.
Correspondence: Lineu Cesar Werneck; Hospital de Clínicas; Rua General Carneiro, 181 / 3°andar / sala 310; 80060-900 Curitiba PR, Brasil; E-mail: lineu. [email protected]
Conflict of interest: There is no conlict of interest to declare.
Support: This study was supported in part by Conselho Nacional de Desenvolvimento Cientíico e Tecnologico (CNPq), Coordenação de Aperfeiçoamento de Pessoal de Nível Superior (CAPES), Serono and Biogen.
Received 18 May 2016; Received in inal form 25 May 2016; Accepted 25 May 2016. ABSTRACT
Objective: To study the HLA of class 1and 2 in a multiple sclerosis (MS) population to verify the susceptibility for the disease in the Southern Brazil. Methods: We analyzed patients with MS and controls, by direct sequencing of the genes related to HLA DRB1, DQB1, DPB1, A, B and C alleles with high resolution techniques. Results: We found a lower frequency of all HLA alleles class 1 and 2 in MS and controls comparing to the European population. Several alleles had statistical correlation, but after Bonferroni correction, the only allele with signiicance was the HLA-DQB1*02:03, which has a positive association with MS. Conclusions: Our data have different frequency of HLA-alleles than the previous published papers in the Southeast Brazil and European population, possible due to several ethnic backgrounds.
Keywords: genetic predisposition to disease; HLA antigens; immunogenetics; major histocompatibility complex; multiple sclerosis.
RESUMO
Objetivo: Estudo do HLA classes 1 e 2 em pacientes com esclerose múltipla (EM) a im de veriicar a susceptibilidade para a doença em uma população do Sul do Brasil. Métodos: Foram analisados por sequenciamento direto de alta resolução os genes relacionados com os HLA DRB1, DQB1, DPB1, A, B e C em casos de EM comparados com uma população controle normal. Resultados: Foi encontrado uma frequência menor dos alelos dos HLA classe 1 e 2 nos casos de EM e controles quando comparado com a população Europeia. Diversos alelos mostraram correlação estatística, mas depois da correção de Bonferroni, somente o alelo do HLA-DQB1*02:03 foi positivo para a EM. Conclusões: Encontramos frequência diferente dos alelos do HLA relatados previamente nos Sudeste do Brasil e Europeus, possivelmente devido a origem étnica diferente da população estuda.
northern European countries5; DRB1*15:01, DRB1*03:01 and DRB1*04:05 in Italy (Sardinia Islands)6; DRB1*15:01-DQA1 *01:02-DQB1*06:02, DRB1* 04:02-DQA1*03:01-DQB1*03:02 and DRB1*13:03-DQA1*05-DQB1*03:01 in Spain (in the prov
-ince of Biscay)7; DRB1*15:01 and DQB1*0:602 in Ireland8
; and DRB1*04:03 and DRB1*08:02 in Mexico9. An associa
-tion was also found between MS and the DQA1*01:02 and DQB1*06:02 haplotypes in African-Brazilian patients whether the DRB1*15:01 allele was absent10.
In recent years, researchers have turned their attention to HLA class I and its alleles. Initially performed with low resolution techniques, HLA typing showed that HLA-A*02 is negatively associated with the risk of MS (i.e., it is associated with a protective efect/reduction in susceptibility) regard
-less of the presence of the DRB1*15 allele11. Haplotype studies have shown that, HLA-A*02 reduces susceptibility to the dis
-ease (protective efect) when associated with HLA-B*12 and HLA-Cw*05. he same occurred if this allele was associated with HLA-Cw*05 and HLA-B*4411,12. he presence of the allele Cw*05 in the haplotype reduce the expression of HLA-B12 and DRB1*15 and the susceptibility to the disease11,13.
In light of the above, the aim of this study is to analyze the HLA class 1 and 2 proiles, with high resolutions technique, of MS patients of a Southern Brazil population to identify whether there is relationship between HLA type and suscep
-tibility to MS in the Southern Brazilian population.
METHODS
Patients and controls
We analyzed 86 patients with a diagnosis of MS, 80 with the relapsing-remitting subtype and 6 with the primary pro
-gressive subtype, predominantly of white color, based on the 2010 McDonald criteria and 2013 revision14. he cases had followed up at the demyelinating disease outpatient clinic at the Hospital de Clínicas, Universidade Federal do Paraná. MS patients who fulilled the following criteria were includ
-ed: (1) patient born in the south of Brazil and lived there for most of his/her life; (2) patient’s complete medical records available (both clinical and laboratory data that information on the clinical course of the disease was available); (3) patient evaluated with the Expanded Disability Status Scale (EDSS) during treatment or follow-up or data in the patient’s records suicient to allow the disability to be graded; and (4) indings of patient’s MRI studies compatible with MS. We excluded MS patients who had incomplete medical records, conlict
-ing data, clinically isolated syndrome, neuromyelitis optica or incomplete outcome data that did not allow other diseas
-es to be ruled out (Table 1).
he control group consisted of bone marrow donors who fulilled the following criteria: 1) absence of any disease; 2) over 30 years old; 3) born and had always lived in south
-ern Brazil; 4) only two unrelated members of the transplant
recipient’s household could be included (mother and fa
-ther), and in the parents’ absence only one sibling could be included; and 5) HLA screening performed in Curitiba at the Immunogenetics Laboratory, Hospital de Clínicas, Universidade Federal do Paraná (All data were kindly sup
-plied by Dr. Noemi Farah Ferreira and her laboratory team). he number of controls included in the study was 606 donors for HLA-DRB1 (1212 alleles), 220 for HLA-DQB1 (440 alleles), 133 for HLA-DPB1 (266 alleles), 127 for HLA-A (254 alleles), 168 for HLA-B (336 alleles) and 111 for HLA-C (222 alleles).
he study was approved by the Ethics Committee for Research with Humans at the Hospital de Clínicas, Universidade Federal do Paraná. All patients agreed to par
-ticipate and signed a consent form.
HLA Typing
Genomic DNA was extracted from blood using a stan
-dard phenol-chloroform technique after treatment with proteinase-K and then ampliied by polymerase chain reac
-tion (PCR) to obtain gene fragments (exons) related to HLA class I and II using oligonucleotides lanking speciic regions of the following exons: HLA-A (exons 2, 3 and 4), HLA-B (exons 2, 3 and 4), HLA-C (exons 2, 3 and 4), HLA-DRB1 (exon 2), HLA-DPB1 (exon 2) and HLA-DQB1 (exons 2 and 3). PCR was performed separately for each exon of these difer
-ent genes using a conv-entional method with Taq DNA poly
-merase (Abbott Molecular Diagnostics) and a SBT (sequence based typing) kit (AlleleSEQR-SBT) (Atria Genetics) follow
-ing the manufacturers’ instructions. PCR products were pu
-riied by ExoSAP-IT® (USB, Cleveland, Ohio). he pu-riied
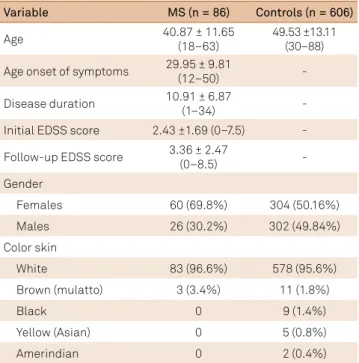
Table 1. Characteristics of multiple sclerosis (MS) patients and
control group.
EDSS: expanded disability status scale.
Variable MS (n = 86) Controls (n = 606)
Age 40.87 ± 11.65
(18–63)
49.53 ±13.11 (30–88) Age onset of symptoms 29.95 ± 9.81
(12–50) -
Disease duration 10.91 ± 6.87
(1–34) -
Initial EDSS score 2.43 ±1.69 (0–7.5) - Follow-up EDSS score 3.36 ± 2.47
(0–8.5) -
Gender
Females 60 (69.8%) 304 (50.16%)
Males 26 (30.2%) 302 (49.84%)
Color skin
White 83 (96.6%) 578 (95.6%)
Brown (mulatto) 3 (3.4%) 11 (1.8%)
Black 0 9 (1.4%)
Yellow (Asian) 0 5 (0.8%)
PCR products were then subjected to a second round of PCR using Big Dye Mix® (Applied Biosystems) followed by purii
-cation of the products by the isopropanol method. he am
-pliied fragments were directly sequenced in forward and reverse directions by luorescent capillary electrophoresis using POP-6 polymer (Applied Biosystems, Foster City, CA) in an ABI PRISM 3100 and 3130 Avant Genetic Analyzers® (Hitachi High-Technologies Corporation, Tokyo, Japan). he HLA sequences were compared with reference sequences by high-resolution HLA typing using Assign SBT software (Conexio-Genomics, Fremantle, Australia) and uTYPE®HLA Analysis Software (hermo Fisher Scientiic, Waltham, MA).
Statistical analysis
Descriptive statistics were calculated for age (MS cas
-es and controls) and age at onset of symptoms, EDSS score at disease onset and EDSS score at the last evaluation (MS cases). he relationships between the MS cases and controls were calculated with Pearson’s chi-square test using Yates’ correction. Statistical signiicance was considered for p < 0.05. hese values were then corrected by Bonferroni methods ac
-cording the number of alleles analyzed. he Odds Ratio was estimate with the Mantel-Haenszel statistic method.
RESULTS
he HLA-DRB1 was sequenced in 86 cases, HLA-DQB1 and DPB1 in 85, HLA-A in 64, HLA-B in 65 and HLA-C in 85. hese data were not uniform because of ambiguities and technical artifacts found in some patients.
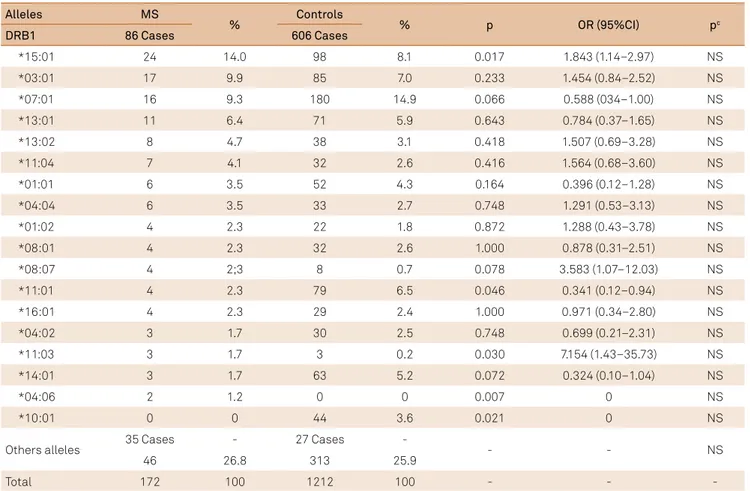
HLA-DRB1: We found 52 diferent alleles in MS and 44
in controls. Of those, 19 alleles occurred only in MS and 11 only in controls. he most common allele in MS patients and controls was DRB1*15:01, which was present in a high
-er p-ercentage of individuals in the MS group. his was fol
-lowed by *03:01 and *07:01 alleles. DRB1*15:01, *11:03 and *04:06 alleles. hey were statistically signiicant to MS, but all of them were non signiicant after Bonferroni correction for the 63 alleles. he same occurred with DRB1*11:01 and *10:01 alleles in the controls (Table 2).
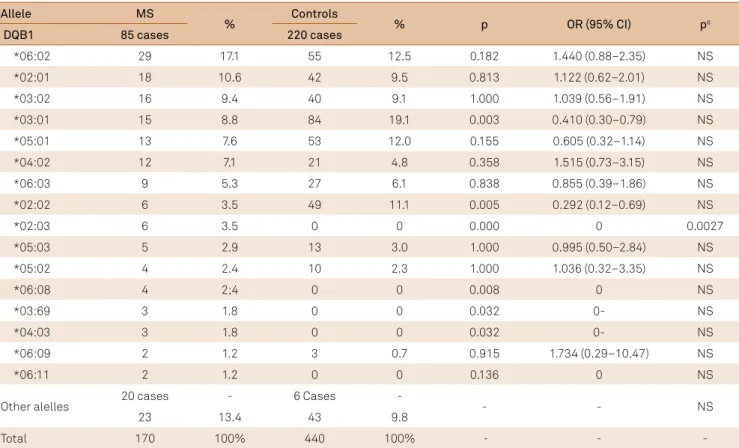
HLA-DQB1: We found 35 diferent alleles in MS and 17 in
controls. Of those, 19 alleles occurred only in MS and only 1 control did not have the same allele that MS. he most com
-mon allele was DQB1*06:02 in MS, followed by *02:01 and *03:02. he DQB1*02:03, *03:69 and *04:03 alleles were sta
-tistically signiicant, whereas in the controls DQB1 *03:01 and *02:02 alleles were more frequent. After the Bonferroni
Table 2. Frequency of the HLA-DRB1 in multiple sclerosis and control group.
Alleles MS
% Controls % p OR (95%CI) pc
DRB1 86 Cases 606 Cases
*15:01 24 14.0 98 8.1 0.017 1.843 (1.14–2.97) NS
*03:01 17 9.9 85 7.0 0.233 1.454 (0.84–2.52) NS
*07:01 16 9.3 180 14.9 0.066 0.588 (034–1.00) NS
*13:01 11 6.4 71 5.9 0.643 0.784 (0.37–1.65) NS
*13:02 8 4.7 38 3.1 0.418 1.507 (0.69–3.28) NS
*11:04 7 4.1 32 2.6 0.416 1.564 (0.68–3.60) NS
*01:01 6 3.5 52 4.3 0.164 0.396 (0.12–1.28) NS
*04:04 6 3.5 33 2.7 0.748 1.291 (0.53–3.13) NS
*01:02 4 2.3 22 1.8 0.872 1.288 (0.43–3.78) NS
*08:01 4 2.3 32 2.6 1.000 0.878 (0.31–2.51) NS
*08:07 4 2;3 8 0.7 0.078 3.583 (1.07–12.03) NS
*11:01 4 2.3 79 6.5 0.046 0.341 (0.12–0.94) NS
*16:01 4 2.3 29 2.4 1.000 0.971 (0.34–2.80) NS
*04:02 3 1.7 30 2.5 0.748 0.699 (0.21–2.31) NS
*11:03 3 1.7 3 0.2 0.030 7.154 (1.43–35.73) NS
*14:01 3 1.7 63 5.2 0.072 0.324 (0.10–1.04) NS
*04:06 2 1.2 0 0 0.007 0 NS
*10:01 0 0 44 3.6 0.021 0 NS
Others alleles 35 Cases - 27 Cases - - - NS
46 26.8 313 25.9
Total 172 100 1212 100 - -
correction for 36 alleles, only the allele DQB1*02:03 was sig
-niicant (p = 0.0027) (Table 3).
HLA-DPB1: We found 30 diferent alleles in MS and 22 in
controls. In MS, 14 alleles occurred only in this group and 6 controls did not have similar MS allele. he most common alleles in the MS group and controls were *04:01, *02:01 and *04:02. he *23:01 and *51:01 alleles were statistically signii
-cant, but they lost the signiicance after Bonferroni correc
-tion for the 36 alleles (Table 4).
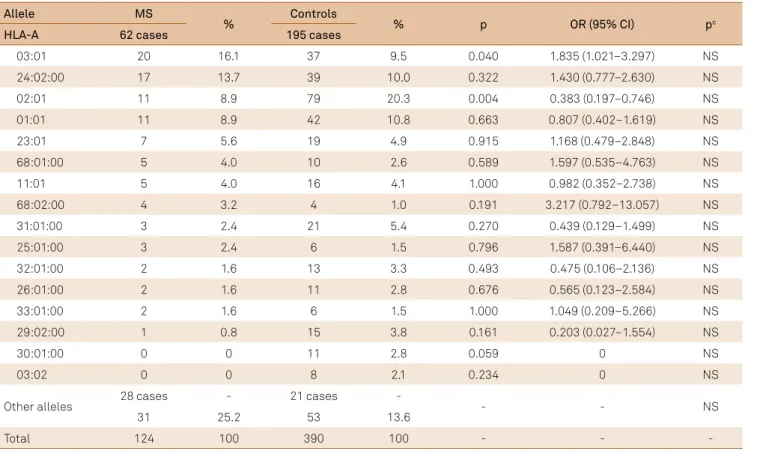
HLA-A: We found 42 diferent alleles in MS and 32 in controls. In MS, 22 alleles occurred only in this group and 12 controls did not have similar allele in MS. he most com
-mon alleles in the MS group were *03:01 and *24:02. he al
-leles *24:02 and *02:01 had statistical signiicance, but they become non signiicant after Bonferroni correction for the 57 alleles (Table 5).
HLA-B: We found 60 diferent alleles in MS and 76 in
controls. In MS group, 25 alleles did not occurred in the controls and 42 of the controls did not have similar allele in MS group. he most common allele in the MS group and controls were *07:02, *51:01 and *35:01. here is a statistical relation with alleles *35:01, *44:02, *14:06, and *52:01, but all of them lost the statistical signiicance after Bonferroni cor
-rection for the 97 alleles (Table 6).
HLA-C: We found 39 diferent alleles in MS and 30 in con
-trols. In MS group, 20 alleles did not occurred in controls and
11 of the controls did not have the same MS allele. he most common alleles in the MS group and controls were *04:01, *07:02 and *08:02. HLA-C*07:27 was the only allele with statis
-tical correlation, but it lost the signiicance after Bonferroni correction (Table 7).
DISCUSSION
HLA-DRB1*15:01 is considered a major susceptibility al
-lele, but other HLA alleles in the haplotype, as well as the way that they were transmitted, can increase or decrease this sus
-ceptibility. hese other alleles (of the same or diferent class) can determine epistatic interactions and modiications or epi
-genetic variations that may change the expression of nearby genes, determining greater or lesser susceptibility to MS13,15,16.
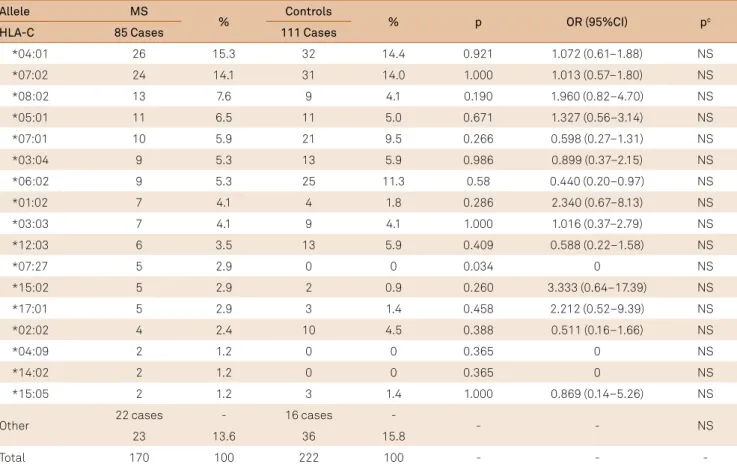
Although the frequency of DRB1*15:01 in our study was increased, the frequencies of this and other alleles were low
-er for both, MS patients and controls, compared with that reported in Europeans17. We found association but after the Bonferroni correction disappeared. his diference may be explained by the number of cases studied and the inluence of the mixing of European, African and indigenous genes in Brazil18 (Figure 1).
In three Brazilian studies the percentage of the DRB1*15:01 allele was high, especially in white individuals19,20 and women21.
Table 3. Frequency of the HLA-DQB1 in multiple sclerosis and control group.
MS: multiple sclerosis; p: probability; OR: odds ratio; CI: conidence interval; pc: probability after Bonferroni correction for 36 multiple comparisons for p < 0.05; NS: non signiicant.
Allele MS
% Controls % p OR (95% CI) pc
DQB1 85 cases 220 cases
*06:02 29 17.1 55 12.5 0.182 1.440 (0.88–2.35) NS
*02:01 18 10.6 42 9.5 0.813 1.122 (0.62–2.01) NS
*03:02 16 9.4 40 9.1 1.000 1.039 (0.56–1.91) NS
*03:01 15 8.8 84 19.1 0.003 0.410 (0.30–0.79) NS
*05:01 13 7.6 53 12.0 0.155 0.605 (0.32–1.14) NS
*04:02 12 7.1 21 4.8 0.358 1.515 (0.73–3.15) NS
*06:03 9 5.3 27 6.1 0.838 0.855 (0.39–1.86) NS
*02:02 6 3.5 49 11.1 0.005 0.292 (0.12–0.69) NS
*02:03 6 3.5 0 0 0.000 0 0.0027
*05:03 5 2.9 13 3.0 1.000 0.995 (0.50–2.84) NS
*05:02 4 2.4 10 2.3 1.000 1.036 (0.32–3.35) NS
*06:08 4 2;4 0 0 0.008 0 NS
*03:69 3 1.8 0 0 0.032 0- NS
*04:03 3 1.8 0 0 0.032 0- NS
*06:09 2 1.2 3 0.7 0.915 1.734 (0.29–10.47) NS
*06:11 2 1.2 0 0 0.136 0 NS
Other alelles 20 cases - 6 Cases - - - NS
23 13.4 43 9.8
Table 5. Frequency of the in multiple sclerosis and control group.
Allele MS
% Controls % p OR (95% CI) pc
HLA-A 62 cases 195 cases
03:01 20 16.1 37 9.5 0.040 1.835 (1.021–3.297) NS
24:02:00 17 13.7 39 10.0 0.322 1.430 (0.777–2.630) NS
02:01 11 8.9 79 20.3 0.004 0.383 (0.197–0.746) NS
01:01 11 8.9 42 10.8 0.663 0.807 (0.402–1.619) NS
23:01 7 5.6 19 4.9 0.915 1.168 (0.479–2.848) NS
68:01:00 5 4.0 10 2.6 0.589 1.597 (0.535–4.763) NS
11:01 5 4.0 16 4.1 1.000 0.982 (0.352–2.738) NS
68:02:00 4 3.2 4 1.0 0.191 3.217 (0.792–13.057) NS
31:01:00 3 2.4 21 5.4 0.270 0.439 (0.129–1.499) NS
25:01:00 3 2.4 6 1.5 0.796 1.587 (0.391–6.440) NS
32:01:00 2 1.6 13 3.3 0.493 0.475 (0.106–2.136) NS
26:01:00 2 1.6 11 2.8 0.676 0.565 (0.123–2.584) NS
33:01:00 2 1.6 6 1.5 1.000 1.049 (0.209–5.266) NS
29:02:00 1 0.8 15 3.8 0.161 0.203 (0.027–1.554) NS
30:01:00 0 0 11 2.8 0.059 0 NS
03:02 0 0 8 2.1 0.234 0 NS
Other alleles 28 cases - 21 cases - - - NS
31 25.2 53 13.6
Total 124 100 390 100 - - -
MS: multiple sclerosis; p: probability; OR: odds ratio; CI: conidence interval; pc : probability after Bonferroni correction for 57 multiple comparisons for p < 0.05. NS: non signiicant.
Table 4. Frequency of the HLA-DPB1 in multiple sclerosis and control group.
Allele MS
% Controls % p OR (95%CI) pc
DPB1 85 Cases 133 Cases
*04:01 44 25.9 68 25.6 1.000 0.017 (0.65–1.58) NS
*02:01 18 10.6 37 13.9 0.384 0.733 (0.40–1.33) NS
*04:02 18 10.6 40 15.0 0.234 0.669 (0.37–1.21) NS
*03:01 12 7.1 32 12.0 0.129 0.55 (0.28–1.11) NS
*01:01 10 5.9 14 5.3 0.951 1.125 (0.49–2.59) NS
*05:01 9 5.3 10 3.8 0.600 1.431 (0.57–3.60) NS
*10:01 9 5.3 9 3.4 0.465 1.596 (0.62–4.106) NS
*23:01 9 5.3 1 0.4 0.003 14.814 (1.90–118.01) NS
*14:01 5 2.9 12 4.5 0.567 0.641 (0.22–1.85) NS
*13:01 4 2.4 6 2.3 1.000 1.044 (0.29–3.76) NS
*51:01 4 2.4 0 0 0.046 0 NS
*71:01 3 1.8 0 0 0.114 0 NS
*06:01 2 1.2 4 1.5 1.000 0.780 (0.14–4.30) NS
*11:01 2 1.2 10 3.8 0.191 0.305 (0.07–1.41) NS
*20:01 2 1.2 0 0 0.295 0 NS
*57:01 2 1.2 0 0 0.295 0 NS
Other alelles 14 Cases - 10 Cases - - -
-17 9.7 27 8.5
Total 170 100 266 100 - -
Table 6. Frequency of HLA-B in multiple sclerosis and control group.
Allele MS
% Controls % p OR (95%CI) pc
HLA B 69 cases 234 cases
07:02 15 10.9 31 6,6 0.098 1.719 (0.899–3.287) NS
35:01:00 10 7.2 11 2,4 0.012 3.246 (1.348–7.814) NS
51:01:00 10 7.2 16 3,4 0.051 2.207 (0.978–4.982) NS
14:02 7 5.1 21 4.5 0.773 1.137 (0.473–2.735) NS
18:01 7 5.1 11 2.4 0.171 2.220 (0.844–5.841) NS
44:02:00 7 5.1 7 1.5 0.033 3.519 (1.213–10.213) NS
08:01 5 3.6 19 4.1 1.000 0.888 (0.326–2.424) NS
14:01 5 3.6 8 1.7 0.303 2.162 (0.696–6.718) NS
15:01 5 3.6 13 2.8 0.819 1.316 (0.461–3.758) NS
14:06 3 2.2 0 0 0.012 0 NS
40:01:00 3 2.2 4 0.9 0.411 2.578 (0.570–11.659) NS
41:01:00 3 2.2 1 0.2 0.057 10.378 (1.071–100.577) NS
49:01:00 3 2.2 10 2.1 1.000 1.108 (0.276–3.751) NS
52:01:00 1 0.7 24 5.1 0.041 0.135 (0.018–1.007) NS
15:03 1 0.7 15 3.2 0.195 0.220 (0.029–1.684) NS
38:01:00 0 0 10 2.1 0.177 0 NS
Other alleles 45 cases 59 cases - - - NS
53 38.4 267 55.0
Total 138 100 468 100 - - -
MS: multiple sclerosis; p: probability; OR: odds ratio; CI: conidence interval; pc: probability after Bonferroni correction for 54 multiple comparisons for p < 0.05; NS: non signiicant.
Table 7. Frequency of the HLA-C in multiple sclerosis and control group.
Allele MS
% Controls % p OR (95%CI) pc
HLA-C 85 Cases 111 Cases
*04:01 26 15.3 32 14.4 0.921 1.072 (0.61–1.88) NS
*07:02 24 14.1 31 14.0 1.000 1.013 (0.57–1.80) NS
*08:02 13 7.6 9 4.1 0.190 1.960 (0.82–4.70) NS
*05:01 11 6.5 11 5.0 0.671 1.327 (0.56–3.14) NS
*07:01 10 5.9 21 9.5 0.266 0.598 (0.27–1.31) NS
*03:04 9 5.3 13 5.9 0.986 0.899 (0.37–2.15) NS
*06:02 9 5.3 25 11.3 0.58 0.440 (0.20–0.97) NS
*01:02 7 4.1 4 1.8 0.286 2.340 (0.67–8.13) NS
*03:03 7 4.1 9 4.1 1.000 1.016 (0.37–2.79) NS
*12:03 6 3.5 13 5.9 0.409 0.588 (0.22–1.58) NS
*07:27 5 2.9 0 0 0.034 0 NS
*15:02 5 2.9 2 0.9 0.260 3.333 (0.64–17.39) NS
*17:01 5 2.9 3 1.4 0.458 2.212 (0.52–9.39) NS
*02:02 4 2.4 10 4.5 0.388 0.511 (0.16–1.66) NS
*04:09 2 1.2 0 0 0.365 0 NS
*14:02 2 1.2 0 0 0.365 0 NS
*15:05 2 1.2 3 1.4 1.000 0.869 (0.14–5.26) NS
Other 22 cases - 16 cases - - - NS
23 13.6 36 15.8
Total 170 100 222 100 - -
However, they mixed high-resolution with low-resolution techniques, as well as they have a low number of controls pop
-ulation to identify the DRB1*15:01 allele.
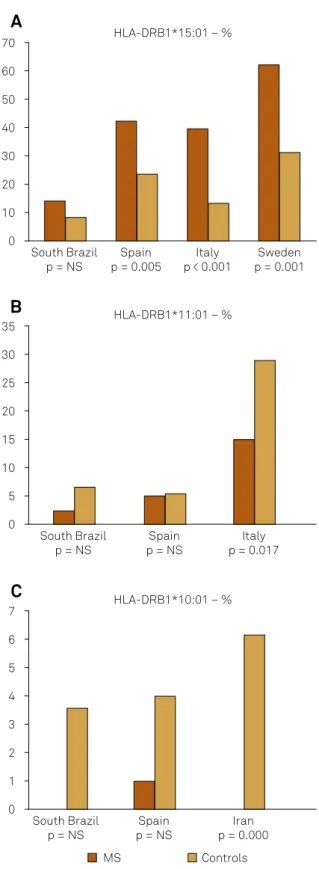
Although DQB1*06:02 was the most frequent allele, we failed to ind an association between this allele and MS, as reported in
Spain (Basque Country)7, Ireland8
, Italy (Sardinia)22, Iran23, China (Hong Kong)24, Colombia25 and Afro-Brazilian (Rio de Janeiro)10. he only DQB1 allele which remained with statistical signii
-cance after Bonferroni correction was the *02:03. his associa
-tion was not previously reported.
he allele DQB1*03:01 was associated with MS in Spain7 but have a reduced susceptibility in Iran23. However, previous studies showed that the risk of MS increases by 50% in the presence of HLA-DPB1*03:0126 (Figure 2).
In the analysis of HLA-DPB1, we did not ind the *03:01 allele associated with MS, as reported in Italy (Sardinia)6 and several European countries26. Although this association was only found in the absence of DQB1*06:02 allele in Australia27. he DPB1*05:01 allele showed no association with MS in our series, in contrast with the indings for other series from South China28 (Figure 3).
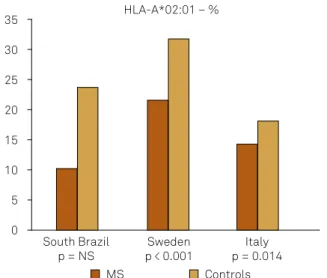
In our series, before Bonferroni correction, there was a positive association between MS and HLA-A*03:01 (increased susceptibility) and a negative association for HLA-A*02:01 (increased in controls, protective ef
-fect). The reduced susceptibility to MS (protective effect) of HLA-A*02:01, *68:01, *02:05 and *06:06 alleles have been reported26. It has been shown that if HLA-A*03:01 allele is associated with HLA-B*07:02 allele, the risk of MS increas
-es, but if it is associated with HLA-A*02:01 allele, the risk is reduced5 (Figure 4).
HLA-B*35:01, *44:02, and *14:06 alleles were correlated with disease susceptibility in our series, but after Bonferroni correction no allele had signiicance. It is reported that the HLA-B*44 allele when present reduce susceptibility to MS, slowing disease progression and preserving brain volume in North American patients 15,29. However, in our series, it was more frequent in MS cases, than the previous reports, which have more cases in the control groups (Figure 5).
HLA-C *07:27 allele was found only in the MS group, suggesting an association with susceptibility to the disease. In addition, our results failed to reveal an association be
-tween HLA-C*05, which was shown to have a protective ef
-fect in some MS population29. However, it is diicult to make any correlation of the HLA-C because most of the previous studies are in low resolution.
Our HLA results probably could be explained by two main hypothesis: irst, the diferent distribution of the ethnic background into Brazil; and second, the diferent resolutions techniques used in the previous studies.
Regarding the ethnic Brazilian background, the difer
-ences found comparing with Europeans could be due to the variation in the Brazilian population because of the many immigrants with diferent ethnic backgrounds who arrived in Brazil and gradually mixed with the local inhabitants over the last 500 years30.
Brazil was colonized mainly by the Portuguese, who mixed with native Brazilian Indians in the irst centuries fol
-lowing colonization. Later, African slaves were introduced to
Figure 1. (A) Frequency of HLA-DRB1*15:01 alleles in South Brazil,
Spain7, Italy6 and Sweden5; (B) Frequency of HLA DRB1*11:01
alleles in South Brazil, Spain7 and Italy16; (C) Frequency of
HLA-DRB1*10:01 alleles in South Brazil, Spain7 and Iran23.
South Brazil p = NS
Spain p = 0.005
Italy p < 0.001
Sweden p = 0.001 70
60
40 30
10 0 20 50
HLA-DRB1*15:01 – %
South Brazil p = NS
Spain p = NS
Italy p = 0.017 35
30
20 15
5 0 10 25
HLA-DRB1*11:01 – %
South Brazil p = NS
Spain p = NS
Iran p = 0.000 7
6
4 3
1 0 2 5
HLA-DRB1*10:01 – %
MS Controls
A
B
the country, mainly to the Southeast and Northeast to work on sugarcane plantations. In the mid 19th century European immigrants began to arrive in Brazil. However, they did not settle evenly throughout the country and tended to concen
-trate in certain areas according to their ethnic descent30. he Southeast, for example, had large numbers of Portuguese and Spanish people from Galicia, as well as Arabs, Jews and
Figure 3. Frequency of HLA-DPB1*03:01 allele in South Brazil,
Sardinia (Italy)6 and China28.
South Brazil p = NS
Sardinia p < 0.001
China p = NS 35
30
20 15
5 0 10 25
HLA-DPB1*03:01 – %
MS Controls
Figure 4. Frequency of HLA-A*02:01 allele in South Brazil,
Sweden5 and Italy16.
South Brazil p = NS
Sweden p < 0.001
Italy p = 0.014 35
30
20 15
5 0 10 25
HLA-A*02:01 – %
MS Controls
Figure 5. Frequency of HLA-B*44:02 allele in South Brazil and
United States17.
South Brazil p = NS
USA p < 0.001 14
12
8 6
2 0 4 10
HLA-B*44:02 – %
MS Controls
16
Figure 2. (A) Frequency of HLA-DQB1*03:01 allele in South
Brazil, Spain7 and Iran23; (B) Frequency of HLA-DQB1*06:02
allele in South Brazil, Rio de Janeiro (Afro-Brazilian)10, Spain7,
Ireland8 and Iran23; (C) Frequency of HLA-DQB1*02:03 allele in
South Brazil and Rio de Janeiro (Afro-Brazilian)19.
South Brazil p = NS
Spain p = 0.022
Iran p = 0.026 35
30
20 15
5 0 10 25
HLA-DQB1*03:01 – %
South Brazil p = NS
Spain p = 0.002
Ireland p = 0.01 60
50
30 20
0 10 40
HLA-DQB1*06:02 – %
South Brazil p = 0.002
Rio de Janeiro p = NS (low resolution) 60
40 30
10 0 20 50
HLA-DQB1*02:03 – %
MS Controls
Rio de Janeiro p = 0.024
Iran p = 0.041
A
B
Japanese in smaller numbers. he Italians settled in the Southeast and South and constituted one of the largest immigrant popula
-tion in Brazil, while the Germans, Polish and Ukrainians settled mainly in the South30.
Genetic studies have shown that the white Brazilian pop
-ulation has genes of Europeans, African and indigenous ori
-gin. he distribution of these European genes is higher in the South (where our study was done), there is a greater propor
-tion of white individuals and a smaller propor-tion of black individuals in this area31.
Regarding the diferent resolutions techniques used in the previous studies, the admixture of the population of sev
-eral ethnic origins increased the number of diferent alleles which are easier to analyses with techniques of high resolu
-tion. At present time, if the typing the HLA was performed only with high resolutions techniques, the number of alleles in each class increased too much (http://hla.alleles.org/al
-leles/class1.html; http://hla.alleles.org/alleles/class2.html). herefore, if the Bonferroni correction was applied in this sit
-uation ( for the total number of alleles), most of the studies lost their statistical signiicance.
In some of the previous HLA studies performed in Brazil, the analysis grouped together techniques of low and high reso
-lution, which rise diiculties to compare with our results that were performed only with high resolution techniques10,19,20.
We believe that the mainly factor to our diferent results was the diferent ethnic backgrounds into Brazil which can
really results in many possible genetic combinations in the Brazilian population. Furthermore, beside the type of HLA and ethnic diversity, probably climate with less sunlight, dif
-ferent environmental conditions and dietary habits could play a role in the triggering and incidence of MS in southern Brazil diferent from other countries8,32,33,34,35.
In conclusion, our data have diferent frequency of HLA alleles in Southern Brazilian population than the previous published with the Southeast Brazil region and Europeans. We also specu
-late that further studies of HLA regarding the MS susceptibility in the European Countries in the next century may ind diferent re
-sults from today when using high resolution techniques and large control groups. We do not know the efect of the dilution of the original HLAs alleles due to the massive immigration which is oc
-curring in the present days, similar that occurred with the original Brazilians inhabitants over the last 500 years.
Acknowledgements
We would like to thanks Dr. Noemi Farah Ferreira, col
-leagues and technicians at the Immunogenetics Laboratory, Hospital de Clínicas, Federal University of Paraná, Curitiba, Brazil. he authors would also like to thank Dr. Monica F. Parolin and Dr. Flávia Folador for patient referral.
References
1. Murphy K, Travers P, Walport M. Janeways’s immunobiology. 7th ed. New York: Garland Science; 2008. p. 196-212.
2. Ramagopalan SV, Ebers GC. Multiple sclerosis: major
histocompatibility complexity and antigen presentation. Genome Med. 2009;1(11):105. doi:10.1186/gm105
3. Barcellos LF, Sawcer S, Ramsay PP, Baranzini SE, Thomson G, Briggs F et al. Heterogeneity at the HLA-DRB1 locus and risk for multiple sclerosis. Hum Mol Genet. 2006;15(18):2813-24. doi:10.1093/hmg/ddl223
4. Lincoln MR, Ramagopalan SV, Chao MJ, Herrera BM, Deluca GC, Orton SM et al. Epistasis among HLA-DRB1, HLA-DQA1, and HLA-DQB1 loci determines multiple sclerosis susceptibility. Proc Natl Acad Sci USA. 2009;106(18):7542-7. doi:10.1073/pnas.0812664106
5. Sawcer S, Hellenthal G, Pirinen M, Spencer CC, Patsopoulos NA, Moutsianas L et al. Genetic risk and a primary role for cell-mediated immune mechanism in multiple sclerosis. Nature. 2011;476(7359):214-9. doi:10.1038/nature10251
6. Marrosu MG, Murru R, Murru MR, Costa G, Zavattari P, Whalen M et al. Dissection of the HLA association with multiple sclerosis in the founder isolated population of Sardinia. Hum Mol Genet. 2001;10(25):2907-26. doi:10.1093/hmg/10.25.2907
7. Fernández O, R-Antigüedad A, Pinto-Medel MJ, Mendibe MM, Acosta N, Oliver B et al. HLA class II alleles in patients with multiple sclerosis in the Biscay province (Basque Country, Spain). J Neurol. 2009;256(12):1977-88. doi:10.1007/s00415-009-5223-2
8. McGuigan C, McCarthy A, Quigley C, Bannan L, Hawkins SA, Hutchinson M. Latitudinal variation in the prevalence of multiple sclerosis in Ireland, an effect of genetic diversity. J Neurol Neurosurg Psychiatry. 2004;75(4):572-6. doi:10.1136/jnnp.2003.012666
9. Aláez C, Corona T, Ruano L, Flores H, Loyola M, Gorodezky C. Mediterranean and Amerindian MHC class II alleles are associated with multiple sclerosis in Mexicans. Acta Neurol Scand. 2005;112(5):317-22. doi:10.1111/j.1600-0404.2005.00493.x
10. Caballero A, Alvés-León S, Papais-Alvarenga R, Fernández O, Navarro G, Alonso A. DQB1*0602 confers genetic susceptibility to multiple sclerosis in Afro-Brazilians. Tissue Antigens. 1999;54(5):524-6. doi:10.1034/j.1399-0039.1999.540511.x
11. Link J, Kockum I, Lorentzen AR, Lie BA, Celius EG, Westerlind H et al. Importance of human leukocyte antigen (HLA) class I and II alleles on the risk of multiple sclerosis. PLoS One. 2012;7(5):e36779. doi:10.1371/journal.pone.0036779
12. Bergamaschi L, Ban M, Barizzone N, Leone M, Ferrante D, Fasano ME et al. Association of HLA class I markers with multiple sclerosis in the Italian and UK population: evidence of two independent protective effects. J Med Genet. 2011;48(7):485-92. doi:10.1136/jmg.2010.080721
13. Yeo TW, De Jager PL, Gregory SG, Barcellos LF, Walton A, Goris A et al. A second major histocompatibility complex susceptibility locus for multiple sclerosis. Ann Neurol. 2007;61(3):228-36. doi:10.1002/ana.21063
14. Lublin FD, Reingold SC, Cohen JA, Cutter GR, Sørensen PS, Thompson AJ et al. Deining the clinical course of multiple sclerosis: the 2013 revisions. Neurology. 2014;83(3):278-86. doi:10.1212/WNL.0000000000000560
16. Ballerini C, Guerini FR, Rombolà G, Rosati E, Massacesi L, Ferrante P et al. HLA-multiple sclerosis association in continental Italy and correlation with disease prevalence in Europe. J Neuroimmunol. 2004;150(1-2):178-85. doi:10.1016/j.jneuroim.2004.01.015
17. Mack SJ, Tu B, Lazaro A, Yang R, Lancaster AK, Cao K et al. HLA-A; -B, -C, -DRB1 allele and haplotype frequencies distinguish Eastern European Americans from the general European American population. Tissue Antigens. 2009;73(1):17-32. doi:10.1111/j.1399-0039.2008.01151.x
18. Probst CM, Bompeixe EP, Pereira NF, Dalalio MM, Visentainer JE, Tsuneto LT et al. HLA polymorphism and evaluation of European, African, and Amerindian contribution to the white and mulatto population from Paraná, Brazil. Hum Biol. 2000;72(4):597-617. doi:
19. Alves-Leon SV, Papais-Alvarenga R, Magalhães M, Alvarenga M, Thuler LCS, Fernandez y Fernandez O. Ethnicity-dependent association of HLA DRB1-DQA1-DQB1 alleles in Brazilian multiple sclerosis patients. Acta Neurol Scand. 2007;115(5):306-11. doi:10.1111/j.1600-0404.2006.00750.x
20. Brum DG, Barreira AA, Louzada-Junior P, Mendes-Junior CT, Donadi EA. Association of the HLA-DRB1*15 allele group and the DRB1*1501 and DRB1*1503 alleles with multiple sclerosis in White and Mulatto samples from Brazil. J Neuroimmunol. 2007;189(1-2):118-24. doi:10.1016/j.jneuroim.2007.06.009
21. Paradela ER, Alves-Leon SV, Figueiredo AL, Pereira VC, Malfetano F, Mansur LF et al. The CIITA genetic polymorphism rs4774*C in combination with the HLA-DRB1*15:01 allele as a putative susceptibility factor to multiple sclerosis in Brazilian females. Arq Neuropsiquiatr. 2015;73(4):283-8. doi:10.1590/0004-282X20150012
22. Cocco E, Murru R, Costa G, Kumar A, Pieroni E, Melis C et al. Interaction between HLA-DRB1-DQB1 haplotypes in Sardinian multiple sclerosis population. PLoS One. 2013;8(4):e59790. doi:10.1371/journal.pone.0059790
23. Kollaee A, Ghaffarpor M, Ghlichnia HA, Ghaffari SH, Zamani M. The inluence of the HLA-DRB1 and HLA-DQB1 allele heterogeneity on disease risk and severity in Iranian patients with multiple sclerosis. Int J Immunogenet. 2012;39(5):414-22. doi:10.1111/j.1744-313X.2012.01104.x
24. Serjeantson SW, Gao X, Hawkins BR, Higgins DA, Yu YL.
Novel HLA-DR2-related haplotypes in Hong Kong Chinese implicate the DQB1*0602 allele in susceptibility to multiple sclerosis. Eur J Immunogenet. 1992;19(1-2):11-9. doi:10.1111/j.1744-313X.1992.tb00043.x
25. Rojas OL, Rojas-Villarraga A, Cruz-Tapias P, Sánchez JL,
Suárez-Escudero JC, Patarroyo MA et al. HLA class II polymorphism in Latin American patients with multiple sclerosis. Autoimmun Rev. 2010;9(6):407-13. doi:10.1016/j.autrev.2009.11.001
26. Patsopoulos NA, Barcellos LF, Hintzen RQ, Schaefer C, van Duijn CM, Noble JA et al. Fine-mapping the genetic association of the major histocompatibility complex in multiple sclerosis: HLA and non-HLA effects. PLoS Genetics. 2013;9(11):e1003926. doi:10.1371/journal.pgen.1003926
27. Dekker JW, Easteal S, Jakobsen IB, Gao X, Stewart GJ, Buhler MM et al. HLA-DPB1 alleles correlate with risk for multiple sclerosis in Caucasoid and Cantonese patients lacking the high-risk DQB1*0602 allele. Tissue Antigens. 1993;41(1):31-6. doi:10.1111/j.1399-0039.1993.tb01974.x
28. Wu XM, Wang C, Zhang KN, Lin AY, Kira J, Hu GZ et al. Association of susceptibility to multiple sclerosis in Southern Han Chinese with HLA-DRB1, -DPB1 alleles and DRB1-DPB1 haplotypes: distinct from other populations. Mult Scler. 2009;15(12):1422-30. doi:10.1177/1352458509345905
29. Healy BC, Liguori M, Tran D, Chitnis T, Glanz B, Wolish C et al. HLA B*44: protective effects in MS susceptibility and MRI outcome measures. Neurology. 2010;75(7):634-40. doi:10.1212/WNL.0b013e3181ed9c9c
30. Instituto Brasileiro de Geograia e Estatística – IBGE. Brasil: 500 anos de povoamento. Rio de Janeiro: Centro de Documentação e Disseminação de Informações; 2007.
31. Pena SD, Di Pietro G, Fuchshuber-Moraes M, Genro JP, Hutz MH, Kehdy FS et al. The genomic ancestry of individuals from different geographical regions of Brazil is more uniform than expected. PLoS One. 2011;6(2):e17063. doi:10.1371/journal.pone.0017063
32. Berg-Hansen P, Moen SM, Sandvik L, Harbo HF, Bakken IJ, Stoltenberg C et al. Prevalence of multiple sclerosis among immigrants in Norway. Mult Scler. 2015;21(6):695-702. doi:10.1177/1352458514554055
33. Bhargava P, Mowry EM. Gut microbiome and multiple sclerosis. Curr Neurol Neurosci Rep. 2014;14(10):492. doi:10.1007/s11910-014-0492-2
34. O’Gorman C, Lucas R, Taylor B. Environmental risk factors for multiple sclerosis: a review with a focus on molecular mechanisms. Int J Mol Sci. 2012;13(9):11718-52. doi:10.3390/ijms130911718