Finnish Population
Annika Wennerstro¨m1*, Efthymia Vlachopoulou1, L. Elisa Lahtela1, Riitta Paakkanen1, Katja T. Eronen1, Mikko Seppa¨nen2, Marja-Liisa Lokki1
1Transplantation Laboratory, Haartman Institute, Helsinki, Finland,2Division of Infectious Diseases, Department of Medicine, Helsinki University Central Hospital, Helsinki, Finland
Abstract
The Major Histocompatibility Complex (MHC, 6p21) codes for traditional HLA and other host response related genes. The polymorphicHLA-DRB1gene in MHC Class II has been associated with several complex diseases. In this study we focus on MHC haplotype structures in the Finnish population. We explore the variability of extendedHLA-DRB1haplotypes in relation to the other traditional HLA genes and a selected group of MHC class III genes. A total of 150 healthy Finnish individuals were included in the study. Subjects were genotyped for HLA alleles (HLA-A, -B, -DRB1, -DQB1, and -DPB1). The polymorphism ofTNF, LTA, C4, BTNL2andHLA-DRAgenes was studied with 74 SNPs (single nucleotide polymorphism). The C4AandC4Bgene copy numbers and a 2-bp silencing insertion at exon 29 inC4Agene were analysed with quantitative genomic realtime-PCR. The allele frequencies for each locus were calculated and haplotypes were constructed using both the traditional HLA alleles and SNP blocks. The most frequent FinnishA,B,DR-haplotype, uncommon in elsewhere in Europe, wasA*03,B*35,DRB1*01:01. The second most common haplotype was a common European ancestral haplotype AH 8.1 (A*01,B*08,DRB1*03:01). Extended haplotypes containingHLA-B,TNFblock,C4andHLA-DPB1strongly increased the number ofHLA-DRB1haplotypes showing variability in the extendedHLA-DRB1haplotype structures. On the contrary, BTNL2block andHLA-DQB1were more conserved showing linkage with theHLA-DRB1alleles. We show that the use of HLA-DRB1haplotypes rather than singleHLA-DRB1alleles is advantageous when studying the polymorphisms and LD patters of the MHC region. For disease association studies theHLA-DRB1haplotypes with various MHC markers allows us to cluster haplotypes with functionally important gene variants such as C4 deficiency and cytokines TNF and LTA, and provides hypotheses for further assessment. Our study corroborates the importance of studying population-specific MHC haplotypes.
Citation:Wennerstro¨m A, Vlachopoulou E, Lahtela LE, Paakkanen R, Eronen KT, et al. (2013) Diversity of ExtendedHLA-DRB1Haplotypes in the Finnish Population. PLoS ONE 8(11): e79690. doi:10.1371/journal.pone.0079690
Editor:Gualtiero I. Colombo, Centro Cardiologico Monzino IRCCS, Italy
ReceivedJune 21, 2013;AcceptedSeptember 23, 2013;PublishedNovember 21, 2013
Copyright:ß2013 Wennerstro¨m et al. This is an open-access article distributed under the terms of the Creative Commons Attribution License, which permits unrestricted use, distribution, and reproduction in any medium, provided the original author and source are credited.
Funding:This study was supported by Nummela Foundation for Medical Research, Hengityssairauksien tutkimussa¨a¨tio¨ (HES), the Helsinki Biomedical Graduate School and the League of European Research Universities (LERU), and the European Science Foundation (ESF COST Action BM0803 ‘‘HLA-NET’’). The funders had no role in study design, data collection and analysis, decision to publish, or preparation of the manuscript.
Competing Interests:The authors have declared that no competing interests exist. * E-mail: [email protected]
Introduction
The Major Histocompatibility Complex located on chromo-some 6p21 has a complex allelic structure with extended linkage disequilibrium (LD) and polymorphism. The traditional human leukocyte antigen (HLA) genes encode the cell-surface antigen-presenting proteins, the HLA molecules, and fall into two major MHC classes; Class I (HLA-A, -C, and -B) and Class II ( HLA-DRB1, -DQB1, and –DPB1). Many non-HLA genes related to immune responses e.g.tumor necrosis factor(TNF),lymphotoxin-alpha (LTA),complement C4genes (C4AandC4B) andbutyrophilin-like protein 2(BTNL2), are located in the MHC class III region that resides between the MHC Class I and II regions [1–3]. The location of recombination hotspots and the length of LD blocks (genomic fragments inherited together) are population specific [1,4,5]. Interestingly, it has been shown that the Finnish population has distinctive population substructure compared with other Europe-ans [6–8].
The HLA genes play a critical role in hematopoietic stem cell transplantation, and HLA mismatching has been associated with graft failure and graft-versus-host disease [9,10]. In addition to the
HLA-A Allele Phenotype HLA-DRB1 Allele Phenotype HLA-DQB1 Allele Phenotype HLA-DPB1 Allele Phenotype
Allele n f n f Allele n f n f Allele n f n f Allele n f n f
*02 126 0.420 101 0.673 *15:01 44 0.147 42 0.280 *06:02 44 0.147 42 0.280 *04:01 103 0.343 84 0.553
*03 71 0.237 61 0.407 *01:01 44 0.147 38 0.253 *05:01 48 0.160 40 0.267 *04:02 61 0.203 55 0.367
*01 23 0.077 23 0.153 *08:01 37 0.123 33 0.220 *02# 41 0.137 39 0.260 *02:01 48 0.160 43 0.287
*24 20 0.067 20 0.133 *03:01 29 0.097 28 0.187 *03:01 45 0.150 39 0.260 *03:01 43 0.143 39 0.260
*68 14 0.047 14 0.093 *13:01 27 0.090 26 0.173 *04# 38 0.127 34 0.227 *01:01 17 0.057 17 0.113
*11 12 0.040 12 0.080 *04:01 21 0.070 21 0.140 *03:02 27 0.090 27 0.180 *05:01 10 0.033 10 0.067
*32 10 0.033 10 0.067 *07:01 16 0.053 15 0.100 *06:03 27 0.090 26 0.173 *19:01 3 0.010 3 0.020
*31 7 0.023 7 0.047 *13:02 13 0.043 12 0.080 *03:03 13 0.043 12 0.080 *13:01 2 0.007 2 0.013
*29 5 0.017 5 0.033 *11:01 12 0.040 11 0.073 *06:04 13 0.043 12 0.080 *14:01 2 0.007 2 0.013
*26 4 0.013 4 0.027 *12:01 11 0.037 11 0.073 *05:02 2 0.007 2 0.013 *17:01 2 0.007 2 0.013
*30 3 0.010 3 0.020 *09:01 10 0.033 9 0.060 *05:03 2 0.007 2 0.013 *20:01 2 0.007 2 0.013
*66 2 0.007 2 0.013 *04:04 6 0.020 6 0.040 11 alleles *06:01 1 0.003 1 0.007
*23 1 0.003 1 0.007 *04:08 6 0.020 6 0.040 *104:01 1 0.003 1 0.007
*25 1 0.003 1 0.007 *04:03 4 0.013 4 0.027 *15:01 1 0.003 1 0.007
*33 1 0.003 1 0.007 *14:01:01G 3 0.010 3 0.020 *16:01 1 0.003 1 0.007
15 alleles *04:02 2 0.007 2 0.013 *24:01 1 0.003 1 0.007
*08:03 2 0.007 2 0.013 *81:01 1 0.003 1 0.007
HLA-B Allele Phenotype *10:01 2 0.007 2 0.013 *85:01 1 0.003 1 0.007
Allele n f n f *11:04 2 0.007 2 0.013 18 alleles
*15 43 0.143 41 0.273 *14:02 2 0.007 2 0.013
*07 40 0.133 40 0.267 *16:01 2 0.007 2 0.013
*35 38 0.127 35 0.233 *01:03 1 0.003 1 0.007
*08 30 0.100 29 0.193 *04:07 1 0.003 1 0.007
*27 27 0.090 26 0.173 *08:02 1 0.003 1 0.007
*44 26 0.087 26 0.173 *08:04 1 0.003 1 0.007
*40 26 0.087 24 0.160 *11:03 1 0.003 1 0.007
*51 21 0.070 20 0.133 26 alleles
*39 11 0.037 11 0.073
*13 7 0.023 7 0.047
*56 6 0.020 6 0.040
*18 5 0.017 5 0.033
*47 4 0.013 4 0.027
*57 4 0.013 4 0.027
*41 3 0.010 3 0.020
Diversity
of
Extended
HLA-DRB1
Haplotypes
ONE
|
www.ploson
e.org
2
November
2013
|
Volume
8
|
Issue
11
|
At present, for transplantation and many diagnostics proposes, traditional HLA typing still remains as the most used method [14]. De Bakker [22] presented a tag-SNP based HLA-typing method as an alternative solution for traditional HLA typing. It has promoted the screening of certain disease related HLA markers [21,23]. However, not only HLA allele and haplotype frequencies [8,24] but also the SNP content of haplotypes differ in ethnically diverse populations complicating the imputation process. It is clear that more information on the precise content of HLA haplotypes is needed for transplantation, disease association, anthropological, and epidemiological studies [8,25].
In this study we focused on studying HLA-DRB1 haplotype structures in a Finnish population. The allelic diversities of other traditional HLA-genes and selected group of MHC class III genes were included and extended haplotypes inferred. We aimed to interpret the haplotype diversities in relation toHLA-DRB1locus because of its higher amount of polymorphism when compared to the other MHC Class II genes (IMGT database, [26]) and its well-known associations with several complex diseases. The selected MHC genesTNF, LTA, C4, BTNL2,andHLA-DRAall have been associated with several autoimmune or infectious diseases, as well. We hypothesized that the use of longer MHC blocks, rather than single alleles, could be advantageous when studying the polymor-phisms in the MHC region.
Materials and Methods Study Population
The study consists of one hundred and fifty (150) healthy Finnish individuals who were randomly selected. Description of the sample set and the DNA extraction has previously been published by Seppa¨nen et al. [17]. Briefly, samples from 49 males and 101 females with mean age of 33.7 years (range 18–60), were used. The local ethical committee (The Ethics Committee: Department of Medicine, Hospital District of Helsinki and Uusimaa) approved the study protocol (Dnro 6/E5/ 2001,25.1.2001). All the contributors provided the written informed consent.
Genotyping of HLA Genes
The HLA genotyping and/or analysis was carried out in an EFI (European Federation for Immunogenetics) accredited HLA Laboratory. The genotyping ofHLA-A, -Band–DPB1genes were performed using sequence specific primers (SSP: Olerup SSP AB, Stockholm, Sweden). TheHLA-DRB1alleles were detected using sequence based typing (SBT; InvitrogenTM, Life Technologies, Carlsbad, CA, USA). HLA-DQB1 alleles were detected with a panel of lanthanide-labeled oligonucleotide probes [27]. The reactions were performed according to manufacturers’ instructions giving at least four-digit resolution (for example, HLA-DRB1*01:01) for HLA-DRB1 and –DPB1, and at least two-digit resolution (for example,HLA-A*02) forHLA-A, -Band-DQB1. For resolving ambiguities, high resolution SSPs or SBT HARPs (heterozygous ambiguity resolving primers) were used. The HLA alleles were assessed using HLA nomenclature release 3.5.0 (IMGT/HLA database) and carefully interpreted by two persons.
SNP Selection and Genotyping
We aimed to genotyped LTA, TNF, BTNL2 and HLA-DRA genes with SNPs. All the selected genes were covered entirely including 59and 39- flanking regions. SNPs were chosen from the HapMap database [28] and/or from the public dbSNP database (http://www.ncbi.nlm.nih.gov/projects/SNP). Information about the validation status, tagging quality, minor allele frequency
(.0.01) and gene structure were used for selecting the SNPs. Altogether seventy-four SNPs were chosen from the two gene regions, TNF,LTA, (here referred as TNF block) and
BTNL2,HLA-DRA(here referred asBTNL2block).
SNP genotyping was performed using the Sequenom MassAr-ray iPLEX system (Sequenom, San Diego, CA, USA). In the iPLEX assay, the SNP alleles are separated based on the differences of the single base extension (SBE) products. Manufac-ture’s instructions were used to design the assays (AssayDesign software) and to perform the multiplex PCR and the iPLEX reaction using 9–10 ng of DNA as a template.
The complementC4AandC4Bgene copy numbers and a 2-bp silencing insertion at exon 29 (CT) inC4Agene were analysed by quantitative genomic realtime-PCR Rotor-Gene 6000 (Corbett Research, Sydney, Australia) according to Paakkanen et al. [29]. The C4 allotypes were determined by immunofixation [17]. One subject was excluded from the analysis.
Statistical Analysis
Allele, phenotype and haplotype frequencies were calculated by direct counting. To detect significant departure from Hardy-Weinberg equilibrium (p,0.001), Haploview (SNPs) [30] or ARLEQUIN 3.11 (HLA genes) [31], were used.
SNP haplotypes were constructed using Haploview [30]. Multi-locus haplotype frequencies and recombination rates were estimated from allele data using the Bayesian method with PHASE v. 2.1.1 [32]. The haplotypes were constructed using all the selected markers simultaneously. Taken into account the small sample size and to exclude unreliable haplotypes, only haplotypes greater than 1% (observed more than 3 times) were used in the analysis [24,33–35].
The LD measures (D9and r2) were determined using either the Haploview software (biallelic markers) [30] or the ARLEQUIN
3.11 software (multiallelic markers) [31]. At this step, only one SNP from a LD block was chosen for further analysis. It has been shown that for multiallelic loci, D9 estimates the strength of LD (.0.80 strong LD,20.5 moderate LD,20 weak LD) better than r2[36]. The R-package ‘ape’ was used to perform a Neighbor-joining algorithm according to the method of Saitou and Nei [37]. The HapMap data was used for illustrating the recombination hotspots in the MHC region [28]. The proxy SNPs (r2.0.9) for genotyped SNPs were detected using software SNAP [38].
Results
Genotyping of HLA-alleles
The HLA alleles and their frequencies are given in parallel with the phenotype frequency in Table 1. HLA allele distributions followed the Hardy–Weinberg equation. A total of 91 HLA alleles (15, 21, 26, 11 and 18 alleles inHLA-A, -B, -DRB1, -DQB1and -DPB1, respectively) were noted. In the Finnish population, two HLA-Aalleles accounted for.66% and fiveHLA-DPB1alleles for
.91% of the variation at the loci. Allele frequencies of other HLA loci were more equally distributed. These observations are consistent with the previous Finnish studies [39,40].
HLA Haplotypes
Three-locus haplotypes betweenHLA-DRB1and MHC Class I (HLA-Aand –B; Table 2) and MHC Class II (HLA-DQB1 and -DPB1; Table 3) were constructed. Haplotypes having frequencies higher than 1.0% are presented in Table 2 and 3 and compared with different populations that had reported theA,B,DRB1and
DQB1,-DPB1,DRB1 haplotypes in The Allele Frequency Net
Database [41–46]. The three most common A,B,DRB1
haplotypes in the Finnish population were A*03,B*35,DRB1*01:01 (7.1%), A*01,B*08,DRB1*03:01
Table 2.The FinnishA,B,DRB1haplotype frequencies (.1%) and comparison with other populations [41–46].
Haplotype A,B,DRB1 Finland (n = 150) Sami (n = 130) [44] Russia (n = 207) [46]
Ireland (n = 1000) [41–43]
HLA-A HLA-B HLA-DRB1 f f f f
*01 *08 *03:01 0.040 0.039 0.050 0.09
*02 *07 *15:01 0.035 0.038 – 0.03
*02 *27 *08:01 0.027 0.014 – –
*02 *15 *13:01 0.023 0.031 0.012 –
*02 *15 *04:01 0.019 0.023 – –
*02 *15 *08:01 0.019 – – –
*02 *13 *07:01 0.016 – 0.021 –
*02 *15 *15:01 0.013 – – –
*02 *44 *04:01 0.012 – 0.019 0.04
*02 *40 *13:02 0.011 – – –
*03 *35 *01:01 0.071 0.031 0.033 –
*03 *08 *03:01 0.021 – – –
*03 *15 *08:01 0.017 0.015 – –
*03 *07 *01:01 0.014 – 0.019 –
*03 *07 *13:01 0.012 – – –
*03 *07 *15:01 0.011 0.042 0.047 0.05
*11 *07 *15:01 0.015 – – –
f = frequency.
(4.0%) and A*02,B*07,DRB1*15:01 (3.5%). The second most
common HLA-DRB1*01:01haplotype had HLA-B*07 instead of HLA-B*35. The two-locus haplotypes (DRB1,DPB1,
DQB1,DPB1 and B,DRB1) are presented in Table S1.The
linkage between HLA-DRB1 and HLA-DQB1 was stronger than betweenHLA-DRB1andHLA-DPB1(Table S2).
SNP Analysis
Altogether 74 SNPs were successfully genotyped. The average success rate was 99% and no discrepancies were observed. Fourteen SNPs were excluded due to minor allele frequency (,0.01) or HWE (,0.001) and five SNPs were excluded as they were in total LD (r2= 1) with another SNP. There can be found several proxy SNPs (SNPs in strong LD) for our SNPs (examples shown in Table S3) [38]. Many of the proxy SNPs have been previously associated with diseases (http://www.snp-nexus.org/).
A summary of the accepted SNPs (n = 55) is given in Table S4. The allele frequencies of our genotyped SNPs did not differ significantly from the HapMap (CEU population, European decent) [28], except the twelve SNPs in BTNL2 or HLA-DRA genes (Table S4). The LD structure of the SNPs (TNForBTNL2 block) is presented in the Figure S1. As expected, due to the SNP selection criteria the pairwise LD between SNPs was always r2,1.
Previously using HapMap data [28], high recombination rates have been observed betweenHLA-Aand –Bloci, upstream and downstream of TNF, in the BTNL2 region and between HLA-DQB1and –DPB1loci (Figure 1A). Here, the recombination rate estimation was performed using the HLA alleles (HLAA, B, -DRB1, -DQB1, -DPB1), C4 gene copy numbers and SNPs (n = 55). Thirty-one SNPs were common in both HapMap and in our study. The location of the highest recombination rate in the Finnish sample was observed in the BTNL2 promoter region corresponding to HapMap data (Figures 1 B and C).
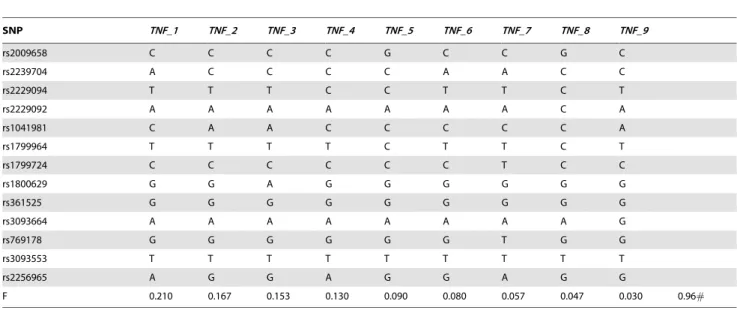
Haplotypes ofTNF, BTNL2andC4
SNP haplotypes were constructed. The rare haplotypes (observed less than 3 times i.e. frequency ,1%) were excluded at this point. Nine 13-SNP haplotypes ofTNFblock (Table 4) and twelve 42-SNP haplotype ofBTNL2block (Table 6) were observed with frequencies ranging from 3% to 21% and 1.3% to 15%, respectively. In both regions, there seemed to be four to five common haplotypes of almost equal frequency in addition to the less common haplotypes.C4AandC4Bgene copy numbers were constructed into haplotypes and the results are shown in Table 8. As opposed to TNF and BTNL2 haplotypes, there was one haplotype, which covered more than half of the observed Table 3.The FinnishDRB1,DQB1,DPB1haplotype frequencies (.1%) and comparison with other populations [41–46].
Haplotype DRB1,DQB1,DPB1 Finland (n = 150) Ireland (n = 250) [41–43] Greece (n = 246) [45]
HLA-DRB1 HLA-DQB1 HLA-DPB1 f f f
*01:01 *05:01 *04:02 0.059 0.024 –
*01:01 *05:01 *04:01 0.043 0.028 0.035
*01:01 *05:01 *02:01 0.040 0.011 –
*03:01 *02 *01:01 0.049 0.021 0.014
*03:01 *02 *04:01 0.020 0.098 0.015
*04:01 *03:02 *04:01 0.026 0.013 –
*04:01 *03:02 *04:02 0.016 – –
*04:04 *03:02 *02:01 0.013 – –
*04:08 *03:01 *02:01 0.016 – –
*07:01 *02 *04:01 0.023 0.017 0.014
*08:01 *04 *03:01 0.071 – –
*08:01 *04 *04:01 0.033 – –
*08:01 *04 *04:02 0.014 – –
*09:01 *03:03 *04:02 0.022 – –
*11:01 *03:01 *04:02 0.013 – –
*11:01 *03:01 *04:01 0.012 – 0.036
*11:01 *03:01 *02:01 0.012 – 0.023
*12:01 *03:01 *04:01 0.025 – –
*13:01 *06:03 *04:01 0.027 0.014 0.016
*13:01 *06:03 *02:01 0.023 – 0.023
*13:01 *06:03 *05:01 0.012 – –
*13:02 *06:04 *03:01 0.030 – –
*13:02 *06:04 *04:02 0.013 – –
*15:01 *06:02 *04:01 0.090 0.149 0.015
*15:01 *06:02 *04:02 0.020 – –
*15:01 *06:02 *05:01 0.014 – –
f = frequency.
haplotypes (C4_1 haplotype, 59%). The frequency of the next common haplotype was less than 20%, showing a sharp decrease. The significant pair-wise LD [(D9.0.80, r2.0.35, P value (P)
,0.05)] between HLA-DRB1 alleles and other markers is presented in Table 10. The HLA-DRB1 allele distribution (%) presented in Table S2 shows howHLA-DRB1alleles are clustered with MHC class I, II and III alleles and MHC blocks.
The linkage between HLA-DRB1 and TNF block (Table 5) indicates that a given HLA-DRB1 allele was combined with different TNF blocks. Two cases, HLA-DRB1*03:01and TNF_3 andHLA-DRB1*13:02andTNF_9showed strong LD (D9= 0.80; D9= 0.88, respectively, Table 10).
Contrary to TNFblock, the linkage between HLA-DRB1 and BTNL2 block (Table 7) showed that mostly HLA-DRB1 alleles (*01:01, *03:01, *04:01, *08:01, *11:01, *13:02and*15:01)were strongly linked withBTNL2blocks (Table 10, Table S2). However, there were some exceptions such asHLA-DRB1 *12:01and*13:01 (Table S2).
The DRB1,C4 haplotypes behaved like the DRB1,TNF
haplotypes showing association with different HLA-DRB1 alleles (Table 9).C4Bnull allele (haplotypesC4_2andC4_3) were found withDRB1*01:01,*04:01,*08:01and *13:01.HLA-DRB1*03:01 had C4AQ0 (C4_4; D9= 0.73; Table 10), but also a haplotype without aC4Anull allele (C4_1) was observed.HLA-DRB1*13:02
Figure 1. Recombination rates in MHC region.1A: The recombination rates for (HapMap [28]) in MHC region. 1B: Recombination rates in HapMap [28] for the 31 SNPs that are common in the current study and HapMap. 1C: Recombination rates for the 31 SNPs in the study (that are common in the study and HapMap [28])). The highest recombination rate was observed in theBTNL2promoter region.
had typically an insertion in the C4A gene (C4_5; D = 0.90 Table 10).
To summarize the LD and haplotype analysis and to the polymorphism of the MHC region and its relation toHLA-DRB1, an additional four-locus haplotype (HLA-DRB1, TNF block, BTNL2 block and C4; Table 11) and a six-locus haplotype (HLA-DRB1, HLA-B, TNF block, BTNL2 block, C4A and C4B allotypes; Table S5) were performed. The results showed that the extendedHLA-DRB1haplotypes were broken down whenHLA-B, C4 allotypes andTNFblock were taken into account.
To further analyze the structure ofTNFandBTNL2blocks we created phylogenetic trees of the genetic distance using sequence similarities (Figure S2). Three branches ofTNF were observed, from which two branches,TNF_3and_9formed haplotypes with HLA-DRB1*03:01and HLA-DRB1*13:02,respectively, which we previously showed with high LD. The third branch divided into three groups, first withTNF_2, second withTNF_4, _5and_8and third withTNF_1, _6, and_7. C4BQ0 related TNFhaplotypes, TNF_2 and TNF_4, belonged to the same main branch. The phylogenetic tree ofBTNL2blocks showed thatBTNL2_5and _7 (in linkage with HLA-DRB1*03:01 and *13:02, respectively) and BTNL2_6 (in linkage with HLA-*13:01) had different BTNL2 block structure than the rest.HLA-DRB1*12:01alleles had either BTNL2 blocksBTNL2_10 or _11. HLA-DRB1*11:01and *15:01 had structurally similar BTNL2 blocks, BTNL2_8 and _2, respectively.HLA-DRB1*01:01, HLA-DRB1*04 alleles and HLA-DRB1*07:01 and *08:01 formed a wide branch with similar BTNL2 blocks_3, _4, and _8,_10 and _11(in linkage with HLA-DRB1*01:01, *04:01-08, *07:01, *08:01, *11:01, *12:01, *15:01) andBTNL2_9(in linkage withHLA-DRB1*13:01).
Discussion
To our knowledge, no extensive study exist that combines information fromHLA-A,-B,-DRB1,-DQB1and–DPB1alleles with TNF, BTNL2 and complement C4 blocks. In this study, we addressed (i) the diversity of extended HLA-DRB1 haplotypes covering the MHC class I, II and III regions, (ii) the shared MHC or SNP markers in extendedHLA-DRB1haplotypes, and (iii) the challenge in detecting causal variants in the HLA data.
The most common Finnish A,B,DR –haplotype was
A*03,B*35,DRB1*01:01. Also other HLA-DRB1*01:01
haplo-types with variable levels of LD were observed. According to The Allele Frequency Net Database [41], only in a few populations e.g. the Swedish Sami [44] and Russia [46] the A*03,B*35,DRB1*01:01 was found with the frequency .2%.
In Finland, the second most common haplotype was A*01,B*08,DRB1*03:01 in high LD. This haplotype is not so
common in Finns as in other Europeans and has been previously referred as the ancestral haplotype AH 8.1 or autoimmune Table 4.TNFblocks (TNF_1– TNF_9) and their frequencies (.1.0%).HLA-DRB1Haplotypes withTNF, BTNL2andC4Blocks.
SNP TNF_1 TNF_2 TNF_3 TNF_4 TNF_5 TNF_6 TNF_7 TNF_8 TNF_9
rs2009658 C C C C G C C G C
rs2239704 A C C C C A A C C
rs2229094 T T T C C T T C T
rs2229092 A A A A A A A C A
rs1041981 C A A C C C C C A
rs1799964 T T T T C T T C T
rs1799724 C C C C C C T C C
rs1800629 G G A G G G G G G
rs361525 G G G G G G G G G
rs3093664 A A A A A A A A G
rs769178 G G G G G G T G G
rs3093553 T T T T T T T T T
rs2256965 A G G A G G A G G
F 0.210 0.167 0.153 0.130 0.090 0.080 0.057 0.047 0.030 0.96#
doi:10.1371/journal.pone.0079690.t004
Table 5.Two-locus haplotypes ofHLA-DRB1withTNFblock (.1.0%)#.
DRB1 allele TNF block f
*01:01 TNF_4 0.103
*03:01 TNF_3 0.076
*04:01 TNF_2 0.022
*04:01 TNF_5 0.027
*04:08 TNF_1 0.016
*07:01 TNF_1 0.040
*08:01 TNF_1 0.027
*08:01 TNF_2 0.048
*08:01 TNF_6 0.030
*09:01 TNF_6 0.025
*11:01 TNF_3 0.014
*13:01 TNF_1 0.017
*13:01 TNF_2 0.035
*13:02 TNF_9 0.026
*15:01 TNF_1 0.075
*15:01 TNF_4 0.016
*15:01 TNF_7 0.014
f = frequency.
haplotype [47,48]. Another conserved haplotype with strong LD, but rare in the Finnish population, was HLA-DRB1*13:02 reaching fromTNFtoHLA-DQB1.
The enrichment or loss of certain HLA haplotypes (Table 2) reflects the characteristics of the Finnish population structure,
which has evolved through multiple genetic bottlenecks [6,7]. Detailed information of population substructures was presented by the 16th International HLA and Immunogenic Workshop IHIW project (‘‘Analysis of HLA Population Data’’ [8]. Most impor-tantly, the multidimensional scaling (MDS) ofHLA-DRB1revealed Table 6.BTNL2blocks (BTNL2_1– BTNL2_12) and their frequencies (.1.0%).
SNP BTNL2_1 BTNL2_2 BTNL2_3 BTNL2_4 BTNL2_5 BTNL2_6 BTNL2_7 BTNL2_8 BTNL2_9 BTNL2_10 BTNL2_11 BTNL2_12
rs28362678 T C C C C T C C C C C C
rs2076530 C T C T T C T T T T T T
rs9268480 C C T C C C C C C C C C
rs2076529 C T C T T C T T T T T T
rs3793127 C C T C C C C C C C C C
rs28362683 G G G A G A G G G G G G
rs3763311 C C T C C C C C C C C C
rs3763312 G G A G G G G G G G G G
rs3763313 C A A C A A A A A A A C
rs3763317 T C T T C C C C C C C T
rs5007259 C T C C T T T T T T T C
rs17208888 G G G G G G G A G G G G
rs9405098 G G G G G G G G G G G G
rs9268528 A A G A A A A G A G G A
rs9268541 T T T T T T T T T C C T
rs2395166 C C T T T T T T T T T C
rs3135365 T G T T T T T T T T T T
rs3135363 T T T T C C C C C T T T
rs3135351 G G G G T T T G T G G G
rs3135344 G G A A A A A A A A A G
rs3129843 A A A A G A A A A A A A
rs3135341 T G T T T T T T T T T G
rs2027856 C C C T C C C C C C C C
rs3129871 C A C A C A C C C A A A
rs9405035 G G G G G G G G G G G G
rs9268644 A A C C A A A C A A C C
rs3129877 A G G G A A A G A G G G
rs3135392 T G G T T T T G T T T T
rs3129882 A G A G A A A G A G G G
rs8084 C A C A A A A A A A A A
rs2239804 A A G A A A A G A A A A
rs11544315 G G G G G G G G G G G A
rs3177928 A G G G G G G G G G G A
rs3135388 C T C C C C C C C C C C
rs2213585 T C T C C C C T C C C T
rs6937545 C A C C A A A C A C C C
rs9268833 C C T C C C C C C C C C
rs6919855 T C T T T T T C T T T T
rs7766843 C C C T T T T C T T T C
rs2395185 G G T G G G G G G G G T
rs9268979 T T C C C C C T C C C C
rs7748472 A A A A A A G A A A A A
f 0.150 0.143 0.137 0.103 0.097 0.053 0.040 0.040 0.020 0.020 0.017 0.013
that the Finns and the Sami are closer to the North-East Asians than to other European populations [8]. In general, the HLA variation in Europe follows the North to Southeast axis corresponding to the previous principal component analysis (PCA) based results that utilized genome-wide SNP data [7]. Interestingly in Finland, the prevalence of certain HLA alleles have shown regional differences [40] e.g. HLA-B*35 being highest in the Eastern parts of Finland. Also GWASs have shown similar trends [7]. The HLA haplotype deviations in relation to the Finnish population substructure warrant replication studies. The population stratification is important e.g. for control selection [34]. We found that the majority ofHLA-DRB1alleles were inherited as extended blocks from BTNL2 toHLA-DQB1. In spite of the observed recombination rate in theBTNL2promoter region, most DRB1,BTNL2blocks appeared to be conserved. Including
HLA-B,TNF, C4andHLA-DPB1the number of extendedHLA-DRB1 haplotypes strongly increased. The positions of the MHC recombination sites vary between populations [49] explaining partly the non-replication of disease associations between popu-lations (e.g. [19,50,51]).
Our multi-locus haplotype analysis shows that the extended HLA-DRB1 haplotypes can be grouped according to functional similarities. Especially interesting for disease association studies are theHLA-DRB1haplotypes not common in the general population. Furthermore,TNFand LTAgenes are cytokines involved in the
activation of inflammatory processes; hence the HLA-DRB1 haplotypes with gene expression related SNPs (rs2239704, rs1041981 and rs1800629) [2,52] are plausible candidates for inflammatory diseases. For example, a rare HLA-DRB1*15:01,TNF_4 haplotype has a different nucleotide in
rs2239704 compared with more frequent HLA-DRB1*15:01,TNF haplotypes. Interestingly, the sameTNF_4is
also found with HLA-DRB1*01:01 shown to be associated with inflammatory reactions [53]. The extendedHLA-DRB1haplotypes ofHLA-DRB1*03:01, *08:01, *11:01, *12:01, *13:02 and*15:01 can be grouped according to exonic missense SNP (rs2076530) causing truncated protein of the T-cell inhibitorBTNL2[19]. Of the complement C4 proteins, theC4Anull alleles were primarily found with two conserved haplotypes,HLA-DRB1*03:01(AH 8.1) and HLA-DRB1*13:02. C4B null alleles were characteristically inherited with the most common Finnish haplotype A*03,B*35,DRB1*01:01 or with HLA-DRB1*04:01, *08:01
and *13:01. C4 null alleles have shown to be related to many diseases [18]. Taken together, the extendedHLA-DRB1haplotype analysis can reveal predisposing/protective associations between markers and disease loci not detectable with a single MHC allele [34].
Overall, analysis of immunogenomic data is challenging. Resolving HLA allele ambiguity, phasing and LD calculation warrant particular expertise, and the traditional software tools (e.g. Haploview and PLINK) are not suitable for multiple loci polymorphic data like HLA [34,54]. Haplotypes rather than single markers were used to decrease phasing errors [55]. Due to the strong LD, multiple SNPs may have corresponding statistical Table 7.Two-locus haplotypes ofHLA-DRB1withBTNL2block
(.1.0%)#.
HLA-DRB1 BTNL2 block f
*01:01 BTNL2_1 0.147
*03:01 BTNL2_5 0.097
*04:01 BTNL2_3 0.064
*04:03 BTNL2_3 0.013
*04:08 BTNL2_3 0.020
*07:01 BTNL2_3 0.023
*07:01 BTNL2_12 0.013
*08:01 BTNL2_4 0.103
*11:01 BTNL2_8 0.037
*12:01 BTNL2_10 0.020
*12:01 BTNL2_11 0.016
*13:01 BTNL2_6 0.053
*13:02 BTNL2_7 0.040
*15:01 BTNL2_2 0.143
#Rare haplotypes were excluded. f = frequency.
doi:10.1371/journal.pone.0079690.t007
Table 8.C4 blocks (C4_1– C4_6) and their frequencies (.1.0%).
C4 gene C4_1 C4_2 C4_3 C4_4 C4_5 C4_6
C4A 1 2 1 Q0 InsCT 2
C4B 1 Q0 Q0 1 1 1
f 0.59 0.17 0.09 0.08 0.03 0.03
doi:10.1371/journal.pone.0079690.t008
Table 9.Two-locus haplotypes of HLA-DRB1 with C4 block (.1.0%)#.
HLA-DRB1 C4 block f
*01:01 2 0.083
*01:01 1 0.032
*01:01 3 0.029
*03:01 4 0.068
*03:01 1 0.022
*04:01 1 0.038
*04:01 2 0.026
*04:04 1 0.019
*04:08 1 0.019
*07:01 1 0.046
*08:01 1 0.082
*08:01 3 0.041
*09:01 1 0.029
*11:01 1 0.036
*12:01 1 0.024
*13:01 1 0.045
*13:01 2 0.032
*13:02 5 0.030
*15:01 1 0.120
*15:01 6 0.016
#
Rare haplotypes were excluded. Q0 = null allele.
InsCT = insertion in C4A gene. f = frequency.
Table 10.HLA-DRB1alleles in strong LD#withTNF, C4andBTNL2blocks andHLA-DQB1and-DPB1alleles. LD is measured with D
9/r2.
HLA-DRB1*01:01 HLA-DRB1*03:01 HLA-DRB1*04:01 HLA-DRB1*08:01 HLA-DRB1*09:01 HLA-DRB1*11:01 HLA-DRB1*12:01
HLA-DRB1*13:01 HLA-DRB1*13:02 HLA-DRB1*15:01
TNF_3 – 0.80/0.37 – – – – – – – –
TNF_9 – – – – – – – – 0.88/0.53 –
C4_4 – 0.73/0.46 – – – – – – – –
C4_5 – – – – – – – – 0.90/0.61 –
BTNL2-1 1.0/0.97 – – – – – – – – –
BTNL2-2 – – – – – – – – – 1.0/0.97
BTNL2-3 – – 0.95/0.43 – – – – – – –
BTNL2-4 – – – 1.0/0.82 – – – – – –
BTNL2-5 – 1.0/1.0 – – – – – – – –
BTNL2-6 – – – – – – – 1.0/0.57 – –
BTNL2-7 – – – – – – – – 1.0/0.92 –
BTNL2-8 – – – – – 0.91/0.84 – – – –
BTNL2-10 – – – – – – 1.0/0.54 – – –
BTNL2-11 – – – – – – 1.0/0.45 – – –
DQB1*02 – 1.0/0.68 – – – – – – – –
DQB1*03:03 – – – – 1.0/0.76 – – – – –
DQB1*04 – – – 1.0/0.97 – – – – – –
DQB1*05 1.0/0.90 – – – – – – – – –
DQB1*06:02 – – – – – – – – – 1.0/1.0
DQB1*06:03 – – – – – – – 1.0/1.0 – –
DQB1*06:04 – – – – – – – – 1.0/1.0 –
DPB1*01:01 – 0.87/0.43 – – – – – – – –
#
Here the strong LD (D9.0.80) presented if r2.0.35 and P value,0.05. doi:10.1371/journal.pone.0079690.t010
Diversity
of
Extended
HLA-DRB1
Haplotypes
ONE
|
www.ploson
e.org
10
November
2013
|
Volume
8
|
Issue
11
|
proof of association making the search for possible causal variants exceptionally difficult. To clarify the complexity, the known tag-SNP forHLA-DRB1*15:01(rs3135388) (see Figure S3), was shown to have at least 20 proxy SNPs (r2.0.9) with variable function and in different gene regions [14,22,38]. The SNPs’ allele frequency might be also population specific (rs2213585; Table S4), and thus the tag-SNPing (i.e. imputation) should not be used unless the ethnic background is known [56]. Here in this material, except the tag-SNP for HLA-DRB1*15:01 (rs3135388) [14,22], we did not detect any single tag-SNP for a specificHLA-DRB1allele. Indeed, large population specific cohorts and dense SNP genotyping is needed for detecting HLA tag-SNPs.
We acknowledge that the multiple ambiguous alleles, limited sample size, and rare HLA alleles can influence the haplotype phasing and LD leading to false positive results [34]. In case of small sample size, the study of the rare MHC haplotypes is challenging. Thus, we presented only frequent MHC haplotypes (.1%) and interpreted the LD between markers carefully [34,35,54,55,57]. The HLA allele distributions were consistent with the previously published Finnish registry studies [39,40] suggesting that the Finnish HLA profile can be estimated with a sample set containing 150 individuals.
One of the limitations of this study was the lack of genome-wide SNP data. Hence, we were not able to use HLA*IMP [58] for allele imputation or analyse the HLA tagging SNPs in the Finnish populations [22]. Because of the differences between populations,
population specific validation is highly recommended before using either the HLA*IMP or the HLA tagging SNPs [7,14,23].
Taken together, we stress the importance of understanding the population specific MHC haplotypes and the analysis of immu-nogenetic data. The study of extended HLA-DRB1 haplotypes indicates the functionality of the implicated genes and provides hypotheses for further assessment of HLA-DRB1. The results presented here assist for disease association studies focusing in chronic inflammatory, autoimmune and infectious diseases.
Supporting Information
Figure S1 The LD (r2) structure of TNF and BTNL2
blocks using SNPs.
(TIF)
Figure S2 Phylogenetic trees based on the genetic
distance of TNF and BTNL2 blocks with bootstrap values.
(TIF)
Figure S3 A known tag-SNP for HLA-DRB1*15:01 is in
strong LD with many other SNPs in the MHC Class III region.The known proxies are taken from the HapMap [28] and using the software SNAP [38].
(TIF)
Table S1 The two-locus haplotypes with frequency
.1%.
(DOC)
Table S2 The observedHLA-DRB1alleles (%) with
HLA-A, -B, -DQB1and-DPB1alleles andTNF, C4andBTNL2
blocks.
(DOC)
Table S3 In the database (HapMap or 1000Genomes)
there can be found several proxy SNPs (r2.0.9) for the genotyped SNPs.
(DOC)
Table S4 A summary of the accepted SNPs (n = 55).The
Finnish allele frequencies were compared with HapMap project (CEU) data [28].
(DOC)
Table S5 TheHLA-DRB1haplotypes withHLA-Balleles,
TNF and BTNL2 blocks and C4 allotypes (.1%).
(DOC)
Acknowledgments
The authors thank the subjects for their participation and the clinicians for their time and efforts to make this study possible. We also thank Leena Saraste and Mari Kaunisto for reviewing the English language and Minna Veini, Kukka Aimonen, Kaisa Roine, Hanna Vauhkonen, Anil Palikhe, Krista Salli, Jagoda Lasota, Minna Haanpa¨a¨ and Mari Kaunisto for their contribution in gene analyses.
Author Contributions
Conceived and designed the experiments: AW EV LEL MLL. Performed the experiments: AW EV LEL MLL. Analyzed the data: AW EV LEL KTE RP MLL. Contributed reagents/materials/analysis tools: AW EV KTE MS. Wrote the paper: AW EV LEL RP KTE MS MLL.
Table 11.The extendedHLA-DRB1haplotypes withTNF,C4 andBTNL2blocks (.1%).
HLA-DRB1 TNF block C4 block BTNL2 block f
*01:01 TNF_4 2 BTNL2_1 0.059
*01:01 TNF_4 3 BTNL2_1 0.026
*01:01 TNF_4 1 BTNL2_1 0.017
*01:01 TNF_8 2 BTNL2_1 0.012
*03:01 TNF_3 4 BTNL2_5 0.065
*03:01 TNF_3 1 BTNL2_5 0.011
*04:01 TNF_5 1 BTNL2_3 0.024
*04:01 TNF_2 2 BTNL2_3 0.022
*04:08 TNF_1 1 BTNL2_3 0.013
*07:01 TNF_1 1 BTNL2_3 0.023
*08:01 TNF_6 1 BTNL2_4 0.028
*08:01 TNF_2 1 BTNL2_4 0.022
*08:01 TNF_2 3 BTNL2_4 0.022
*08:01 TNF_1 1 BTNL2_4 0.016
*11:01 TNF_5 1 BTNL2_8 0.011
*13:01 TNF_2 2 BTNL2_6 0.014
*13:01 TNF_1 1 BTNL2_6 0.012
*13:02 TNF_9 5 BTNL2_7 0.027
*15:01 TNF_1 1 BTNL2_2 0.059
*15:01 TNF_7 1 BTNL2_2 0.016
*15:01 TNF_5 1 BTNL2_2 0.012
f = haplotype frequency.
References
1. Horton R, Wilming L, Rand V, Lovering RC, Bruford EA, et al. (2004) Gene map of the extended human MHC. Nat Rev Genet 5: 889–899. 10.1038/ nrg1489.
2. Knight JC, Keating BJ, Kwiatkowski DP (2004) Allele-specific repression of lymphotoxin-alpha by activated B cell factor-1. Nat Genet 36: 394–399. 10.1038/ng1331.
3. Nguyen T, Liu XK, Zhang Y, Dong C (2006) BTNL2, a butyrophilin-like molecule that functions to inhibit T cell activation. J Immunol 176: 7354–7360. 4. Jeffreys AJ, Kauppi L, Neumann R (2001) Intensely punctate meiotic recombination in the class II region of the major histocompatibility complex. Nat Genet 29: 217–222. 10.1038/ng1001-217.
5. Kauppi L, Sajantila A, Jeffreys AJ (2003) Recombination hotspots rather than population history dominate linkage disequilibrium in the MHC class II region. Hum Mol Genet 12: 33–40.
6. Jakkula E, Rehnstrom K, Varilo T, Pietilainen OP, Paunio T, et al. (2008) The genome-wide patterns of variation expose significant substructure in a founder population. Am J Hum Genet 83: 787–794. 10.1016/j.ajhg.2008.11.005; 10.1016/j.ajhg.2008.11.005.
7. Nelis M, Esko T, Magi R, Zimprich F, Zimprich A, et al. (2009) Genetic structure of europeans: A view from the north-east. PLoS One 4: e5472. 10.1371/journal.pone.0005472; 10.1371/journal.pone.0005472.
8. Riccio ME, Buhler S, Nunes JM, Vangenot C, Cuenod M, et al. (2013) 16(th) IHIW: Analysis of HLA population data, with updated results for 1996 to 2012 workshop data (AHPD project report). Int J Immunogenet 40: 21–30. 10.1111/ iji.12033; 10.1111/iji.12033.
9. Lee SJ, Klein J, Haagenson M, Baxter-Lowe LA, Confer DL, et al. (2007) High-resolution donor-recipient HLA matching contributes to the success of unrelated donor marrow transplantation. Blood 110: 4576–4583. 10.1182/blood-2007-06-097386.
10. Kawase T, Morishima Y, Matsuo K, Kashiwase K, Inoko H, et al. (2007) High-risk HLA allele mismatch combinations responsible for severe acute graft-versus-host disease and implication for its molecular mechanism. Blood 110: 2235– 2241. 10.1182/blood-2007-02-072405.
11. Petersdorf EW, Malkki M, Horowitz MM, Spellman SR, Haagenson MD, et al. (2013) Mapping MHC haplotype effects in unrelated donor hematopoietic cell transplantation. Blood 121: 1896–1905. 10.1182/blood-2012-11-465161; 10.1182/blood-2012-11-465161.
12. Palikhe A, Sinisalo J, Seppanen M, Valtonen V, Nieminen MS, et al. (2007) Human MHC region harbors both susceptibility and protective haplotypes for coronary artery disease. Tissue Antigens 69: 47–55. 10.1111/j.1399-0039.2006.00735.x.
13. Kallio-Laine K, Seppanen M, Aittoniemi J, Kautiainen H, Seppala I, et al. (2010) HLA-DRB1*01 allele and low plasma immunoglobulin G1 concentration may predispose to herpes-associated recurrent lymphocytic meningitis. Hum Immunol 71: 179–181. 10.1016/j.humimm.2009.10.014.
14. de Bakker PI, Raychaudhuri S (2012) Interrogating the major histocompatibility complex with high-throughput genomics. Hum Mol Genet 21: R29–36. 10.1093/hmg/dds384.
15. Gough SC, Simmonds MJ (2007) The HLA region and autoimmune disease: Associations and mechanisms of action. Curr Genomics 8: 453–465. 10.2174/ 138920207783591690; 10.2174/138920207783591690.
16. Kainulainen L, Peltola V, Seppanen M, Viander M, He Q, et al. (2012) C4A deficiency in children and adolescents with recurrent respiratory infections. Hum Immunol 73: 498–501. 10.1016/j.humimm.2012.02.015; 10.1016/ j.humimm.2012.02.015.
17. Seppanen M, Suvilehto J, Lokki ML, Notkola IL, Jarvinen A, et al. (2006) Immunoglobulins and complement factor C4 in adult rhinosinusitis. Clin Exp Immunol 145: 219–227. 10.1111/j.1365–2249.2006.03134.x.
18. Samano ES, Ribeiro Lde M, Gorescu RG, Rocha KC, Grumach AS (2004) Involvement of C4 allotypes in the pathogenesis of human diseases. Rev Hosp Clin Fac Med Sao Paulo 59: 138–144./S0041–87812004000300009. 19. Valentonyte R, Hampe J, Huse K, Rosenstiel P, Albrecht M, et al (2005)
Sarcoidosis is associated with a truncating splice site mutation in BTNL2. Nat Genet 37: 357–364. 10.1038/ng1519.
20. Mitsunaga S, Hosomichi K, Okudaira Y, Nakaoka H, Kunii N, et al. (2013) Exome sequencing identifies novel rheumatoid arthritis-susceptible variants in the BTNL2. J Hum Genet. 10.1038/jhg.2013.2; 10.1038/jhg.2013.2. 21. Koskinen L, Romanos J, Kaukinen K, Mustalahti K, Korponay-Szabo I, et al.
(2009) Cost-effective HLA typing with tagging SNPs predicts celiac disease risk haplotypes in the finnish, hungarian, and italian populations. Immunogenetics 61: 247–256. 10.1007/s00251-009-0361-3; 10.1007/s00251-009-0361-3. 22. de Bakker PI, McVean G, Sabeti PC, Miretti MM, Green T, et al. (2006) A
high-resolution HLA and SNP haplotype map for disease association studies in the extended human MHC. Nat Genet 38: 1166–1172. 10.1038/ng1885. 23. Monsuur AJ, de Bakker PI, Zhernakova A, Pinto D, Verduijn W, et al. (2008)
Effective detection of human leukocyte antigen risk alleles in celiac disease using tag single nucleotide polymorphisms. PLoS One 3: e2270. 10.1371/journal.-pone.0002270; 10.1371/journal.pone.0002270.
24. Buhler S, Nunes JM, Nicoloso G, Tiercy JM, Sanchez-Mazas A (2012) The heterogeneous HLA genetic makeup of the swiss population. PLoS One 7: e41400. 10.1371/journal.pone.0041400; 10.1371/journal.pone.0041400.
25. Mack SJ, Tu B, Lazaro A, Yang R, Lancaster AK, et al. (2009) HLA-A, -B, -C, and -DRB1 allele and haplotype frequencies distinguish eastern european americans from the general european american population. Tissue Antigens 73: 1 7 – 3 2 . 1 0 . 1 1 1 1 / j . 1 3 9 9 - 0 0 3 9 . 2 0 0 8 . 0 1 1 5 1 . x ; 1 0 . 1 1 1 1 / j . 1 3 9 9 -0039.2008.01151.x.
26. Robinson J, Halliwell JA, McWilliam H, Lopez R, Parham P, et al. (2013) The IMGT/HLA database. Nucleic Acids Res 41: D1222-7. 10.1093/nar/gks949; 10.1093/nar/gks949.
27. Laaksonen M, Pastinen T, Sjoroos M, Kuokkanen S, Ruutiainen J, et al. (2002) HLA class II associated risk and protection against multiple sclerosis-a finnish family study. J Neuroimmunol 122: 140–145.
28. International HapMap Consortium (2003) The international HapMap project. Nature 426: 789–796. 10.1038/nature02168.
29. Paakkanen R, Vauhkonen H, Eronen KT, Jarvinen A, Seppanen M, et al. (2012) Copy number analysis of complement C4A, C4B and C4A silencing mutation by real-time quantitative polymerase chain reaction. PLoS One 7: e38813. 10.1371/journal.pone.0038813; 10.1371/journal.pone.0038813. 30. Barrett JC, Fry B, Maller J, Daly MJ (2005) Haploview: Analysis and
visualization of LD and haplotype maps. Bioinformatics 21: 263–265. 10.1093/bioinformatics/bth457.
31. Excoffier L, Laval G, Schneider S (2005) Arlequin (version 3.0): An integrated software package for population genetics data analysis. Evol Bioinform Online 1: 47–50.
32. Stephens M, Smith NJ, Donnelly P (2001) A new statistical method for haplotype reconstruction from population data. Am J Hum Genet 68: 978–989. 10.1086/ 319501.
33. Mack SJ, Tu B, Yang R, Masaberg C, Ng J, et al. (2011) Human leukocyte antigen-A, -B, -C, -DRB1 allele and haplotype frequencies in americans originating from southern europe: Contrasting patterns of population differen-tiation between italian and spanish americans. Hum Immunol 72: 144–149. 10.1016/j.humimm.2010.10.017; 10.1016/j.humimm.2010.10.017.
34. Hollenbach JA, Mack SJ, Gourraud PA, Single RM, Maiers M, et al. (2011) A community standard for immunogenomic data reporting and analysis: Proposal for a STrengthening the REporting of immunogenomic studies statement. Tissue Antigens 78: 333–344. 10.1111/j.1399-0039.2011.01777.x; 10.1111/ j.1399-0039.2011.01777.x.
35. Pan Q, Fan S, Wang X, Zhao X, Pan M, et al. (2011) The distribution of HLA-A, -B, and -DRB1 alleles and haplotypes in inhabitants of guizhou province of china. J Biomed Res 25: 328–334. 10.1016/S1674-8301(11)60044-4; 10.1016/ S1674-8301(11)60044-4.
36. Zapata C (2000) The D9measure of overall gametic disequilibrium between pairs of multiallelic loci. Evolution 54: 1809–1812.
37. Paradis E, Claude J, Strimmer K (2004) APE: Analyses of phylogenetics and evolution in R language. Bioinformatics 20: 289–290.
38. Johnson AD, Handsaker RE, Pulit SL, Nizzari MM, O’Donnell CJ, et al. (2008) SNAP: A web-based tool for identification and annotation of proxy SNPs using HapMap. Bioinformatics 24: 2938–2939. 10.1093/bioinformatics/btn564; 10.1093/bioinformatics/btn564.
39. Haimila K, Penttila A, Arvola A, Auvinen MK, Korhonen M (2013) Analysis of the adequate size of a cord blood bank and comparison of HLA haplotype distributions between four populations. Hum Immunol 74: 189–195. 10.1016/ j.humimm.2012.10.018; 10.1016/j.humimm.2012.10.018.
40. Siren MK, Sareneva H, Lokki ML, Koskimies S (1996) Unique HLA antigen frequencies in the finnish population. Tissue Antigens 48: 703–707. 41. Gonzalez-Galarza FF, Christmas S, Middleton D, Jones AR (2011) Allele
frequency net: A database and online repository for immune gene frequencies in worldwide populations. Nucleic Acids Res 39: D913–9. 10.1093/nar/gkq1128; 10.1093/nar/gkq1128.
42. Williams F, Meenagh A, Maxwell AP, Middleton D (1999) Allele resolution of HLA-A using oligonucleotide probes in a two-stage typing strategy. Tissue Antigens 54: 59–68.
43. Middleton D, Williams F, Hamill MA, Meenagh A (2000) Frequency of HLA-B alleles in a caucasoid population determined by a two-stage PCR-SSOP typing strategy. Hum Immunol 61: 1285–1297.
44. Johansson A, Ingman M, Mack SJ, Erlich H, Gyllensten U (2008) Genetic origin of the swedish sami inferred from HLA class I and class II allele frequencies. Eur J Hum Genet 16: 1341–1349. 10.1038/ejhg.2008.88; 10.1038/ ejhg.2008.88.
45. Papassavas EC, Spyropoulou-Vlachou M, Papassavas AC, Schipper RF, Doxiadis IN, et al. (2000) MHC class I and class II phenotype, gene, and haplotype frequencies in greeks using molecular typing data. Hum Immunol 61: 615–623.
46. Arnaiz-Villena A, Martinez-Laso J, Moscoso J, Livshits G, Zamora J, et al. (2003) HLA genes in the chuvashian population from european russia: Admixture of central european and mediterranean populations. Hum Biol 75: 375–392.
48. Price P, Witt C, Allcock R, Sayer D, Garlepp M, et al. (1999) The genetic basis for the association of the 8.1 ancestral haplotype (A1, B8, DR3) with multiple immunopathological diseases. Immunol Rev 167: 257–274.
49. Lam TH, Shen M, Chia JM, Chan SH, Ren EC (2013) Population-specific recombination sites within the human MHC region. Heredity (Edinb). 10.1038/ hdy.2013.27; 10.1038/hdy.2013.27.
50. Rybicki BA, Walewski JL, Maliarik MJ, Kian H, Iannuzzi MC, et al. (2005) The BTNL2 gene and sarcoidosis susceptibility in african americans and whites. Am J Hum Genet 77: 491–499. 10.1086/444435.
51. Spagnolo P, Sato H, Grutters JC, Renzoni EA, Marshall SE, et al. (2007) Analysis of BTNL2 genetic polymorphisms in british and dutch patients with sarcoidosis. Tissue Antigens 70: 219–227. 10.1111/j.1399-0039.2007.00879.x. 52. Ozaki K, Ohnishi Y, Iida A, Sekine A, Yamada R, et al. (2002) Functional SNPs
in the lymphotoxin-alpha gene that are associated with susceptibility to myocardial infarction. Nat Genet 32: 650–654. 10.1038/ng1047.
53. Sane J, Kurkela S, Desdouits M, Kalimo H, Mazalrey S, et al. (2012) Prolonged myalgia in sindbis virus infection: Case description and in vitro infection of myotubes and myoblasts. J Infect Dis 206: 407–414. 10.1093/infdis/jis358. 54. Cano P, Klitz W, Mack SJ, Maiers M, Marsh SG, et al. (2007) Common and
well-documented HLA alleles: Report of the ad-hoc committee of the american
society for histocompatiblity and immunogenetics. Hum Immunol 68: 392–417. 10.1016/j.humimm.2007.01.014.
55. Furst D, Zollikofer C, Schrezenmeier H, Mytilineos J (2012) TNFA promoter alleles–frequencies and linkage with classical HLA genes in a south german caucasian population. Tissue Antigens 80: 502–508. 10.1111/tan.12025; 10.1111/tan.12025.
56. Valente FP, Tan CR, Temple SE, Phipps M, Witt CS, et al. (2009) The evolution and diversity of TNF block haplotypes in european, asian and australian aboriginal populations. Genes Immun 10: 607–615. 10.1038/ gene.2009.45; 10.1038/gene.2009.45.
57. Gourraud PA, Meenagh A, Cambon-Thomsen A, Middleton D (2010) Linkage disequilibrium organization of the human KIR superlocus: Implications for KIR data analyses. Immunogenetics 62: 729–740. 10.1007/s00251-010-0478-4; 10.1007/s00251-010-0478-4.