Mailing Address: Sergio Lamego Rodrigues •
Centro de Investigação Cardiovascular - UFES – Av. Marechal Campos, 1468 – Maruípe – 29042-755 – Vitória, ES, Brazil E-mail: [email protected]; [email protected]
Manuscript received May 17, 2011, revised manuscript received July 05, 2011; accepted July 28, 2011.
Gender Distribution of Serum Uric Acid and Cardiovascular Risk
Factors: Population Based Study
Sérgio Lamego Rodrigues
1, Marcelo Perim Baldo
1, Daniel Pires Capingana
1, Pedro Magalhães
1, Eduardo Miranda
Dantas
1, Maria del Carmen Bisi Molina
2, Luciane Bresciani Salaroli
2, Renato Lírio Morelato
1,3, José Geraldo Mill
1 Departamento de Ciências Fisiológicas - Universidade Federal do Espírito Santo1; Departamento de Saúde Coletiva - Universidade Federal do Espírito Santo2; Departamento de Clínica Médica - Escola Superior de Ciências da Santa Casa de Misericórdia de Vitória (EMESCAM)3, Vitória, ES - BrazilAbstract
Background: There is no data concerning the epidemiology of hyperuricemia in Brazilian population-based studies.
Objective: To investigate the distribution of serum uric acid and its relationship with demographics and cardiovascular variables.
Methods: We studied 1,346 individuals. Hyperuricemia was defined as ≥ 6.8 and ≥ 5.4 mg/dL for men and women,
respectively. Metabolic syndrome (MS) was defined with NCEP ATP III criteria.
Results: The prevalence of hyperuricemia was 13.2%. The association of serum uric acid (SUA) with cardiovascular risk factors was gender-specific: in women, higher SUA was associated with increasing BMI, even after adjustments for age and systolic blood pressure (SBP). In men, the relationship of SUA with HDLc was mediated by BMI, whereas in women, SUA was similar and dependent on BMI, regardless of glucose levels and presence of hypertension. In men, triglycerides, waist circumference (WC) and SBP explained 11%, 4% and 1% of SUA variability, respectively. In women, WC and triglycerides explained 9% and 1% of SUA variability, respectively. Compared to the first quartile, men and women in the fourth quartile had a 3.29 fold and 4.18 fold increase of MS risk, respectively. Women had almost three fold higher prevalence of diabetes mellitus. Normotensive men with MS presented higher SUA, regardless of BMI.
Conclusion: Our results seem to justify the need for gender-based evaluation regarding the association of SUA with cardiovascular risk factors, which was more pronounced in women. MS was positively associated with increasing SUA, regardless of gender. Abdominal obesity and hypertriglyceridemia were the main factors associated with hyperuricemia even in normotensive individuals, which may add a higher risk for hypertension. (Arq Bras Cardiol 2012;98(1):13-21)
Keywords: Uric acid, risk factors, cardiovascular diseases, population studies, epidemiology, Brazil.
for new onset diabetes in hypertensive patients with left ventricular hypertrophy8.
Not differently from many other developing countries, Brazil is facing a growing incidence of obesity and metabolic disturbances9. Large epidemiological studies have shown that
SUA is often high in individuals with MS and that its prevalence increases according to SUA levels10,11. However, as recently
reported12, there is scarce data regarding SUA in Brazil and
so far, no data has been reported on the prevalence and epidemiological characteristics of hyperuricemia on studies that reflect the general Brazilian population with diverse ethnic groups, food intake and physical activity habits. Therefore, we sought to investigate in a large population-based sample the distribution of SUA and its relationship with gender, ethnicity, social class, physical activity, MS and cardiovascular risk factors. In addition, we searched for the best cut off points of SUA associated with MS by using the receiver-operating characteristics (ROC) curve analysis.
Introduction
The association between serum uric acid (SUA) and cardiovascular (CV) diseases such as hypertension1, metabolic
syndrome (MS)2, coronary and cerebral vascular diseases3,4
has been reported in several epidemiologic studies. However, SUA has not been considered an independent cardiovascular risk factor, but only an additional factor associated with CV diseases due to the presence of other conditions such as obesity, dyslipidemia, hypertension, use of diuretics or insulin resistance5. Accordingly, hyperuricemia has been
largely considered a finding without specific significance unless complicated by gout or kidney stones6. However,
recent reports added further indication of a possible link between SUA and cardiovascular disease, as hyperuricemia was associated with increased mortality and myocardial infarction in individuals with renal failure, even after adjustment for renal function and risk factors for MS7. In
Methods
Study Design and Sample Selection
A cross-sectional and population-based study was performed to determine the prevalence and severity of cardiovascular risk factors in the urban population of Vitória, Brazil. Data were collected according to the general guidelines of the MONICA-WHO Project13. A sample of 1,661
individuals was selected from the eligible population (25–64 years) by using a procedure of household randomization. These individuals came to the University Hospital to undergo clinical and laboratory exams. The design and sampling of this survey was described elsewhere14. The project was
approved by the institutional ethics committee and all participants gave informed written consent. Individuals in use of drugs to lower serum lipids, uric acid or blood pressure (including diuretics) or with serum creatinine >1.2 mg/dL were excluded from this analysis, leaving a final sample of 1,346 individuals (645 men).
Measurements
Blood pressure was measured during the morning period (07:00 to 09:00 AM) in fasting individuals in the sitting position by using a standard mercury sphygmomanometer on the left arm after a 5–10 min rest period. The first and fifth phases of Korotkoff sounds were used to indicate systolic and diastolic blood pressure, respectively. Mean values of systolic and diastolic blood pressure were calculated from two measurements carried out by two independent trained staff members, with a minimal interval of 10 min between the two readings. Blood pressure was defined according to the VI Joint National Committee on Prevention, Detection, Evaluation, and Treatment of High Blood Pressure15.Participants were considered hypertensive in the presence of systolic blood pressure ≥ 140 mmHg or diastolic blood pressure ≥ 90 mmHg. For
biochemical analysis, blood samples were collected soon after blood pressure measurements to determine glucose, creatinine, triglycerides, uric acid, total cholesterol and high-density lipoprotein-cholesterol (HDLc) by using validated commercial kits.
Anthropometric parameters were obtained by trained technicians using standard methods. Body weight was taken on a calibrated scale to the nearest 0.1 kg. Height was taken with a wall-mounted stadiometer to the nearest 0.5 cm. Body mass index (BMI) was calculated as body weight (kg) to the squared height (m2). Waist circumference (WC) was
measured at the mean point between the lowest rib margin and iliac crest with the participant standing and at the maximum point of normal expiration. History of cigarette smoking was considered present if an individual was a current smoker. Individuals were considered physically active if they engaged in moderate physical activity for
at least 30 minutes ≥ 3 times a week. According to the
NECP ATP III criteria16, MS was defined when any three
of the five following diagnostic criteria were present: WC
≥ 102 cm in men and ≥88cm in women; type II diabetes mellitus or fasting glucose ≥110 mg/dL; HDL-chol ≤ 40 mg/
dL in men and ≤50 mg/dL in women; triglycerides ≥ 150 mg/dL; systolic blood pressure ≥ 130 mmHg or diastolic blood pressure ≥ 85 mmHg. Diabetes was defined when
a positive history was present or the fasting blood glucose
was ≥ 126 mg/dL. Impaired fasting glucose was defined
as fasting glucose ranging from 110 mg/dL to 125.9 mg/dL. The individuals were classified into five socioeconomic classes on the basis of data on the education level of the household head and the type and quantity of domestic equipment at home17. The ethnic morphological subgroup
classification was based on phenotype pigmentation of the abdomen, hair color, type and conformation of the nose and lips, and family history, as determined and agreed upon by two examining physicians. Even though in the Brazilian population morphological criteria are not strongly consistent with ancestry, this classification has been validated and previously used in other studies18,19.
Statistical analysis
Statistical analysis was carried out using the SPSS 18.0 statistical package (Chicago, IL, USA). Data were described as means ± standard deviation for continuous variables. Proportions were used to express dichotomous variables. Goodness to fit to normal distribution was evaluated using the Kolmogorov–Smirnov test. Student t-test or analyses of variance (with Tukey post hoc test) were used to assess differences between two or more than two means, respectively. Pearson correlation coefficients were obtained for anthropometric, biological and metabolic variables and SUA levels. Multivariate Linear Stepwise Regression and the Univariate General Linear Models were used to adjust for confounding variables. BMI and triglycerides were analyzed after log transformation. The predictability of SUA to identify MS was identified by ROC curve analyses20. Differences
of the areas under the ROC curve were compared using a method previously described21. Optimal cutoff points
were registered as the measures representing the largest concomitant sensitivity and specificity22.
A healthy sub sample of 294 individuals with blood pressure <140/90 mmHg, serum creatinine <1.2 mg/dL, triglycerides <150 mg/dL, cholesterol <200 mg/dL, glucose <100 mg/dL and BMI <27.5 Kg/m2, was used to generate
cut-off points to define hyperuricemia (SUA concentration
≥95th percentile of the normal distribution curve). The 95%
SUA values were 6.8 mg/dL (in men) and 5.4 mg/dL (in women). Then, the total sample was divided into quartiles (Q) of SUA as follows: Men: 1st Q (<4.5 mg/dL), 2nd Q
(4.5-5.19 mg/dL), 3rd Q (5.2-6.1 mg/dL) and 4th Q (>6.1 mg/dL);
Women: 1st Q (<3.2 mg/dL), 2nd Q (3.2-3.89 mg/dL), 3rd Q
(3.9-4.7 mg/dL) and 4th Q (>4.7 mg/dL).
Logistic regression procedures were used to examine the risk of having metabolic syndrome. Univariate and multiple variable logistic regression procedures were employed to calculate odds ratios (OR) of SUA associated with MS. Confidence intervals were also reported for each OR. Covariates included in the model were age, smoking status and physical activity. Statistical significance was set at P
Results
Using the internally derived cut off points for high SUA levels (6.8 mg/dL for men and 5.4 mg/dL for women), the overall prevalence of hyperuricemia was 13.2% (IC95% 11.4-15.0%), higher in men (16.0%-IC95% 14.0%-18.0%) than in women (10.7%-IC95% 9.0%-12.0%). SUA was similar among social class and race-ethnicity groups (34% white, 50% mulatto and 8.3% black), in active and sedentary individuals (despite the high prevalence of sedentary individuals, around 75%), and in smokers and non smokers, regardless of gender. However, the association of SUA with BMI status after adjustments for age and systolic blood pressure was gender specific: in men, SUA was higher in overweight and obesity individuals when compared to the normal weight group (but without difference between the overweight-obese categories), whereas in women, significantly higher SUA was positively associated with increasing BMI groups (table 1).
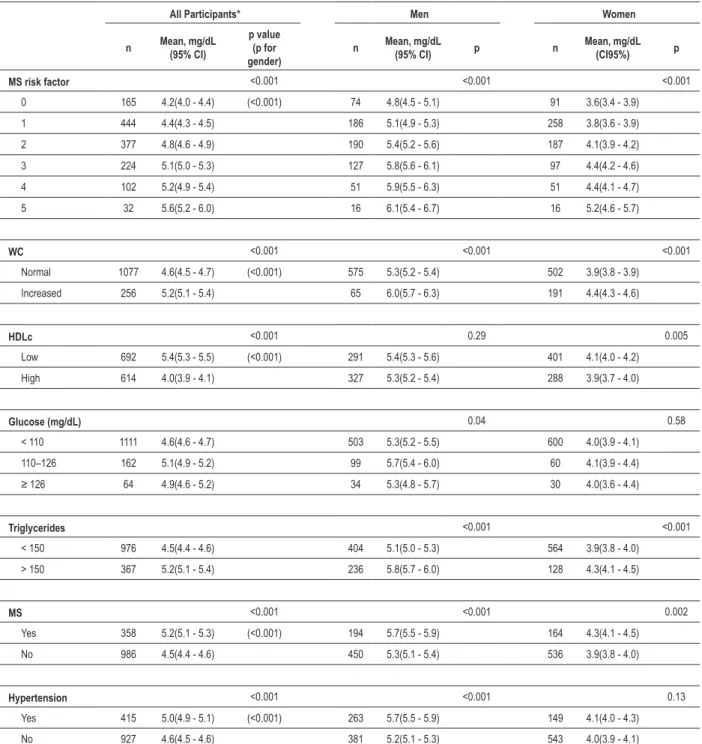
SUA was significantly higher in men (p in parentheses, table 2) as compared to women. In all participants, after gender adjustment, SUA was significantly associated with increasing number of MS components, abdominal obesity, low HDLc, impaired fasting glucose, high triglycerides, and the presence of MS and hypertension. However, stratification of individuals according to gender revealed that the pattern of SUA association with low HDLc, impaired fasting glucose and the presence of hypertension was gender-specific: in men exclusively, the relationship of SUA with low HDLc was not independent, but, mediated by BMI, whereas in women, the association of impaired fasting glucose and hypertension with SUA was mediated by BMI, that is, fasting glucose and hypertension were not independently associated with SUA. Conversely, MS was significantly associated with higher SUA in both genders, even after adjustments for age and BMI showing an independent association with SUA (table 2).
Women with hyperuricemia, as compared to those without this condition, showed higher increment in the prevalence of hypertension (almost 2 fold compared to 1.52 fold in men) and MS (2.2 fold compared to 1.6 fold in men). As opposed to men, who did not show any difference in the prevalence of DM, women with hyperuricemia presented almost 3 fold higher prevalence of DM.
Table 3 summarizes Pearson’s correlation coefficients between SUA and CV risk factors, stratified by gender. All variables correlated significantly with SUA, except glucose in both gender and age in men. It is noteworthy that waist circumference in both gender and triglycerides in men presented the strongest correlations with SUA. There was a positive association of SUA with increasing number of MS components, adjusted for age. Mean SUA increased in men and women, respectively, from 4.8±1.2 mg/dL and 3.6±0.8 mg/dL in individuals with no component of the MS to 5.8±1.4 mg/dL and 4.4±1.0 mg/dL in individuals with three components and to 6.1±1.4 mg/dL and 5.2±1.3 mg/ dL in those with the full spectrum of the syndrome (table 1). The relationship between SUA and MS is also illustrated by the fact that MS prevalence ratio in individuals with and without hyperuricemia were 1.88 (IC95% 1.32–2.65) and 2.71 (IC95% 1.78–4.12) for men and women, respectively.
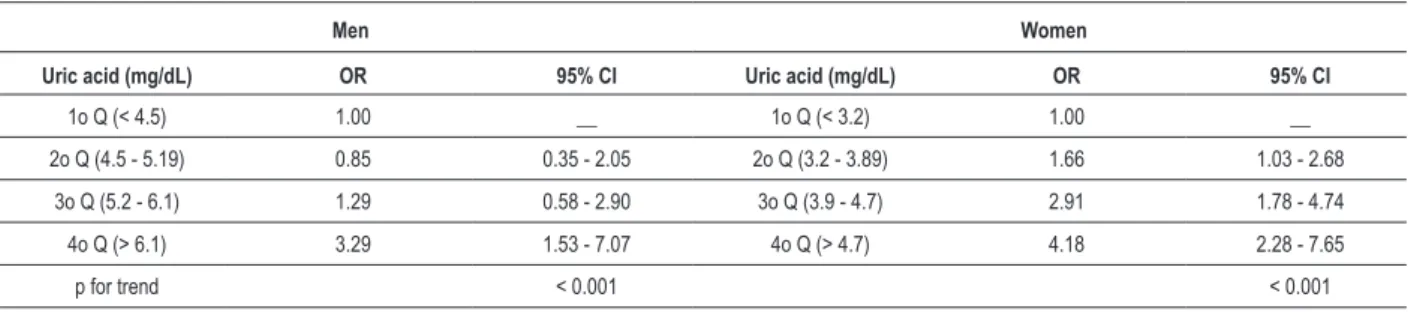
In addition, figure 1 shows the successive increase in the prevalence of MS across quartiles of SUA. We can notice a smooth increase of MS prevalence along SUA quartiles in women, but the same seems not to occur in men. Furthermore, we investigated the relative risk of MS, according to the quartiles of SUA adjusted for age, smoking status and physical activity in men and women, respectively. The results are shown in table 4. Compared to the first quartile, men and women in the highest SUA quartile had a 3.29 fold and 4.18 fold increase of MS risk, respectively. It is worth to note the linear component in risk of having MS in relation to increased SUA concentrations, regardless of genders.
We further explored the association of SUA and MS in individuals with normal blood pressure (BP <130/85 mmHg), stratified by gender. Figure 2 shows that in these 723 normotensive individuals stratified by gender, after adjustments for age and BMI, SUA was significantly higher only in men with MS, as compared to the counterpart without the syndrome.
Factors associated with increased SUA were investigated by multivariate stepwise regression analysis, stratified by gender. In men, triglycerides (ß= 0.23, p<0.001), waist circumference (ß= 0.21, p<0.001) and systolic blood pressure (ß= 0.11, p=0.004) explained 11%, 4% and 1% of the SUA variability, respectively. In women, waist circumference (ß= 0.26, p<0.001) and triglycerides (ß= 0.09, p=0.02) explained 9% and 1% of the SUA variability, respectively. Age was excluded from the model in both genders. Indeed, the prevalence of hyperuricemia did not change in relation to age categories. However, in women but not in men, SUA was significantly higher above the age of 54 (25-54 years: 5.22±1.14 mg/dL and 3.92±1.19 mg/dL; 55-65 years: 5.45±1.37 mg/dl and 4.36±1.11 mg/dl, in men and women, respectively). Table 5 shows the areas under the ROC curves (AURC) and the optimal cut-off points (according to the highest sensitivity and specificity) of SUA associated with MS. The best cut offs were 5.3 mg/dL for men and 4.0 mg/dL for women, that are roughly in the 75th percentile of the SUA distribution curve of
the normal healthy sub sample.
Discussion
We observed significantly positive associations of SUA with the risk factors investigated and the higher prevalence of MS and hypertension in hyperuricemic individuals, mainly in women. It is worth to note the increased prevalence (almost three fold high) of diabetes mellitus exclusively in women with hyperuricemia, as compared to those with normal SUA levels. More importantly, was the detection of increased SUA exclusively, in normotensive men with MS, which was independent of age and BMI, and
diverse from women, that presented BMI as the mediator of SUA (figure 2).
Analyses of the whole sample showed that triglycerides in men and waist circumference (surrogate measure for visceral fat) in both genders were identified as the main factors associated with hyperuricemia. Accordingly, it has been reported that hypertriglyceridemia is the major abnormality of MS and there is evidence that the association between SUA concentration and insulin resistance may
Figure 1 – Prevalence of metabolic syndrome and quartiles of serum uric acid by gender.
Figure 2 – Serum uric acid levels in normotensive individuals (PA < 130/85mmHg) with and without metabolic syndrome stratiied by gender. Data are shown as Mean ± SD.
p < 0.001
be mediated by increased triglyceride23. Even though the
mechanism by which excess body fat leads to increased SUA is still not totally elucidated, in addition to the increase in endogenous production of urate, evidence shows that accumulated visceral fat leads to an increase in free fatty acids and tumor necrosis factor alpha (TNF-α), together with a decrease in adiponectin concentration, which leads in turn to reduced renal excretion of uric acid24.
Overall, the prevalence of hyperuricemia was 13.2%. It is worth to mention that we investigated individuals not in use of drugs that interfere with uric acid metabolism and without apparent renal failure. Moreover, the cut-off ratio was defined internally (healthy sub-sample) as the sex-specific 95th percentile (6.8 mg/dL and 5.4 mg/dL for men
and women, respectively) which is 0.2 mg/dL and 0.6 mg/ dL lower in men and women respectively, was compared to the cut-offs in use25.
We found that SUA increased with the number of MS components, even when adjusted for age, and that the odds ratio for MS increased across quartiles of SUA, regardless of gender. Besides, we found 5.3 mg/dL in men and 4.0 mg/dL in women as the best cut-off points of SUA associated with MS by ROC curve analysis with sensibilities and specificities around 62%.
In general, our data agree with several cross-sectional studies from different populations that established an association between SUA and MS2,26, and with a Brazilian
study that included 352 white male individuals from high
Table1 - Serum uric acid in relation to demographic and anthropometric characteristics, by gender
Men = 645 Women = 701
p for gender
n (prevalence) Mean±SD Median (95%CI) n (prevalence) Mean±SD Median±95%CI
Physical
activity
No 462 (73) 5.43 ± 1.41 5.20(5.30 - 5.56) 533 (76.9) 4.00 ± 1.10 3.90(3.90 - 4.09) <0.001
Yes 170 (27) 5.25 ± 1.25 5.15(5.06 - 5.44) 160 (23.1) 3.97 ± 1.07 3.90(3.79 - 4.14) <0.001
p 0.13 0.74
Ethnicity
White 220 (34.1) 5.40 ± 1.43 5.30(5.21 - 5.59) 239 (34) 3.88 ± 1.05 3.80(3.75 - 4.02) <0.001
Black 59 (9.3) 5.15 ± 1.26 5.10(4.81 - 5.49) 53 (7.5) 4.21 ± 1.32 4.00(3.84 - 4.57) <0.001
Mulatto 327 (50.6) 5.41 ± 1.79 5.20(5.30 - 5.60) 348 (49.6) 4.03 ± 1.08 3.90(3.91 - 4.14) <0.001
p 0.50 0.20
Social class
A 65 (10) 5.37 ± 1.13 5.45(5.07 - 5.66) 74 (11.6) 3.84 ± 1.02 3.70(3.59 - 4.10) <0.001
B 173 (26.8) 5.34 ± 1.35 5.20(5.13 - 5.55) 193 (27.5) 3.98 ± 1.08 3.90(3.82 - 4.14) <0.001
C 198 (30.7) 5.42 ± 1.38 5.20(5.22 - 5.62) 220 (31.4) 4.00 ± 1.14 3.85(3.84 - 4.16) <0.001
D+E 208 (32.2) 5.43 ± 1.43 5.20(5.23 - 5.63) 213 (30.4) 4.03 ± 1.08 4.00(3.88 - 4.19) <0.001
p 0.71 0.19
Smoking status
Yes 177 (27.5) 5.48 ± 1.27 5.20(5.29 - 5.68) 144 (20.5) 4.15 ± 1.11 3.95(3.96 - 4.34) <0.001
No 467 (72.5) 5.37 ± 1.40 5.20(5.23 - 5.50) 556 (79.5) 3.95 ± 1.09 3.90(3.85 - 4.04) <0.001
p 0.25 0.08
BMI
< 25 287 (45.5) 5.07 ± 1.20 5.0(4.91 - 5.22) 357 (53.1) 3.76 ± 1.02 3.51(3.65 - 3.87) <0.001
25-29.9 256 (40.6) 5.67 ± 1.31a 5.4(5.51 - 5.83) 207 (30.2) 4.08 ± 1.06a 3.95(3.94 - 4.23) <0.001
≥ 30 87 (13.8) 5.64 ± 1.33a 4.4(5.35 - 5.92) 121 (17.6) 4.55 ± 1.07a.b 4.35(4.36 - 4.74) <0.001
p < 0.001 < 0.001
Data presented as means ±SD, Median (IC95%). BMI - body mass index. p value under each variable represents difference among categories. P in the last column represents sex differences (p for gender). Serum uric acid in relation to BMI subgroups was analyzed after adjustments for age and mean systolic blood
Table 2 – Gender related characteristics associated with serum uric acid levels
All Participants* Men Women
n Mean, mg/dL(95% CI)
p value
(p for gender)
n Mean, mg/dL(95% CI) p n Mean, mg/dL(CI95%) p
MS risk factor <0.001 <0.001 <0.001
0 165 4.2(4.0 - 4.4) (<0.001) 74 4.8(4.5 - 5.1) 91 3.6(3.4 - 3.9)
1 444 4.4(4.3 - 4.5) 186 5.1(4.9 - 5.3) 258 3.8(3.6 - 3.9)
2 377 4.8(4.6 - 4.9) 190 5.4(5.2 - 5.6) 187 4.1(3.9 - 4.2)
3 224 5.1(5.0 - 5.3) 127 5.8(5.6 - 6.1) 97 4.4(4.2 - 4.6)
4 102 5.2(4.9 - 5.4) 51 5.9(5.5 - 6.3) 51 4.4(4.1 - 4.7)
5 32 5.6(5.2 - 6.0) 16 6.1(5.4 - 6.7) 16 5.2(4.6 - 5.7)
WC <0.001 <0.001 <0.001
Normal 1077 4.6(4.5 - 4.7) (<0.001) 575 5.3(5.2 - 5.4) 502 3.9(3.8 - 3.9)
Increased 256 5.2(5.1 - 5.4) 65 6.0(5.7 - 6.3) 191 4.4(4.3 - 4.6)
HDLc <0.001 0.29 0.005
Low 692 5.4(5.3 - 5.5) (<0.001) 291 5.4(5.3 - 5.6) 401 4.1(4.0 - 4.2)
High 614 4.0(3.9 - 4.1) 327 5.3(5.2 - 5.4) 288 3.9(3.7 - 4.0)
Glucose (mg/dL) 0.04 0.58
< 110 1111 4.6(4.6 - 4.7) 503 5.3(5.2 - 5.5) 600 4.0(3.9 - 4.1)
110–126 162 5.1(4.9 - 5.2) 99 5.7(5.4 - 6.0) 60 4.1(3.9 - 4.4)
≥ 126 64 4.9(4.6 - 5.2) 34 5.3(4.8 - 5.7) 30 4.0(3.6 - 4.4)
Triglycerides <0.001 <0.001
< 150 976 4.5(4.4 - 4.6) 404 5.1(5.0 - 5.3) 564 3.9(3.8 - 4.0)
> 150 367 5.2(5.1 - 5.4) 236 5.8(5.7 - 6.0) 128 4.3(4.1 - 4.5)
MS <0.001 <0.001 0.002
Yes 358 5.2(5.1 - 5.3) (<0.001) 194 5.7(5.5 - 5.9) 164 4.3(4.1 - 4.5)
No 986 4.5(4.4 - 4.6) 450 5.3(5.1 - 5.4) 536 3.9(3.8 - 4.0)
Hypertension <0.001 <0.001 0.13
Yes 415 5.0(4.9 - 5.1) (<0.001) 263 5.7(5.5 - 5.9) 149 4.1(4.0 - 4.3)
No 927 4.6(4.5 - 4.6) 381 5.2(5.1 - 5.3) 543 4.0(3.9 - 4.1)
Data are shown as mean ± SD and 95%CI. MS - metabolic syndrome; WS - waist circumference; HDLc - high density lipoprotein cholesterol. * All participants had the variables analyzed by 2-way ANOVA with gender as a second factor and P value for gender factor given in parentheses.
social class27 and an observational study that evaluated 756
individuals (369 men) from a convenience sample12.
Taken together, our study suggests that depending on gender, hyperuricemia might be a component of the clinical picture of MS or possibly, an independent risk factor. Despite the presence of generally lower concentration of SUA in women, when compared to men, the female gender showed a more pronounced
Table 5 - Areas under the ROC curves (AURC), cut-offs, sensitivity and speciicity of serum uric acid levels in relation to the ability to identify
Metabolic Syndrome
AURC 95% CI Cut off Sensitivity Speciicity
Men
SUA 0.652 0.606 - 0.699 5.3 0.64 0.61
Women
SUA 0.665 0.618 - 0.712 4.0 0.61 0.62
SUA - serum uric acid; AURC - Areas under the ROC curves.
Table 3 – Pearson’s correlation coeficients between serum uric acid
and risk factors, by gender
Men (n = 645) Women (n = 701)
r p r p
Age 0.06 0.14 0.1 <0.001
BMI 0.26 <0.001 0.3 <0.001
WC 0.31 <0.001 0.31 <0.001
SBP 0.2 <0.001 0.16 <0.001
DBP 0.2 <0.001 0.15 <0.001
HDL -0.09 0.03 -0.13 <0.001
Trig 0.33 <0.001 0.2 <0.001
Glucose 0.01 0.73 0.06 0.09
BMI - body mass index; WC - waist circumference; SBP - systolic blood pressure; DBP - diastolic blood pressure; HDL - high density lipoprotein; Trig - triglycerides.
Table 4 - Odds ratio (OR) and 95% conidence interval for risk of metabolic syndrome according to quartiles of uric acid stratiied by gender,
adjusted for age, smoking status and physical activity
Men Women
Uric acid (mg/dL) OR 95% CI Uric acid (mg/dL) OR 95% CI
1o Q (< 4.5) 1.00 __ 1o Q (< 3.2) 1.00 __
2o Q (4.5 - 5.19) 0.85 0.35 - 2.05 2o Q (3.2 - 3.89) 1.66 1.03 - 2.68
3o Q (5.2 - 6.1) 1.29 0.58 - 2.90 3o Q (3.9 - 4.7) 2.91 1.78 - 4.74
4o Q (> 6.1) 3.29 1.53 - 7.07 4o Q (> 4.7) 4.18 2.28 - 7.65
p for trend < 0.001 < 0.001
Q - refers to quartiles.
Hyperuricemia can result from either increased uric acid synthesis or decreased uric acid excretion, or from a combination of both. Diminished uric acid excretion is reported in patients with MS28 and appears
to reflect impaired renal uric acid excretion secondary to enhanced proximal tubular sodium reabsortion mediated by hyperinsulinemia29. Hypertension in turn, has been
reported to mediate the direct relationship between MS and increased SUA levels30.Indeed, we identified blood
pressure higher than 130/85mmHg in roughly 85% of individuals with MS. Thus, blood pressure increase clearly represents the main risk factor associated with MS in our population. Chronic inflammation and endothelial dysfunction, as observed in patients with increased SUA, are likely to have participation in the mechanisms through which this substance may affect renal structure and operation31 leading to the genesis of hypertension mainly
in young individuals32. Conversely, it has been questioned
if uric acid is a substance that is increased by the organism to counteract the increased oxidative stress associated with insulin resistance, inflammation, and other risk factors that usually cluster with increased SUA concentrations33thus,
representing only a defense mechanism.
The interpretation of this investigation has some limitations. Firstly, data were restricted to a cross-sectional study in a population with 36% whites, 53% mulattos and 9% blacks and should be generalized to other populations with caution. Secondly, no serum insulin levels were measured as an index for insulin resistance. As insulin resistance is believed to play a major role in the metabolic syndrome, the inclusion of this variable in our statistical analysis would have been important. Thirdly, information on alcohol intake was not available. However, as mentioned before, we did not find differences in SUA stratified by gender regarding smoking status, social class or race-ethnicity (as others have found higher SUA in male black individuals, partially related to alcohol ingestion)34, which
not seem to impact SUA in our sample. Another possible weakness of our study is, as expected, the small number of normotensive drug-free individuals with the diagnosis of MS. However, we further explored 723 individuals with blood pressure <130/85mmHg and found out that there was a graded increase in SUA in relation to the number of concurrent MS components in both genders. Our findings agree with data recently reported in which it was found that around 73% of hiperuricemic individuals had more than
one MS component35.Moreover, we found that men and
women with SUA levels above 6.1 mg/dL and 4.7 mg/dL, had 3 and 4 times higher risk, respectively, of having MS.
Therefore, since hyperuricemia is potentially a modifiable factor, measuring SUA that is cheap and easily available, might provide a cost-beneficial investigation allowing the identification of individuals with increased SUA, which in turn, may benefit to have a full work up for the risk factors associated with MS. It is worth to note that regarding normotensive individuals, the detection of high SUA might be an alert and a warning to increment preventive measures to avoid hypertension. Even though our study does not allow to establish causal relationships, under the light of the latest evidences7,8 our data may
suggest a possible role of increased SUA in cardiovascular
physiopathology. Strategies to improve people’s awareness about the necessity to urgently modify eating habits and to avoid sedentary lifestyle are necessary, mainly focusing on the pursuit of “healthy” and properly individualized waist line measurements36,37.
Acknowledgements
This work was supported with grants from CNPq and FAPES (PRONEX, n. 35884886).
Potential Conflict of Interest
No potential conflict of interest relevant to this article was reported.
Sources of Funding
This study was funded by CNPq and FAPES.
Study Association
This study is not associated with any post-graduation program.
References
1. Cannon PJ, Stason WB, Demartini FE, Sommers SC, Laragh JH. Hyperuricemia in primary and renal hypertension. N Engl J Med. 1966;275(9):457-64.
2. Onat A, Uyarel H, Hergenc G, Karabulut A, Albayrak S, Sari I, et al. Serum uric acid is a determinant of metabolic syndrome in a population-based study. Am J Hypertens. 2006;19(10):1055-62.
3. Tuttle KR, Short RA, Johnson RJ. Sex differences in uric acid and risk factors for coronary artery disease. Am J Cardiol. 2001;87(12):1411-4.
4. Lehto S, Niskanen L, Rönnemaa T, Laakso M. Serum uric acid is a strong predictor of stroke in patients with non-insulin-dependent diabetes mellitus. Stroke. 1998;29(3):635-9.
5. Burnier M, Brunner HR. Is hyperuricemia a predictor of cardiovascular risk? Curr Opin Nephrol Hypertens. 1999,8:167-72.
6. Duffy WB, Sennekjian HO, Knight TF, Weinman EJ. Management of asymptomatic hyperuricemia. JAMA. 1981;246(19):2215-6.
7. Brodov Y, Chouraqui P, Goldenberg I, BoykoV, Mandelzweig L, Behar S. Serum uric acid for risk stratification of patients with coronary artery disease. Cardiology. 2009;114(4):300-5.
8. Wiik BP, Larstorp AC, Høieggen A, Kjeldsen SE, Olsen MH, Ibsen H, et al. Serum uric acid is associated with new-onset diabetes in hypertensive patients with left ventricular hypertrophy: The LIFE Study. Am J Hypertens. 2010;23(8):845-51.
9. Marquezine GF, Oliveira CM, Pereira AC, Krieger JE, Mill JG. Metabolic syndrome determinants in an urban population from Brazil: social class and gender-specific interaction. Int J Cardiol. 2008;129(2):259-65.
10. Schmidt MI, Duncan BB, Watson RL, Sharrett AE, Brancati FL, Heiss G. A metabolic syndrome in whites and African-Americans. The atherosclerosis risk in communities’ baselines study. Diabetes Care. 1996;19(5):414-8.
11. Yoo TW, Sung KC, Shin HS, Kim BJ, Kim BS, Kang JH, et al: Relationship between serum uric acid concentration and insulin resistance and metabolic syndrome. Circ J. 2005;69(8):928-33.
12. Barbosa MC, Brandão AA, Pozzan R, Magalhães ME, Campana EM, Fonseca FL, et al. Association between uric acid and cardiovascular risk variables in a non-hospitalized population. Arq Bras Cardiol. 2011;96(3):212-8.
13. Pereira AC, Mota GF, Cunha RS, Herbenhoff FL, Mill JG, Krieger JE. Angiotensinogen 235T allele ‘dosage’ is associated with blood pressure phenotypes. Hypertension. 2003;41(1):25-30.
14. Molina MC, Cunha RS, Herbenhoff FL, Mill JG. [Hypertension and salt intake in an urban population]. Rev Saude Publica. 2003;37(6):743-50.
15. The sixth report of the Joint National Committee on prevention, detection, evaluation, and treatment of high blood pressure. Arch Intern Med. 1997;157(21):2413-46.
16. Expert Panel on Detection, Evaluation, and Treatment of High Blood Cholesterol in Adults. Executive Summary of the Third Report of the National Cholesterol Education Program (NCEP) Expert Panel on Detection, Evaluation, and Treatment of High Blood Cholesterol in Adults (Adult Treatment Panel III). JAMA. 2001;285(19):2486-97.
17. Instituto Brasileiro de Geografia e Estatística (IBGE). Pesquisa Nacional por Amostra de Domicílios 2000: microdados. Rio de Janeiro: Fundação Instituto Brasileiro de Geografia e Estatística; 2001.
18. Krieger H, Morton NE, Mi MP, Azevedo E, Freire-Maia A, Yasuda N. Racial admixture in north-eastern Brazil. Ann Hum Genet. 1965;29(2):113-25.
19. Carvalho-Silva DR, Santos FR, Rocha J, Pena SD. The phylogeography of Brazilian Y-chromosome lineages. Am J Hum Genet. 2001;68(1):281-6.
20. Hanley JA, McNeil BJ. The meaning and use of the area under a receiver operating characteristic curve. Radiology. 1982;143(1):29-36.
21. Metz CE. Basic principles of ROC analysis. Semin Nucl Med. 1978;8(4):283-98.
23. Giacomello A, Di Sciascio N, Quaratino CP. Relation between serum triglyceride level, serum urate concentration, and fractional urate excretion. Metabolism. 1997;46(9):1085-9.
24. Choi HK, Mount DB, Reginato AM. Pathogenesis of gout. Ann Intern Med. 2005;143(7):499-516.
25. Fang J, Alderman MH. Serum uric acid and cardiovascular mortality. The NHANES I epidemiologic follow-up study, 1971–1992. National Health and Nutrition Examination Survey. JAMA. 2000,283(18):2404-10.
26. Choi HK, Ford ES. Prevalence of the metabolic syndrome in individuals with hyperuricemia. Am J Med. 2007;120(5):442-7.
27. Desai MY, Santos RD, Dalal D, Carvalho JA, Martin DR, Flynn JA, et al. Relation of serum uric acid with metabolic risk factors in asymptomatic middle-aged Brazilian men. Am J Cardiol. 2005;95(7):865-8.
28. López-Suárez A, Elvira-Gonzalez J, Bascunana-Quirell A, Rosal-Obrador J, Michán-Doña A, Escribano-Serrano J, et al. [Serum urate levels and urinary uric acid excretion in subjects with metabolic syndrome]. Med Clin (Barc). 2006;126(9):321-4.
29. Strazzullo P, Barbato A, Galletti F, Barba G, Siani A, Iacone R, et al. Abnormalities of renal sodium handling in the metabolic syndrome: results of the Olivetti Heart Study. J Hypertens. 2006;24(8):1633-9.
30. Lin KC, Tsao HM, Chen CH, Chou P. Hypertension was the major risk factor leading to development of cardiovascular diseases among men with hyperuricemia. J Rheumatol. 2004;31(6):1152-8.
31. Zoccali C, Maio R, Mallamaci F, Sesti G, Perticone F. Uric acid and endothelial dysfunction in essential hypertension. J Am Soc Nephrol. 2006;17(5):1466-71.
32. Feig DI, Johnson RJ. Hyperuricemia in childhood primary hypertension. Hypertension. 2003;42(3):247-52.
33. Nieto FJ, Iribarren C, Gross MD, Cosmotock GW, Cutler RG. Uric acid and serum antioxidant capacity: a reaction to atherosclerosis? Atherosclerosis. 2000;148(1):131-9.
34. Conen D, Wietlisbach V, Bovet P, Shamlaye C, Riesen W, Paccaud F, et al. Prevalence of hyperuricemia and relation of serum uric acid with cardiovascular risk factors in a developing country. BMC Public Health. 2004 Mar 25;4:9.
35. Tsouli SG, Liberopoulos EN, Mikhailidis DP, Athyros VG, Elisaf MS. E l e v a t e d s e r u m u r i c a c i d l e v e l s i n m e t a b o l i c s yn d r o m e : an active component or an innocent bystander? Metabolism. 2006;55(10):1293-301.
36. Rodrigues SL, Baldo MP, Sá Cunha R, Angelo LC, Pereira AC, Krieger JE, et al. Anthropometric measures of increased central and overall adiposity in association with echocardiographic left ventricular hypertrophy. Hypertens Res. 2010;33(1):83-7.