Licence Creative Commom
CC BY
¹ Universidade Federal de Viçosa. Departamento de Educação Física. Viçosa, MG. Brasil
² Universidade Federal de Viçosa. Departamento de Educação Física. Florestal, MG. Brasil
³ Universidade Federal de Viçosa. Departamento de Medicina e Enfermagem. Viçosa, MG. Brasil
4 Universidade Federal de Minas Gerais. Escola de Educação Física, Fisioterapia e Terapia Ocupacional. Belo Horizonte, MG. Brasil
Received: 10 August 2015 Accepted: 17 November 2015
Prevalence of obesity and association of
body mass index with risk factors in public
school teachers
Prevalência de obesidade e associação do índice de massa
corporal com fatores de risco em professores da rede pública
Renata Aparecida Rodrigues de Oliveira¹ Rômulo José Mota Júnior¹
Debora Dornelas Ferreira Tavares¹ Osvaldo Costa Moreira²
Luciana Moreira Lima³
Paulo Roberto dos Santos Amorim¹ Raquel Rodrigues Britto4
João Carlos Bouzas Marins1
Abstract – he objective of this study was to determine the prevalence of overweight and obesity and the association of body mass index (BMI) with cardiovascular risk factors in public school teachers. A cross-sectional study was conducted on 200 basic education teachers from Viçosa, MG. We assessed BMI, waist circumference (WC), waist-hip ratio (WHR), body fat percentage (%BF), systolic and diastolic blood pressure, fasting glucose, total cholesterol, high-density and low-density lipoprotein (LDL-C), triglycerides, and number of daily steps. Linear regression was used to evaluate the associations between BMI (independent variable) and the other variables (dependent variable). Overweight was observed in 58% of the teachers and obesity in 20%. Among women, all risk factors difered signiicantly between the group with overweight and/or obesity and the group classiied as normal BMI, except for total cholesterol and LDL-C. Linear regression analysis showed a positive association between BMI and the other anthropometric measurements, blood pressure, and biochemical parameters; however, ater adjustment for age, an associa-tion was only observed with the anthropometric variables (WC, WHR, and %BF). he prevalence of overweight/obesity was high among the basic education teachers studied. he overall obesity indicator (BMI) was not associated with cardiovascular risk factors when adjusted for age.
Key words: Body mass index; Obesity; Risk factors; Teachers.
INTRODUCTION
he transformations taking place in the behavioral patterns of the popu-lation as a result of a diet rich in calories and reduced level of physical activity have contributed to the increase in overweight and obesity in the world population1. In Brazil, the prevalence of excess weight has shown
an accelerated increase over the last three decades from 18.5% to 50.1% in men and from 28.7% to 48% in women2. hese rates have a major impact
on the population because of the numerous health consequences of this weight increase.
he main characteristic of obesity is excess adipose tissue in the indi-vidual. his tissue is an endocrine and paracrine organ that releases a large number of cytokines and bioactive mediators involved in inlammation, coagulation, ibrinolysis, insulin resistance, diabetes, and some types of cancer3. Furthermore, excess weight is associated with central obesity, a
condition that is related to a higher risk of atherosclerotic disease4 since
visceral adipose tissue is metabolically more active than subcutaneous adipose tissue5.
Since overweight/obesity is generally related to a condition of physical inactivity, it is interesting to note that in certain populations in which the work activity implies low energy expenditure, the percentage of individuals with excess weight is usually higher than the prevalence expected for the general population. Examples are studies involving truck6 and bus7 drivers,
which found prevalences ranging from 50 to 73%.
With respect to the speciic population of schoolteachers, the typical sedentary behavior of the teaching profession may contribute to this condi-tion and, consequently, to the occurrence of associated diseases as observed in a study on university teachers that demonstrated a high prevalence of excess weight8. However, since studies involving basic education
teach-ers are sparse and overweight/obesity can also be inluenced by certain conditions, it would be interesting to determine how overweight/obesity manifests in diferent groups of teachers.
herefore, the objective of the present study was to evaluate the preva-lence of overweight and obesity, as well as the association of body mass index (BMI) with cardiovascular risk factors, in public school teachers from Viçosa, Minas Gerais, Brazil.
METHODOLOGICAL PROCEDURES
Sample
he sample size was calculated using the equation proposed by Lwanga and Lemeshow9: n = P x Q / (E/1.96)², where n is the minimum sample
size necessary; P is the prevalence of the disease in the population, which was estimated at 15% according to the mean percentage of diferent car-diovascular risk factors in the population of Belo Horizonte, MG10; Q =
100 – P, and E is the tolerated margin of sampling error, which was 5%. he estimated number of teachers necessary for the study was 196. his number corresponds to 27% of the state and municipal teacher population, which consisted of 728 teachers.
he study was approved by the Ethics Committee on Research Involv-ing Humans of Universidade Federal de Viçosa (Permit No. 070/2012/ CEPH) and was conducted according to Resolution 466/12 of the National Health Council. Ater approval of the study, the schools were visited to clarify the objectives and procedures of the study to the teachers and principals. All teachers of the schools could participate in the study as long as they met the following inclusion criteria: at least 3 years of teach-ing activity, no medical leave, and no previously diagnosed organic and/or medical condition that would prevent participation in the study. Next, an individual appointment was scheduled with each teacher for the measure-ment of the anthropometric variables and blood pressure by two trained examiners in a private room of the school. Prior to the measurements, the subjects provided personal data and signed the free informed consent form.
Variables
Height was measured with a portable stadiometer (Cardiomed, WCS®, Bra-zil) to the nearest 1 mm. he subjects were standing barefoot with the back to the measurement tape, with the arms hanging loose at the sides. Body weight was measured with a portable balance (model Acqua SIM09190, Plenna®, Brazil) to the nearest 100 g, with the subject wearing light cloth-ing and no shoes. he BMI was calculated [BMI = body weight (kg)/height (m)²] and classiied as recommended by the World Health Organization11.
A millimeter-graded inelastic tape measure (model SN4010, Sanny Medical®, Brazil) was used for the measurement of circumferences. For waist circumference (WC), the tape was placed at the smallest curvature between the last rib and iliac crest. Hip circumference was measured at the greatest protuberance of the buttocks. he waist-hip ratio (WHR) was determined by dividing WC by hip circumference. he criteria of Lean et al.12 were used for the classiication of WC.
he percentage of body fat (%BF) was estimated based on skinfolds ac-cording to the protocols of Jackson and Pollock13 and Jackson et al.14. hree
skinfolds (men: chest, abdomen and thigh; women: triceps, suprailiac and thigh) were measured with a skinfold caliper (Top Tec, Cescorf®, Brazil). hree alternate measurements were obtained and the mean of these meas-urements was considered for analysis. Body density (BD) was converted into %BF using the formula of Siri15: (%BF = [(4.95 / BD) – 4.50] x 100).
using the Avaesporte® sotware (Esporte Sistemas, Minas Gerais, Brazil). For the evaluation of systolic (SBP) and diastolic blood pressure (DBP), the subject rested in the sitting position for 5 minutes. Blood pressure was measured with a properly calibrated aneroid sphygmomanometer (model ESFHS501, Premium®, Wenzhou, China), precision of 3 mmHg, equipped with a standard adult-size cuf. One measurement was obtained; however, if the blood pressure was altered, two additional measurements were per-formed to conirm the result.
At the end of the evaluation, the subjects received a Digi-Walker® pedometer (model CW-700, Yamax Corporation, Tokyo, Japan) to record the mean number of daily steps for 6 consecutive days. he device was used in the midline of the right thigh (positioned on the trouser waistband) according to manufacturer recommendations. he irst day of use of the device was discarded in order to avoid the Hawthorne efect, which refers to a change in behavior due to the use of the device. he subjects were asked to use the pedometer daily, removing it only for cycling, motorcycling, showering, aquatic activities, and sleeping. At the end of each day, the subjects were asked to record the number of steps on a chart. he mean step count of 5 consecutive days was determined and 10,000 steps were established as the cut-of to deine an individual as active16.
Venous blood samples were collected ater a 12-hour fast at the Labora-tory of Clinical Analyses, Health Division, Universidade Federal de Viçosa, between 7 and 9 am by trained professional. he following biochemical parameters were analyzed: glucose (glucose oxidase method), total choles-terol, high-density lipoprotein (HDL-C), and triglycerides. A Cobas Mira Plus (Roche Diagnostics, Montclair, NJ, USA) and Bioclin-Quibasa kits were used for the analyses. Low-density lipoprotein (LDL-C) was calculated using the equation of Friedewald17.
Statistical analysis
Ater data collection, the subjects were divided into three groups based on BMI according to the criteria of the World Health Organization12: normal
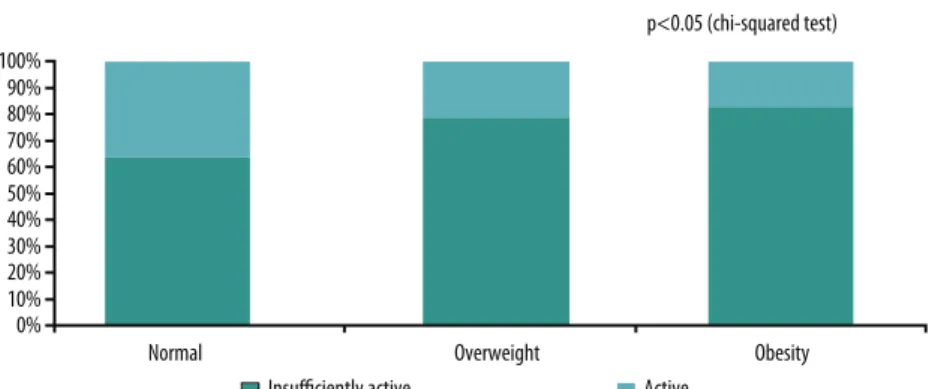
(BMI ≤ 24.99 kg/m²), overweight (BMI 25.0 to 29.99 kg/m²), and obese (BMI ≥ 30.0 kg/m²). he Kolmogorov-Smirnov test was used to verify the normality of all variables. WC, LDL-C and daily step count showed a normal distribution. Analysis of the data consisted of descriptive exploration of the variables and the calculation of the prevalence of overweight and obesity. One-way ANOVA with Tukey’s post hoc test was used for comparison of parametric variables between groups and the Kruskal-Wallis test with Dunn’s post hoc test for nonparametric data. For comparison between genders, the Student t-test was used for parametric data and the Mann-Whitney test for nonparametric data. he chi-squared test was applied to compare the percentage of overweight and obesity between genders and the level of physical activity between the normal, overweight and obese groups.
Loga-rithmic transformation (base 10) was performed for dependent variables that did not show a normal distribution. A level of signiicance of 5% was adopted for all tests. Statistical analysis was performed using the Sigma Stat 3.5 for Windows (San Jose, CA, USA) and SPSS 20.0 (Chicago, IL, USA) programs.
RESULTS
he sample consisted of 200 public school teachers (state and municipal) from Viçosa, MG, corresponding to 27% of the total population. he mean age of the participants was 43.2 ± 10.2 years. Only 26 (13%) teachers were males. his male distribution is similar to that seen in the basic education of Minas Gerais.
Excess weight (BMI ≥ 25 kg/m²) was observed in 58% of the teachers and 20% of them were obese (BMI ≥ 30 kg/m²). Among women, 37.4% were overweight and 21.3% were obese. hese percentages were 42.3% and 11.5% among men, respectively. However, the diference in percentage between genders was not signiicant (p=0.512).
With respect to abdominal obesity, 25.0% of the teachers had a “high” WC (men ≥ 94 cm and women ≥ 80 cm) and 23.0% were classiied as “very high” (men ≥ 102 cm and women ≥ 88 cm). When analyzed according to gender, the percentage of “high” and “very high” risk was 26.4% and 25.9% in women, respectively, and 15.4% and 3.8% in men.
Stratiication according to the presence of overweight/obesity and gen-der showed that, in women, all risk factors difered signiicantly between the overweight and obese groups and the group classiied as normal BMI, except for total cholesterol and LDL-C. In men, diferences between groups were only observed for WC, %BF and SBP (Table 1).
he number of daily steps tended to decrease with increasing BMI among women, but no signiicant diference was observed between the normal and overweight groups (Table 1). Furthermore, the number of active individuals was reduced and the number of insuiciently active individuals was increased among overweight and obese subjects (Figure 1).
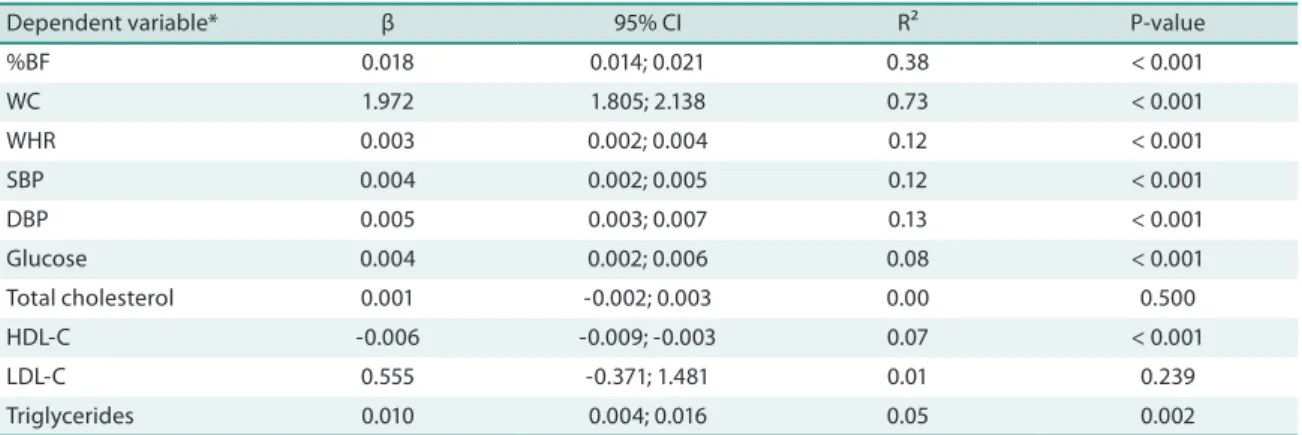
Linear regression analysis showed a positive association between the overall anthropometric indicator of obesity (BMI) and the other anthropo-metric variables (%BF, WC, and WHR). However, the highest association was observed with WC, with BMI variations explaining about 78% of the variation in this parameter. An association was also found with all car-diovascular risk factors, except for total cholesterol and LDL-C, although the explanatory power of the variables was low. he highest values were observed for the pressure variables (R² = 0.12 and 0.13) (Table 2).
Table 1. Characteristics of the sample studied according to the presence of overweight/obesity and gender (Viçosa, MG).
Variable
Normal (n=84)
Overweight (n=76)
Obesity (n=40) F (n=72) M (n=12) F (n=65) M (n=11) F (n=37) M (n=3) Age (years)† 40.0(18.0) 39.5(21.0) 46.0(12.3)* 32.0(16.8)§ 48.0(8.3)* 38.0(11.3)§ WC (cm)¥ 72.7±5.9 80.9±6.0§ 83.9±5.7* 90.2±7.7*§ 95.7±8.8*ǂ 99.3±0.8* WHR† 0.76(0.07) 0.86(0.07)§ 0.80(0.09)* 0.89(0.06)§ 0.81(0.11)* 0.99(0.09)§ %BF† 27.9(8.1) 19.4(7.9)§ 34.4(4.7)* 21.2(6.1)§ 40.2(2.3)*ǂ 27.6(1.7)*§ SBP (mmHg)† 110(10.0) 110(0.0) 110(20.0)* 120(21.3)*§ 120(10.0)* 120(0.0) DBP (mmHg)† 70(10.0) 70(12.5) 70(20.0) 80(7.5)§ 80.0(10.0)* 80(0.0) Glucose (mg/dL)† 83.0(9.5) 86.0(26.0) 85.0(13.3) 89.0(11.3) 91.0(13.8)*ǂ 82.0(16.5) TC (mg/dL)† 197.5(52.0) 159.5(32.5)§ 194.0(63.5) 173.0(53.3) 192.0(36.8) 173.0(27.0) HDL-C (mg/dL)† 58.0(20.6) 44.0(17.0)§ 55.0(20.3) 41.0(12.0)§ 48.0(12.0)*ǂ 38.0(5.3) LDL-C (mg/dL)¥ 118.1±32.5 90.6±21.9§ 116.5±31.9 114.4±37.2 120.3±26.8 111.3±1.5 Triglycerides (mg/dL)† 92.5(70.0) 81.0(70.5) 100.0(64.0) 112.0(120.8) 130.0(91.5)* 133.0(114.8) Steps per day¥ 8,299±3,125 10,511±4,174§ 7,596±3,016 7,764±3,343 6,161±3,141* 11,107±397§
* P<0.05 compared to the same gender with normal BMI; ǂ P<0.05 compared to the same gender with overweight; § P<0.05 compared to females.
† Data are reported as the median and interquartile range. Kruskal-Wallis test with Dunn’s post hoc test for comparison between groups (normal, overweight, and obesity). Mann-Whitney test for comparison between genders. ¥ Data are reported as the mean and standard deviation. One-way ANOVA
with Tukey’s post hoc test for comparison between groups (normal, overweight, and obesity). Student t-test for comparison between genders. F: female;
M: male; BMI: body mass index; WC: waist circumference; WHR: waist-hip ratio; %BF: body fat percentage; SBP: systolic blood pressure; DBP: diastolic blood pressure; TC: total cholesterol; HDL-C: high-density lipoprotein; LDL-C: low-density lipoprotein.
Table 2. Linear regression coeicient between body mass index and cardiovascular risk factor in public school teachers, Viçosa, MG (n=200).
Dependent variable* β 95% CI R² P-value %BF 0.018 0.014; 0.021 0.38 < 0.001 WC 1.972 1.805; 2.138 0.73 < 0.001 WHR 0.003 0.002; 0.004 0.12 < 0.001 SBP 0.004 0.002; 0.005 0.12 < 0.001 DBP 0.005 0.003; 0.007 0.13 < 0.001 Glucose 0.004 0.002; 0.006 0.08 < 0.001 Total cholesterol 0.001 -0.002; 0.003 0.00 0.500 HDL-C -0.006 -0.009; -0.003 0.07 < 0.001
LDL-C 0.555 -0.371; 1.481 0.01 0.239
Triglycerides 0.010 0.004; 0.016 0.05 0.002
95% CI: 95% conidence interval; %BF: body fat percentage; WC: waist circumference; WHR: waist-hip ratio; SBP: systolic blood pressure; DBP: diastolic blood pressure; HDL-C: high-density lipoprotein; LDL-C: low-density lipoprotein. * Log-transformed value (base 10).
Table 3. Linear regression coeicient between body mass index and cardiovascular risk factor adjusted for age in public school teachers, Viçosa, MG (n=200).
Dependent variable* β 95% CI R² P-value %BF 0.123 0.074; 0.172 0.42 < 0.001
WC 1.124 0.992; 1.255 0.78 <0.001
WHR -0.208 -0.335; -0.063 0.11 0.006
SPB 0.064 -0.078; 0.206 0.13 0.378
DBP 0.094 -0.023; 0.212 0.14 0.115
Glucose 0.041 -0.029; 0.112 0.08 0.249 Total cholesterol -0.063 -0.376; 0.249 0.00 0.689
HDL-C 0.009 -0.089; 0.106 0.07 0.860
LDL-C 0.019 -0.160; 0.198 0.01 0.832
Triglycerides -0.015 -0.065; 0.035 0.06 0.553
DISCUSSION
he present results revealed a high prevalence of overweight and obesity among the teachers studied, including a high percentage of central obesity. Furthermore, BMI was strongly associated with WC, but no association was observed for the remaining risk factors when adjusted for age.
he prevalence of overweight/obesity found was higher than that re-ported by the Ministry of Health18 for the city of Belo Horizonte, MG, in
2014, which was 48.5% in the adult population. his percentage was also higher than that observed among university teachers (51%)8, but lower than
that found among bus drivers (73%)7. he diference between teachers and
drivers may be explained by the longer period of time the latter spent sitting. his situation becomes even more alarming in view of the high percent-age of teachers with a WC classiied as “high” and “very high”, similar to that found in university teachers8, but exceeding that reported for Chinese
adults19. A possible explanation for this diference observed in the present
study could be the high prevalence of women in the sample (87%) when compared to the other studies cited, since the prevalence of “high” and “very high” WC was higher among women. Furthermore, the diference in the socioeconomic proile between university and basic education teachers may have contributed to the higher prevalence of obesity in the present study, since Bonaccio et al.20 found an association between lower income
and obesity. In contrast, González et al.21 reported an inverse association
between household income and WC in women.
Regular physical activity is a determinant factor for energy expenditure, contributing to weight control, and is recommended for the prevention of coronary artery disease4. In this respect, it is interesting to point out that
the present results indicated a lower level of physical activity (daily steps) in the overweight and obese groups. hese results agree with those of a study involving women during menopause, which found an inverse relationship between the level of physical activity and BMI22. Levine et al.23 also observed
a decline in walking with increasing body weight. In the present study, it was not possible to know whether there was a reduction in walking with increasing weight, or whether the increase in body fat resulted in a decrease in daily steps. However, the present result and the studies cited highlight
that walking is an important mechanism for weight control and is also an interesting activity for individuals with obesity.
In the present study, BMI was strongly associated with WC, which is an indicator of central obesity. he same association was observed in a study on adolescents24. hese indings emphasize that excess weight contributes to
central obesity, with a consequent increase in the risk of metabolic syndrome and cardiovascular mortality. his result is important because, in the absence of a balance or stadiometer, the measurement of WC is an extremely useful tool due to its simplicity to suggest the state of central obesity in the popula-tion, contributing to the early detection of this cardiovascular risk factor.
Regarding the anthropometric indicators of central adiposity, it should be noted that the use of diferent sites of measurement compromises the comparison of results between studies. However, in the present study the smaller curvature between the last rib and iliac crest was used because this point is easily identiied, minimizing the occurrence of measurement errors. hus, the interpretation of the results found should take into con-sideration this speciic site.
Among the risk factors analyzed, in women, blood pressure (SBP and DBP) was signiicantly higher in the overweight/obese groups compared to the normal group, but without a clinical diference in SBP between the overweight and normal groups. his alteration is well documented in the literature and diferent mechanisms are involved in the blood pressure increase observed in obese individuals, including elevated leptin levels, insulin resistance and hyperinsulinemia, activation of the sympathetic nervous system and renin-angiotensin-aldosterone system, and hormonal changes25. However, the association between BMI and the pressure variables
was no longer observed ater adjustment for age.
With respect to the biochemical variables in women, diferences in glucose, HDL-C and triglycerides were observed between the BMI groups. he physiopathology of dyslipidemia associated with obesity includes an increase in the hepatic production of very low-density lipoprotein, a de-crease in triglyceride oxidation, inde-creased free fatty acid levels in the liver, and an increase in the formation of small dense LDL-C particles. In this respect, insulin resistance is an important factor that contributes to hyper-triglyceridemia26. hus, these lipid alterations may trigger the formation
of atherosclerotic plaques4, which could result in serious complications if
no actions are taken to prevent their formation.
he fact that insulin resistance was not measured in the present study to evaluate its association with the anthropometric parameters may be considered a limitation. However, in women, fasting glucose was signii-cantly higher in the obese group compared to the other groups. A possible explanation for the increase in fasting glucose among teachers may be the fact that obesity, especially abdominal obesity, contributes to reduce glucose uptake mediated by insulin27.
limitations of the technique used to determine %BF. More accurate results could be obtained with other methods, such as dual-energy X-ray absorp-tiometry. However, the technique of skinfold measurements was chosen due to its simplicity and low cost, permitting its use in epidemiological studies28. Furthermore, all procedures were performed adequately in an
attempt to reduce potential measurement errors.
Adjustment for age eliminated the associations observed between BMI and the cardiovascular risk factors. In this respect, it is important to note that aging is established as one of the factors predisposing to cardiovascular diseases, with the prevalence of coronary events tending to increase with advancing age29. However, since age is a non-modiiable risk factor, it is
necessary to focus on the application of measures designed to prevent the remaining behavioral risk factors in order to reduce the cardiovascular risk of the population.
One limitation of this study is the use of a pedometer to analyze the level of physical activity, which only permitted the determination of daily steps and did not consider intensity or other activities that do not involve vertical acceleration. However, the mean step count over 5 days was used, with Tudor-Locke et al.30 reporting a mean of 3 days to be suicient for
the estimation of weekly physical activity. Finally, the cross-sectional de-sign of the study may have caused reverse causality, which could interfere with the interpretation of the results. However, the results obtained are in agreement with other studies8,23,24.
CONCLUSION
he prevalence of overweight and obesity was high among the basic educa-tion teachers studied. he overall obesity indicator (BMI) was associated with the other anthropometric measures and with the main cardiovascular risk factors. However, the indicators of central obesity had a greater explana-tory power than the biochemical parameters and may be an interesting resource to be used in population studies.
he results of the present study indicate that teachers are in a state of high overweight/obesity, a fact highlighting the need to increase regular physical activity in this group, in conjunction with nutritional counseling, in order to reverse the situation found. Additionally, physical activity will contribute to reduce the cardiovascular risk factors associated with excess weight.
Acknowledgements
We thank Coordenação de Aperfeiçoamento de Pessoal de Nível Superior (Capes) for granting a Master’s fellowship to Renata Aparecida Rodrigues de Oliveira.
REFERENCES
2. Instituto Brasileiro de Geograia e Estatística. Pesquisa de orçamentos familiares, 2008-2009 (POF): Antropometria e estado nutricional de crianças, adolescentes e adultos no Brasil. Rio de Janeiro, Brasil; 2010.
3. Lau DCW, Dhillon B, Yan H, Szmitko PE, Verma S. Adipokines: molecular links between obesity and atherosclerosis. Am J Physiol Heart Circ Physiol 2005;288:H2031-41.
4. Sociedade Brasileira de Cardiologia. IV Diretriz Brasileira sobre dislipidemias e prevenção da aterosclerose. Arq Bras Cardiol 2007;88(supl.1):1-19.
5. Gomes F, Telo DF, Souza HP, Nicolau JC, Halpern A, Serrano Júnior CV. Obesidade e doença arterial coronariana: papel da inlamação vascular. Arq Bras Cardiol 2010;94(2):273-9.
6. Marqueze EC, Ulhôa MA, Moreno CRC. Efects of irregular-shit work and physical activity on cardiovascular risk factors in truck drivers. Rev Saúde Pública 2013;47(3):497-503.
7. Costa MM, Mastroeni SSBS, Reis MAM, Erzinger GS, Mastroeni MF. Excesso de peso em motoristas de ônibus da rede urbana. Rev Bras Cienc Mov 2011;19(1):42-51. 8. Oliveira RAR, Moreira OC, Andrade Neto F, Amorim W, Costa EG, Marins JCB. Prevalência de sobrepeso e obesidade em professores da Universidade Federal de Viçosa. Fisioter Mov 2011;24(4):603-12.
9. Lwanga WK, Lemeshow S. Sample size determination in health studies: a practical manual. Geneva: World Health Organization; 1991.
10. Brasil. Ministério da Saúde. Secretaria de Vigilância em Saúde. Secretaria de Gestão Estratégica e Participativa. Vigitel Brasil 2010: Vigilância de fatores de risco e pro-teção para doenças crônicas por inquérito telefônico. Brasília; 2011.
11. 11.National Institutes of Health. Clinical Guidelines on the identiication, evalu-ation, and treatment of overweight and obesity in adults-the evidence report. Report nº. 98-4083.
12. Lean ME, Han TS, Morrison CE. Waist circumference as a measure for indicating need for weight management. BMJ 1995;311(6998):158-61.
13. Jackson AS, Pollock ML. Generalized equations for predicting body density of men. Br J Nutr 1978;40:497-504.
14. Jackson AS, Pollock ML, Ward A. Generalized equations for predicting body density of women. Med Sci Sports Exerc 1980;12(3):175-81.
15. Siri WE. Body composition from luid paces and density: analysis of methods. In: Brozek J, Henschel A. Techniques for measuring body composition. Washington: National Academy of Science; 1961.
16. Tudor-Locke C, Craig CL, Brown WJ, Clemes SA, De Cocker K, Giles-Corti B, et al. How many steps/day are enough? For adults. Int J Behav Nutr Phys Act 2011; 8:79. 17. Friedwald WT, Levy RI, Fredrickson DS. Estimation of the concentration of
low-density lipoprotein cholesterol in plasma, without use of the preparative ultracen-trifuge. Clin Chem 1972; 18(6):499-502.
18. Brasil. Ministério da Saúde. Secretaria de Vigilância em Saúde. Secretaria de Gestão Estratégica e Participativa. Vigitel Brasil 2014: Vigilância de fatores de risco e pro-teção para doenças crônicas por inquérito telefônico. Brasília; 2015.
19. Pei L, Cheng Y, Kang Y, Yuang S, Yan H. Association of obesity with socioeconomic status among adults of ages 18 to 80 years in rural Northwest China. BMC Public Health 2015; 15:160.
20. Bonaccio M, Bonanni AE, Castelnuovo A, Lucia F, Donati M, Gaetano G, et al. Low income is associated with poor adherence to a Mediterranean diet and a higher prevalence of obesity: cross-sectional results from the Moli-sani study. BMJ Open 2012;2(6).
21. González D, Nazmi A, Victora CG. Childhood poverty and abdominal obesity in adulthood: a systematic review. Cad Saúde Pública 2009; 25(S3):427-40.
Corresponding author
Renata Aparecida Rodrigues de Oliveira
Rua Álvaro Gouveia, 575 CEP: 36570-000 – Viçosa, MG, Brasil [email protected]
23. Levine JA, McCrady SK, Lanningham-Foster LM, Kane PH, Foster RC, Manohar CU. he role of free-living daily walking in human weight gain and obesity. Dia-betes 2008;57:548-54.
24. Alvarez MM, Vieira ACR, Sichieri R, Veiga GV. Associação das medidas antro-pométricas de localização de gordura central com os componentes da síndrome metabólica em uma amostra probabilística de adolescentes de escolas públicas. Arq Bras Endocrinol Metab 2008;52(4):649-57.
25. Becton LJ, Shatat IF, Flynn JT. Hypertension and obesity: epidemiology, mecha-nisms and clinical approach. Indian J Pediatr 2012; 79(8):1056:61.
26. Franssen R, Monajemi H, Stroes ESG, Kastelein JJP. Obesity and dyslipidemia. Med Clin North Am 2011; 95(5):893-902.
27. Huang PLA. A comprehensive deinition for metabolic syndrome. Dis Model Mech 2009;2:231-7.
28. Prijatmoko D, Strauss BJG. Using low-cost composition technology for health surveillance. Asia Paciic J Clin Nutr 1992; 4:15-7.
29. Ferreira-González I. Epidemiología de la enfermedad coronaria. Rev Esp Cardiol 2014; 67(2):139-44.