Luiz Carlos Marques Vanderlei
1, Carlos Marcelo Pastre
1, Ismael Forte Freitas Júnior
2, Moacir Fernandes de Godoy
3 Faculdade de Ciências e Tecnologia - UNESP - Univ Estadual Paulista, Departamento de Fisioterapia1; Faculdade de Ciências e Tecnologia - UNESP - Univ Estadual Paulista, Departamento de Educação Física2, Presidente Prudente, São Paulo; Faculdade de Medicina de São José do Rio Preto - Departamento de Cardiologia e Cirurgia Cardiovascular3, São José do Rio Preto, São Paulo - BrazilMailing address: Luiz Carlos Marques Vanderlei •
Rua Roberto Simonsen, 305 - Departamento de Fisioterapia - 19060-900 - Presidente Prudente, SP - Brazil
E-mail: [email protected]
Manuscript received September 16, 2009; revised manuscript received November 12, 2009; accepted December 29, 2009.
Abstract
Background: Obesity causes changes in cardiac autonomic modulation.
Objective: To investigate the autonomic modulation of eutrophic and obese children by means of indexes of heart rate variability (HRV) obtained through geometric methods.
Methods: We analyzed data from 133 children aged 8 to 13, divided into two groups: obese (n = 61) and eutrophic (n = 72) according to body mass index for age and sex. For the analysis of HRV, heart rate was recorded beat-to-beat. The RR intervals were transformed into geometric figures, and from them, we calculated the triangular index (RRtri), triangular interpolation of RR intervals (TINN), the indexes SD1, SD2 and SD1/SD2 ratio, obtained from the Poincaré plot. Visual analysis of the plot was also performed. Student’s t test was performed for unpaired data and Mann-Whitney’s test, with significance level of 5.0%, for data analysis.
Results: In obese children, RRtri indexes were proven to be reduced (0.0730 vs 0.1084 [median]), TINN (171.80 ± 55.08 vs 218.26 ± 51.12), SD1 (19.93 ± 9.10 vs 24.10 ± 8.03) and SD2 (51.63 ± 16.53 vs 69.78 ± 17.19). The SD1/SD2 ratio showed no significant differences (0.3781 ± 0.12 vs 0.3467 ± 0.08). Visual analysis of the plot, in obese children, revealed a smaller dispersion of RR intervals both beat-to-beat, and in the long term, indicating lower HRV.
Conclusion: Obese children presented changes in the autonomic nervous system characterized by decreases in parasympathetic activity and overall variability. (Arq Bras Cardiol. 2010; [online]. ahead print, PP.0-0)
Key words: Heart rate; child; obesity; body mass index, autonomic nervous System.
on axis x the length of RR intervals, and on axis y, the frequency with which they occurred. Joining the points of the histogram columns forms a shape like a triangle from which these indexes are extracted2,4,5.
The Poincaré plot is a two-dimensional graphic representation of the correlation between consecutive RR intervals, in which each interval is plotted against the following interval6,7 and its
analysis can be done in a qualitative way, by assessing the shape formed by its attractor, which shows the degree of complexity of RR intervals8,9, or quantitative, by fitting an ellipse to the
shape formed by the plot, from which the following indexes are produced: SD1, SD2 and the SD1/SD2 ratio10,11. Beside
this, the analysis of the Poincaré plot is considered by some authors as based on nonlinear dynamics7,12.
HRV analysis by means of nonlinear methods has been gaining increasing interest, since there is evidence that the mechanisms involved in cardiovascular regulation probably interact in a nonlinear way13.
These methods describe complex rhythm fluctuations and manage to separate nonlinear behavior structures in time series of heartbeats better than linear methods14. It has been
speculated that HRV analysis based on nonlinear dynamics
Introduction
Changes in heart rate, defined as heart rate variability (HRV), are normal and expected and indicate the heart’s ability to respond to multiple physiological and environmental stimuli, as well as compensate disorders induced by diseases1.
It is a noninvasive measure that can be used to identify phenomena related to the autonomic nervous system (ANS)2.
The methods used for HRV analysis include the geometric methods - triangular index (RRtri), triangular interpolation of NN interval histogram (TINN) and Poincaré plot - which convert RR intervals into geometric patterns and allow analyzing HRV through the geometric or graphic properties of the resulting pattern2-4.
methods can provide valuable information for physiological interpretations of HRV and evaluation of risk of sudden death7, also enabling a better understanding of the nature of
dynamic and complex systems occurring in healthy and sick human bodies15.
Studies have shown that obesity causes changes in the function of the autonomic nervous system in children and adolescents16,17. Such a condition of imbalance may represent
a major negative factor since the autonomic function controls some of the internal functions of the body and, accordingly, deserves attention.
Studies involving obesity in children and analysis of ANS, through the evaluation of HRV, have shown controversial results. Sekine et al18, analyzing HRV indexes in the frequency
domain, suggest that they have more sympathetic activity and less parasympathetic activity as compared with eutrophic children, while Nagai et al19 and Nagai & Moritani20 observed
both sympathetic and parasympathetic activities decreased in obese children. Yakinci et al21, using autonomic function tests,
observed normal sympathetic activity and parasympathetic underactivity, and more recently, Kaufman et al16 observed
increase in LF/HF ratio and decreased HF index. Pascoal et al22 found higher cardiac tone in the standing position when
compared obese children with eutrophic children.
These studies assess HRV using linear methods, however, it should be noted that, after a systematic search of relevant databases in order to prepare this manuscript, no studies were found using geometrical methods as a means of analysis.
Hence, in order to add elements related to the theme exposed in literature, it is intended, with this study, to investigate the autonomic modulation in obese and eutrophic children through HRV indexes obtained by geometric methods.
Methods
Population
For this study, we analyzed data from 133 children, regardless of gender, aged from 08 to 13. The children were divided into two groups according to nutritional status: obese and eutrophic. Obesity was defined according to criteria established for age and sex by Cole et al23.
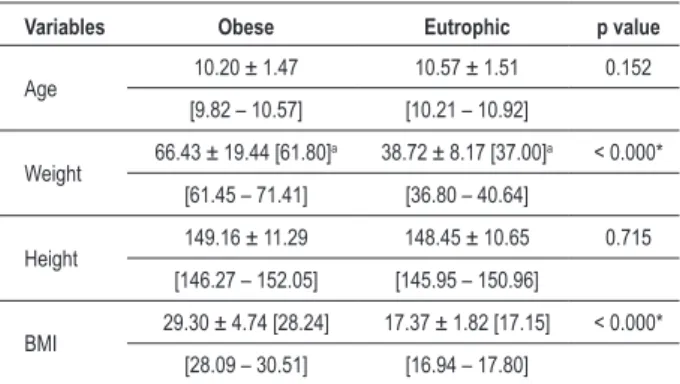
The obese group consisted of 61 children, 28 males (45.90%) and 33 females (54.10%), while the eutrophic group consisted of 72 children (35 males [48.60%] and 37 females [51.40%]). The characteristics of these children (age, weight, height and body mass index) can be seen in Table 1.
Children reporting at least one of the following characteristics were not included in this study: use of medications that would influence the autonomic activity of the heart, such as propranolol and atropine, infections, or metabolic diseases or cardiorespiratory system diseases.
The volunteers and their guardians were fully informed about the procedures and purpose of this study and, after agreeing, their guardians signed an informed consent. All procedures were approved by the Research Ethics Committee of the School of Science and Technology - FCT/UNESP (Proc. No. 187/2007).
Experimental protocol
Before beginning the experimental procedure, children were identified by collecting the following information: age, sex, weight, height, and body mass index. Anthropometric measurements were obtained according to the recommendations described by Lohman et al24.
Weight was measured on a digital scale (Filizzola PL 150, Filizzola Ltda., Brazil) with a precision of 0.1 kg, with children wearing light clothes and barefoot. Height was measured using a stadiometer with precision of 0.1 cm and 2 meters in length. BMI was calculated using the following formula: weight (kg)/height (m)2.
Data collection was performed in a room with temperature between 21° C and 23° C and humidity between 40 and 60%. After the initial assessment, we explained all the procedures necessary to collect the data, which was done individually. The children were instructed to remain at rest, avoid talks during the collection.
After these procedures, the recording strap was placed on the children’s chest at the sternal angle. On their wrist, the heart rate receiver Polar S810i (Polar Electro, Finland). This equipment had been previously validated to record the beat-to-beat heart frequency and use their data for analysis of HRV in children and adults25,26.
After placing the strap and the monitor, the children were placed supine on a mat and remained at rest with spontaneous breathing for 20 minutes. After the collection period, the children were discharged.
For HRV analysis, the pattern of their behavior was recorded beat-to-beat throughout the experimental protocol, with a sampling rate of 1,000 Hz. For data analysis, we used 1,000 consecutive RR intervals after digital filtering, complemented with manual filtering, to eliminate premature and artifact ectopic beats, and only series with more than 95.0% of sinus beats were included in the study27.
Analysis of heart rate variability indexes
HRV analysis was performed by means of geometrical methods: RRtri, TINN and Poincaré plot (SD1, SD2, SD1/ Table 1 - Average values followed by their standard deviations, conidence interval at 95.0% and p value for age, weight, height and body mass index in obese and eutrophic groups
Variables Obese Eutrophic p value
Age 10.20 ± 1.47 10.57 ± 1.51 0.152 [9.82 – 10.57] [10.21 – 10.92]
Weight 66.43 ± 19.44 [61.80]
a 38.72 ± 8.17 [37.00]a < 0.000*
[61.45 – 71.41] [36.80 – 40.64]
Height 149.16 ± 11.29 148.45 ± 10.65 0.715 [146.27 – 152.05] [145.95 – 150.96]
BMI 29.30 ± 4.74 [28.24] 17.37 ± 1.82 [17.15] < 0.000* [28.09 – 30.51] [16.94 – 17.80]
aMedian value; *signiicant difference between groups (Mann-Whitney test; p <
SD2 ratio).
The RRtri was calculated from the construction of a density histogram of RR intervals, which contains the horizontal axis of all possible values of RR intervals measured on a discrete scale with 7,8125 ms boxes (1/128 seconds) and on the vertical axis, the frequency with which each occurred. The union of points of the histogram columns forms a shape like a triangle. The RRtri was obtained by dividing the total number of RR intervals used to construct the histogram by their modal frequency (RR interval value that most frequently appeared on RR)2.
The TINN consists of the measure of the base of a triangle. The method of least squares is used to determine the triangle2. The RRtri and the TINN express the overall
variability of RR intervals2.
The Poincaré plot is a map of points in Cartesian coordinates, constructed from the values of RR intervals obtained, where each point is represented on axis x (horizontal/abscissa) by the previous normal RR interval, and on axis y (vertical/ coordinate), by the following RR interval.
For quantitative analysis of the plot, an ellipse was fitted to the points of the chart, with the center determined by the average RR intervals, and the SD1 indexes were calculated to measure the standard deviation of the distances of the points to the diagonal y = x, and SD2 measures the standard deviation of the distances of points to the line y = - x + RRm, where RRm is the average of RR intervals. The SD1 is an index of instantaneous recording of the variability of beat-to-beat and represents parasympathetic activity, while the index SD2 represents HRV in long-term records, and reflects the overall variability. Their ratio (SD1/SD2) shows the ratio between short and long variations of RR intervals1,11.
The qualitative analysis of the plot was made through the analysis of the figures formed by its attractor, which were described by Tulppo et al28 in:
Figure in which an increase in the dispersion of RR intervals is observed with increased intervals, characteristic of a normal plot.
Small figure with beat-to-beat global dispersion without increased dispersion of RR intervals in the long term.
The HRV analysis software - Version 2.0 was used to calculate these indexes29.
Statistical treatment
To compare the groups, the normality of data was initially determined using the Shapiro-Wilks test. When normal distribution was accepted, Student’s t test for unpaired data was applied (age, height, TINN, SD1, SD2 and SD1/SD2 ratio) and in situations where normal distribution was not accepted, we applied Mann-Whitney’s test (weight, BMI, RRTri). Differences in these tests were considered statistically significant when the value of “P” was smaller than or equal to 0.05.
Results
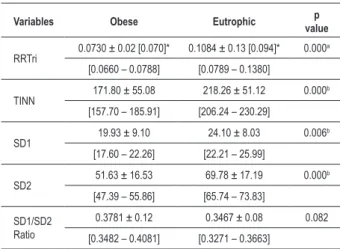
Table 2 shows the values for the indexes RRtri, TINN, SD1, SD2 and SD1/SD2 ratio for obese and eutrophic groups. The
study found significantly lower values for the obese group compared to the eutrophic group, except for the SD1/SD2 ratio, which presented no statistically significant difference between groups.
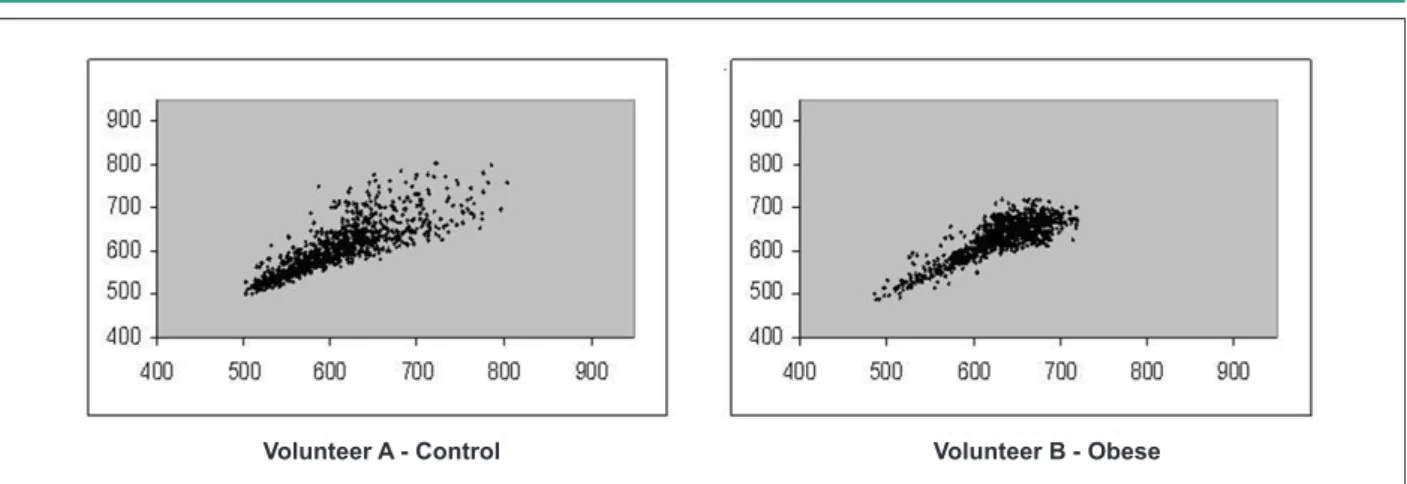
Figures 1 and 2 show examples of Poincaré plot patterns for obese children and controls.
Discussion
The results obtained by means of HRV indexes showed that the obese children analyzed presented decreased geometric indexes, suggesting that in these children, the heart rate variability is reduced.
The SD1 index, which represents the transverse axis of the Poincaré plot shows the standard deviation of the instantaneous variability of the beat-to-beat heart rate11 and
indicates the parasympathetic influence on the sinoatrial node10. The lowest values of the SD1 index in obese children
suggest that in these children, the parasympathetic activity is reduced.
Decreased parasympathetic activity in obese children was also reported by other authors16,19,21. Such reduction is
associated with increased risk for morbidity and mortality from all causes and development of several risk factors30.
Martini et al31 observed that obese children have higher
blood pressure, blood glucose, insulin and triglyceride levels and lower levels of high density lipoprotein (HDL) when compared with non-obese children. Paschoal et al22 also
reported lower levels of HDL and increased triglycerides in obese children. The presence of such characteristics in children with obesity may be associated with changes in ANS activity as stated by Sekine et al18.
The indexes SD2, TINN and RRtri also showed reduction in obese children compared with eutrophic children. These
Table 2 - Average values followed by their standard deviations, conidence interval at 95.0% and p value for analysis of geometric indexes of obese and eutrophic groups
Variables Obese Eutrophic valuep
RRTri 0.0730 ± 0.02 [0.070]* 0.1084 ± 0.13 [0.094]* 0.000 a
[0.0660 – 0.0788] [0.0789 – 0.1380]
TINN 171.80 ± 55.08 218.26 ± 51.12 0.000b [157.70 – 185.91] [206.24 – 230.29]
SD1 19.93 ± 9.10 24.10 ± 8.03 0.006b [17.60 – 22.26] [22.21 – 25.99]
SD2 51.63 ± 16.53 69.78 ± 17.19 0.000b [47.39 – 55.86] [65.74 – 73.83]
SD1/SD2 Ratio
0.3781 ± 0.12 0.3467 ± 0.08 0.082 [0.3482 – 0.4081] [0.3271 – 0.3663]
*Median value; aSigniicant difference between groups (Mann-Whitney test; p <
0.05); bSigniicant difference between groups (Student’s t test for unpaired data;
Figure 1 - Visual pattern of Poincaré plot observed in the eutrophic group (Volunteer A - SD1 = 24.1 and SD2 = 75.6) and obese (Volunteer B - SD1 = 17.0 and SD2 = 57.2).
Volunteer A - Control Volunteer B - Obese
Figure 2 - Visual pattern of Poincaré plot observed in the eutrophic group (Volunteer A - SD1 = 25.2 and SD2 = 70.1) and obese (Volunteer B - SD1 = 16.2 and SD2 = 52.9).
Volunteer A - Control Volunteer B - Obese
indexes express the overall variability of RR intervals2,11,
suggesting that obese children have reduced the overall variability of heart rate.
Sekine et al18 and Martini et al31, evaluating the overall
variability in obese children through the SDNN index (standard deviation of RR intervals), found no statistically significant differences in this index, however these values were lower in these children, compared with non-obese children. Significant reduction of this index was reported by Rabbia et al32 in obese
adolescents (aged 13.9 ± 1.7).
In obese children, reduction in sympathetic activity was described in literature19,20. This system participates in the
control of glucose metabolism and fat33 and a lower level
of sympathetic activity was associated with lower energy expenditure and therefore a positive energy balance and weight gain34.
Concerning the SD1/SD2 ratio, the analyses showed no significant differences of this index when comparing the obese group against the eutrophic group, which can be explained by the reduction observed in both the SD1 and in the SD2 indexes in obese children.
The visual analysis of Poincaré plot revealed that eutrophic
children have a greater beat-to-beat dispersion of RR intervals, as well as greater dispersion of RR intervals in the long term, compared with obese children, indicating that these children have higher HRV.
In healthy individuals at rest, the intervals between beats are very irregular, especially by the vagal predominance in heart modulation, which makes it possible to see, in Poincaré plot, a cloud of points with the approximate shape of an ellipse28,35,
which can be observed in eutrophic children.
Unlike what was observed in eutrophic children, analyses of figures from the plot of obese children showed less dispersion of RR intervals, both beat-to-beat and in the long term, implying lower HRV.
In summary, the findings of this study suggest that obese children have autonomic dysfunctions characterized by decreased parasympathetic activity and overall variability. These findings, coupled with the serious problems that can be produced by obesity36, reinforce the need for treatment
and leading to reduced sympathetic activity and blood pressure, improving insulin sensitivity, decreasing plasma concentrations of triglycerides and increasing HDL-cholesterol concentrations37-39, which may be beneficial to alleviate or
eliminate the risks produced by obesity.
Conclusions
The results suggest that obese children present changes in the autonomic nervous system, characterized by decreases in parasympathetic activity and overall variability, which demonstrates the need for early attention to these children, to avoid future complications.
Potential Conflict of Interest
No potential conflict of interest relevant to this article was reported.
Sources of Funding
This study was funded by FAPESP - Processo FAPESP No. 2008/05414-0.
Study Association
This study is not associated with any post-graduation program.
References
1. Vanderlei LCM, Pastre CM, Hoshi RA, Carvalho TD, Godoy MF. Noções básicas de variabilidade da frequência cardíaca e sua aplicabilidade clínica. Rev Bras Cir Cardiovasc. 2009; 24 (2): 205-17.
2. Task Force of the European Society of Cardiology and the North American Society of Pacing and Electrophysiology. Heart rate variability: standards of measurement, physiological interpretation and clinical use. Circulation. 1996; 93 (5): 1043-65.
3. Majercak I. The use of heart variability in cardiology. Bratisl Lek Listy. 2002; 103 (10): 368-77.
4. Rajendra Acharya U, Paul Joseph K, Kannathal N, Lim CM, Suri JS. Heart rate variability: a review. Med Biol Eng Comput. 2006; 44 (12): 1031-51. 5. Rocha RM, Albuquerque DC, Albanesi Filho FM. Variabilidade da frequência
cardíaca e ritmo circadiano em pacientes com angina estável. Rev SOCERJ. 2005; 18 (4): 429-42.
6. Lerma C, Infante O, Pérez-Grovas H, José MV. Poincaré plot indexes of heart rate variability capture dynamic adaptations after haemodialysis in chronic renal failure patients. Clin Physiol Funct Imaging. 2003; 23 (2): 72-80. 7. Khaled AS, Owis MI, Mohamed ASA. Employing time-domain methods and
poincaré plot of heart rate variability signals to detect congestive heart failure. BIME Journal. 2006; 6 (1): 35-41.
8. Woo MA, Stevenson WG, Moser DK, Trelease RB, Harper RM. Patterns of beat to beat heart rate variability in advanced heart failure. Am Heart J. 1992; 123: 704-10.
9. Vito GD, Galloway SDR, Nimmo MA, Maas P, McMurray JJV. Effects of central sympathetic inhibition on heart rate variability during steady-state exercise in healthy humans. Clin Physiol Funct Imaging. 2002; 22: 32-8.
10. Tulppo MP, Makikallio TH, Takala TES, Seppanen T, Huikuri HV. Quantitative beat-to-beat analysis of heart rate dynamics during exercise. Am J Physiol (Circ Physiol). 1996; 271 (7): H244-H252.
11. Brunetto AF, Silva BM, Roseguini BT, Hirai DM, Guedes DP. Limiar ventilatório e variabilidade da frequência cardíaca em adolescentes. Rev Bras Med Esporte. 2005; 11 (1): 22-7.
12. Voss A, Schroeder R, Truebner S, Goernig M, Figulla HR, Schirdewan A. Comparison of nonlinear methods symbolic dynamics, detrended fluctuation, and Poincaré plot analysis in risk stratification in patients with dilated cardiomyopathy. Chaos. 2007; 17 (1): 015120.
13. Huikuri HV, Makikallio TH, Perkiomaki J. Measurement of heart rate variability by methods based on nonlinear dynamics. J Electrocardiol. 2003; 36 9 (Suppl): 95-9.
14. Voss A, Kurths J, Kleiner HJ, Witt A, Wessel N, Saparin P, et al. The application of methods of non-linear dynamics for the improved and predictive recognition of patients threatened by sudden cardiac death. Cardiovasc Res. 1996; 31: 419-33.
15. Higgins JP. Nonlinear systems in medicine. Yale J Biol Med. 2002; 75 (5-6):
247-60.
16. Kaufman CL, Kaiser DR, Steinberger J, Kelly AS, Dengel DR. Relationships of cardiac autonomic function with metabolic abnormalities in childhood obesity. Obesity. 2007; 15 (5): 1164-71.
17. Tonhajzerova I, Javorka M, Trunkvalterova Z, Chroma O, Javorkova J, Lazarova Z, et al. Cardio-respiratory interaction and autonomic dysfunction in obesity. J Physiol Pharmac. 2008: 59 (Suppl 6): 709-18.
18. Sekine M, Izumi I, Yamagami T, Kagamimori S. Obesity and cardiac autonomic nerve activity in healthy children: results of the Toyama Birth Cohort Study. Environm Health Prev Med. 2001; 6: 149-53.
19. Nagai N, Matsumoto T, Kita H, Moritani T. Autonomic nervous system activity and the state and development of obesity in japanese school children. Obes Res. 2003; 11: 25-32.
20. Nagai N, Moritani T. Effect of physical activity on autonomic nervous system function in lean and obese children. Int J Obesity. 2004; 28: 27-33.
21. Yakinci C, Mungen B, Karabiber H, Tayfun M, Evereklioglu C. Autonomic nervous system functions in obese children. Brain Dev. 2000; 22: 151-3.
22. Paschoal MA, Trevizan PF, Scodeler NF. Variabilidade da frequência cardíaca, lípides e capacidade física de crianças obesas e não-obesas. Arq Bras Cardiol. 2009; 93 (3): 239-46.
23. Cole TM, Bellizzi MC, Flegal KM, Dietz WH. Establishing a standard definition for child overweight and obesity worldwide: international survey. BMJ. 2000; 320 (6): 1-6.
24. Lohman TG, Roche AF, Martorell R. Anthropometric standardization reference manual. Champaign: Human Kinetics Books; 1988.
25. Gamelin FX, Baquet G, Berthoin S, Bosquet L. Validity of the polar S810 to measure R-R intervals in children. Int J Sports Med. 2008; 29: 134-8.
26. Vanderlei LCM, Silva RA, Pastre CM, Azevedo FM, Godoy MF. Comparison of the Polar S810i monitor and the ECG for the analysis of heart rate variability in the time and frequency domains. Braz J Med Biol Res. 2008; 41 (10): 854-9.
27. Godoy MF, Takakura IT, Correa PR. Relevância da análise do comportamento dinâmico não-linear (Teoria do Caos) como elemento prognóstico de morbidade e mortalidade em pacientes submetidos à cirurgia de revascularização miocárdica. Arq Cienc Saúde. 2005; 12 (4): 167-71. 28. Tulppo MP, Mäkikallio TH, Seppänen T, Laukkanen RT, Huikuri HV. Vagal
modulation of heart rate during exercise: effects of age and physical fitness. Am J Physiol. 1998; 274 (2Pt 2): H424-9.
29. Niskanen JP, Tarvainen MP, Ranta-aho PO, Karjalainen PA. Software for advanced HRV analysis. Comp Meth Progr Biomed. 2004; 76: 73-81. 30. Thayer JF, Lane RD. The role of vagal function in the risk for cardiovascular
disease and mortality. Biol Psychol. 2007; 74: 224-42.
variability in childhood obesity. Clin Auton Res. 2001; 11 (2): 87-91. 32. Rabbia F, Silke B, Conterno A, Grosso T, De Vito B, Rabbone I, et al.
Assessment of cardiac autonomic modulation during adolescent obesity. Obes Res. 2003; 11 (4): 541-8.
33. Nonogaki K. New insight into sympathetic regulation of glucose and fat metabolism. Diabetologia. 2000; 43: 533-49.
34. Peterson HR, Rothschild M, Weinberg CR, Fell RD, McLeish KR, Pfeifer MA. Body fat and the activity of the autonomic nervous system. N Engl J Med. 1988; 318: 1077-83.
35. Mourot L, Bouhaddi M, Perrey S, Rouillon JD, Regnard J. Quantitative Poincaré plot analysis of heart rate: effect of endurance training. Eur J Appl
Physiol. 2004; 91 (1): 79-87.
36. Daniels SR. Complications of obesity in children and adolescents. Int J Obes. 2009; 33 (Suppl 1): S60-S65.
37. Ribeiro MM, Silva AG, Santos NS, Guazzelle I, Matos LNJ, Trombetta IC, et al. Diet and exercise training restore blood pressure and vasodilatory responses during physiological maneuvers in obese children. Circulation. 2005; 111 (15): 1915-23.
38. Carnethon MR, Craft LL. Autonomic association between exercise and diabetes: autonomic nervous system function. Exerc Sport Sci Rev. 2008; 36 (1): 12-8. 39. Sichieri R, Souza RA. Estratégias para prevenção da obesidade em crianças