Introduction
The process of dehydration occurs when luid loss is not com
-pensated by the ingestion of luid, which in turn will lead to a deterioration of temperature regulation, performance, and health. Ensuring adequate luid intake before, during, and after exercise can improve performance and reduce the problems
associated with heat1-4.
Eficient hydration ensures the ideal conditions for the prac
-titioner to maintain their physical capability to provide proper functioning of the homeostatic processes required by exercise5. From a physiological standpoint, studies have shown the beneits of water intake during and/or after exercise. A
previous study subjected ten individuals to ingestion of water immediately after a 30-minute cycling exercise at a workload representing 80% of anaerobic threshold. They showed that water consumption accelerated cardiac vagal reactivation after exercise; however, no signiicant inluence on heart rate (HR) and blood pressure responses was observed6. In another study, the participants were subjected to a protocol of hydration during and after exercise: the results showed minimal changes in systolic blood pressure (SBP) and diastolic blood pressure (DBP) and a smaller increase in HR during exercise7. The re -sults showed better HR recovery and faster return of SBP and DBP and better performance of pulse oxygen saturation and respiratory rate. Peçanha, Paula-Ribeiro, Campana-Rezende, Original article (full paper)
Effects of water ingestion throughout exercise
and recovery on cardiac autonomic modulation
during and after exercise
Isadora Lessa Moreno
Universidade Federal de São Paulo, São Paulo, SP, Brasil
Luiz Carlos Marques Vanderlei Franciele Marques Vanderlei
Carlos Marcelo Pastre
Universidade Estadual Paulista “Julio de Mesquita Filho”, Presidente Prudente, SP, Brasil
Luiz Carlos de Abreu
Faculdade de Medicina do ABC, Santo André, SP, Brasil
Celso Ferreira
Universidade Federal de São Paulo, São Paulo, SP, Brasil
Abstract––Purpose: To analyze the effects of water intake on heart rate variability (HRV) during and after exercise.
Methods: Thirty-one young males performed three different procedures: I) a maximal exercise test to determine the load for the protocols; II) the control protocol (CP); III) the experimental protocol (EP). The protocols comprised 10 minutes at rest, 90 minutes of treadmill exercise (60% of VO2 peak), and 60 minutes of recovery. No rehydration beverage consumption was allowed during the CP. During the EP, the participants were given water every 15 minutes, being that the amount of water to be ingested by each volunteer was divided over the time of exercise and recovery. For the analysis of HRV data, time and frequency domain indices were investigated in the following moments (M): M1 (5 minutes inal of rest), M2 (25–30 minutes of exercise), M3 (55–60 minutes of exercise), M4 (85–90 minutes of exercise), M5 (5–10 minutes of recovery), M6 (15–20 minutes of recovery), M7 (25–30 minutes of recovery), M8 (40–45 minutes of recovery), and M9 (55–60 minutes of recovery). Results: There was no statistically signiicant difference between the groups that were examined during the exercise. HRV values for the CP and EP at the end of the exercise period were as follows SDNN (5.95±1.89 vs 6.89±2.11); RMSSD (3.29±0.78 vs 3.39±0.95); HF [nu] (24.06±14.26 vs 19.10±11.94); LF [nu] (75.93±14.26 vs 80.89±11.94); HF [ms2] (0.90±1.16 vs 0.94±0.89); LF [ms2] (4.65±5.94 vs 5.35±5.09); and LF/HF ratio (4.64±3.15 vs 6.95±5.57). HRV values for the CP and the EP at the end of the recovery period were as follows: SDNN (39.63±19.63 vs 49.95±17.79); RMSSD (21.63±15.55 vs 36.43±22.73); HF [ms2] (285.51±392.27 vs 699.29±699.66); LF [nu] (74.55±13.25 vs 61.19±19.27); and HF [nu] (25.44±13.25 vs 38.8±19.27). Conclusion: The hydration with water was not enough to signiicantly inluence the linear HRV indices during exercise; however, it promoted faster recovery of these variables after exercise.
Bartels, Marins, de Lima8 evaluated the effects of water intake on the parasympathetic recovery after high-intensity exercise in active young individuals and found that water accelerates post-exercise vagal reactivation.
Although studies have shown that water intake (the method of hydration most commonly used) before or during exercise is beneicial to cardiac autonomic responses post-exercise, it is not known what is the effect of water intake performed repeatedly throughout the exercise and recovery period on these responses. In addition, the studies did not evaluate these responses for an extended recovery time. Therefore, our purpose was to evaluate the effects of hydration protocols on autonomic modulation of the heart in young people during and post-exercise. We hypoth
-esized that hydration with water during exercise and recovery may attenuate autonomic changes induced by exercise and accelerate recovery. To test this hypothesis, we assessed linear indices of heart rate variability (HRV) in young men with and without water intake (Vittalev, Spaipa, Brazil).
Methods
Participants
Thirty-one healthy, young male volunteers (21.5±1.8 yrs) were investigated. All were active according to the International Physical Activity Questionnaire (IPAQ)9. These volunteers had no damaging habits such as smoking or alcohol consumption, were not taking medications that inluence cardiac autonomic activity, and were not diagnosed with any cardiovascular, metabolic or endocrine disorder. No volunteers were excluded during the course of the experiment. Every individual signed a consent letter and was informed of the procedures and objectives of the study. The study’s procedures were all approved by the Research Ethics Committee of the Federal University of São Paulo –UNIFESP (Number 0861/11).
Experimental design protocol
For all visits, volunteers were instructed to avoid consuming caffeine 24 h before the procedures, to consume a light fruit-based meal 2 h before the tests, to have a good night’s sleep (7–8 h), to avoid strenuous physical exercise the day before the test and to wear appropriate and comfortable clothes (shorts, shirt, shoes, and socks) for physical exercise.
The clinical trial was based on previous studies10,11. Participants reported to the laboratory three days per week, at an interval of 48 hours between visits. An incremental test was applied during the irst visit, which was performed on a treadmill (Super ATL, Inbrasport, Brazil) according to the Bruce proto
-col12. To establish the baseline, volunteers were allowed to rest in a standing position on the mat before the test began. Once the test started, verbal encouragement was used in an attempt to obtain a maximum physical effort; the test was interrupted by voluntary exhaustion. To determine oxygen consumption (VO2), expired gases were analyzed using a regularly calibrated
metabolic analyzer (VO2000, Medical Graphics, St Paul, MN,
USA). The VO2peak was taken to be the highest VO2achieved in the test. The HR reached at 60% of VO2peak was used to determine the exercise intensity for the protocols, considering that gastric emptying is considerably disturbed at intensities above 70% of VO2peak13.
In subsequent visits, called control (CP) and experimental (EP) protocols, volunteers were allowed to rest in the supine position for 10 minutes, followed by 90 minutes of exercise (60% of VO2 peak), and 60 minutes of recovery. Volunteers were not given any luids to drink during the CP; however, during the EP they were given water (Vittalev, Spaipa, Brazil)
containing bicarbonate (62.49 mg/L), calcium (7.792 mg/L),
carbonate (3.91 mg/L), chloride (0.09 mg/L), strontium (0.343 mg/L), luorid (0.05 mg/L), magnesium (0.340 mg/L), potassium (1.485 mg/L), sodium (16.090 mg/L), and sulfate (0.18 mg/L). Water intake was administered in 10 equal portions at regular intervals of 15 minutes from the ifteenth minute of exercise until the end of the recovery. They were given water at temperatures between 15 and 22ºC. The amount of water administered was based on the difference in body weight before and after the CP, therefore the CP was always realized before the EP—there was no randomization. This technique indicates that 1 g reduction in body weight is equal to 1 mL of luid reduction14.
The protocols were performed in a room under environment temperatures (26.0±2.3°C) and humidity (55.1±10.4%) between 3 p.m. and 6 p.m. to avoid circadian variations. To ensure the condition of initial hydration all the volunteers drank water (500 mL) at one time 2 h before both protocols1. Body weight (digital scale Plenna, TIN 00139 MÁXIMA, Brazil), and height (stadiometer ES 2020, Sanny, Brazil) were measured in all the subjects upon their arrival at the laboratory. The heart monitor was then strapped on each subject’s thorax over the distal third of the sternum. The HR receiver (Polar Electro S810i, Kempele, Finland) was placed on the wrist for beat-to-beat HR measure
-ments and for HRV analysis.
HR was analyzed at the following periods: inal 10 minutes of rest; after 30, 60, and 90 minutes of exercise; after 5, 10, 20, 30, 40, 50, and 60 minutes of recovery.
The volunteers remained at rest in the supine position for 10 minutes and immediately their axillary temperature (thermometer BD Thermofácil, China) was measured. Subsequently, the partic
-ipants performed a treadmill exercise (60% of VO2 peak) for 90 minutes and were then allowed to rest in the supine position for 60 minutes for recovery. Axillary temperature was checked again immediately following exercise; the volunteers’ nude weight was measured again at the end of the recovery period.
Urine was collected and analyzed (10 Choiceline, Roche®, Brazil) at the end of the EP and after measurement of inal body weight. Urine density was used as a marker for hydration level15.
Heart rate variability indices analysis
form, an interval of 5 minutes was selected, and series with more than 256 RR intervals were used for analysis, following digital iltering complemented by manual iltering to eliminate premature ectopic beats and artifacts. Only series with more than 95% sinus rhythm were included in the study16,17. To analyze HRV in the frequency domain, we used the low (LF) and high frequencies (HF) spectral components in normalized units (nu) and absolute (ms2), and the LF/HF ratio, which represents the relationship between low and high frequencies16. We considered the following range: LF, 0.04–0.15 Hz and HF, 0.15–0.4 Hz. The spectral analysis was calculated using the Fast Fourier Transform algorithm18. Analysis in the time domain was performed by means of SDNN (ms) (standard deviation of normal-to-normal RR intervals) and RMSSD (ms) (root-mean square of differenc
-es between adjacent normal RR intervals in a time interval)16. HRV indices were analyzed at the following moments: M1 (inal 5 minutes rest); M2 (25–30 minutes after exercise); M3 (55–60 minutes after exercise); M4 (85–90 minutes after exercise); M5 (5–10 minutes of recovery); M6 (15–20 minute recovery); M7 (25–30 minute recovery); M8 (40–45 minute recovery) and M9 (55–60 minute recovery). Series with more than 256 RR intervals were used for analysis16. We used Kubios HRV version 2.0 software to analyze these indices19.
Statistical Analysis
Gaussian distribution of the data was veriied using the Shapiro-Wilks test. For comparisons between protocols (control vs. experimental) and moments (M1, M2, M3 and M4 during exercise and M1 vs. M5, M6, M7, M8, M9 during recovery) two-way repeated measures analysis of variance was applied, followed by the Bonferroni post-test for parametric distributions or Dunn’s post-test for non-parametric data. The repeated mea
-sures data were checked for sphericity violation using Mauchly’s test and the Greenhouse-Geisser correction was conducted when sphericity was violated. Signiicance level was set at p < 0.05
for all tests. SPSS (version 13.0) software (SPSS Inc., Chicago, IL, USA) was used for statistical analysis.
The sample size calculation was done considering how vari
-able the RMSSD index. The magnitude of assumed signiicant difference was 12 ms, considering a standard deviation of 16 ms, with alpha risk of 5% and beta of 80%, and the sample size resulted in 28 young. Considering possible sample loss, adds up 10% to sample size calculated, totaling 31 young.
Results
The anthropometric characteristics of the participants and their responses obtained during the incremental test are de
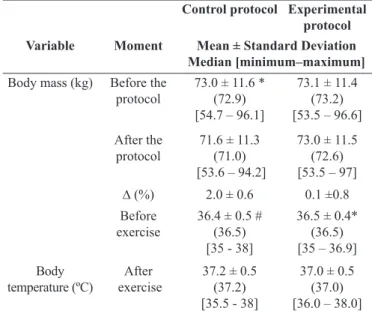
-scribed in Table 1. Table 2 shows data regarding body mass and temperature in the CP and the EP. We observed weight loss in the CP (Table 2). The percentage of body weight loss in the CP was 2.0±0.6%, while in the EP it was 0.1±0.8%. The average con
-sumption of water was 1.4±0.5 L in the EP. The density of urine (1.017±0.004 g/mL) evaluated at the end of the EP conirms
that the volume of solution intake was suficient to maintain the
participants at euhydrated status15. Body temperature behaved similarly in both protocols, increasing signiicantly at the end of the exercise (Table 2).
Table 1. Subject characteristics.
Variables Mean ±
Standard Deviation Minimum/ Maximum Anthropometric data Age (yr) Body mass (kg)
Height (m) BMI (kg/m2)
Incremental test
VO2peak (L.min-1)
HR (bpm) at 60% VO2peak
21.5 ± 1.8 72.6 ± 11.5 1.70 ± 0.10 23.0 ± 2.8
3.3 ± 0.6 160.7 ± 10.7
[18 – 25] [53.8 – 95.3] [1.60 – 1.90] [16.8 – 28.1]
[2.0 – 5.1] [139 – 179]
VO2peak relative to
body mass (L.min-1 / Kg)
0.047 ± 0.007 [0.027 – 0.058]
Legend: yr, years; kg, kilograms; m, meters; BMI, body mass index; VO2peak, peak oxygen consumption; HR, heart rate; bpm, beats per minute; L.min-1, liter per minute.
Table 2. Values of body mass and temperature in control and experi -mental protocols.
Control protocol Experimental protocol
Variable Moment Mean ± Standard Deviation
Median [minimum–maximum]
Body mass (kg) Before the
protocol 73.0 ± 11.6 *(72.9) [54.7 – 96.1]
73.1 ± 11.4 (73.2) [53.5 – 96.6] After the
protocol 71.6 ± 11.3(71.0) [53.6 – 94.2]
73.0 ± 11.5 (72.6) [53.5 – 97] ∆ (%) 2.0 ± 0.6 0.1 ±0.8 Before
exercise
36.4 ± 0.5 # (36.5) [35 - 38]
36.5 ± 0.4* (36.5) [35 – 36.9] Body
temperature (ºC) exerciseAfter
37.2 ± 0.5 (37.2) [35.5 - 38]
37.0 ± 0.5 (37.0) [36.0 – 38.0]
Legend: kg, kilogram; °C, degrees Celsius; ∆, delta; %, percentage. *Value with a signiicant difference compared with after the exercise (Student t test of paired data; p < .05); #value with a signiicant difference compared with after the exercise (Wilcoxon test; p < .05);
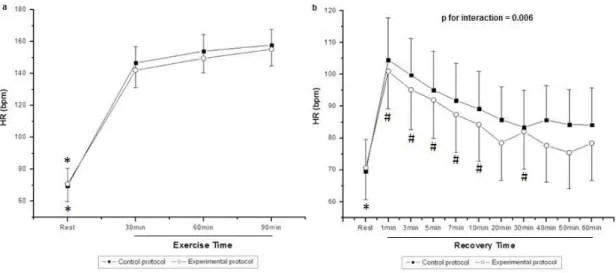
Figure 1 shows HR values during exercise (Figure 1a) and recovery (Figure 1b). During exercise, we observed the effect of moment (p < 0.001) on HR; however, there was no effect among
protocols (p = 0.31) and in the moment and protocol interaction
(p = 0.29). In both protocols, we noted that HR was signiicantly
on HR; there was no effect among protocols (p = 0.081). In the
CP, a signiicant decrease was observed when comparing all minutes of recovery at rest, while in the EP it was only observed in the 1, 3, 5, 7, 10, and 30 minute. In the EP, after 40 minutes of recovery the HR did return to baseline.
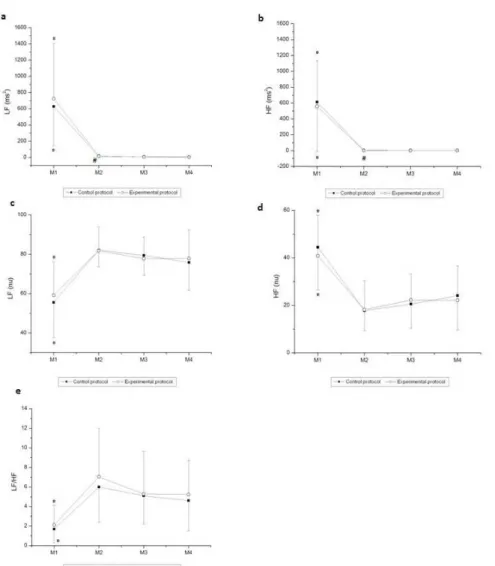
Figures 2 and 3 show the behavior of HRV indices in time and frequency domains, respectively, during exercise. There was a moment effect for the time domain indices (SDNN and RMSSD; p
< 0.001). No effects were observed between the protocols (SDNN,
p = 0.66; RMSSD, p = 0.94) and in the moment and protocol
interaction (SDNN, p = 0.91; RMSSD, p = 0.88). We noted that
SDNN (ms) and RMSSD (ms) were signiicantly decreased at M2, M3, and M4 of exercise in both the CP and EP compared to M1 (rest). Moreover, there was a decrease in the SDNN (ms) for the CP at M2 of exercise compared to M4 of exercise.
Likewise, we observed a moment effect in all indices in the frequency domain (p < 0.001). No effects were observed
for those indices between the protocols [LF (ms2), p = 0.50; HF (ms2), p = 0.72; LF (nu), p = 0.63; HF (nu), p = 0.63; LF/ HF, p = 0.31]. There were no interactions between moment
and protocol [LF (ms2), p = 0.53; HF (ms2), p = 0.71, LF (nu),
p = 0.64; HF (nu), p = 0.64, LF / HF, p = 0.87]. Regarding the
comparison between moments, we observed that LF (ms2), HF (ms2), and HF (nu) were signiicantly higher at M1 (rest) compared to M2, M3, and M4 of exercise in both the CP and the EP. LF (nu) and LF/HF were signiicantly lower at M1 compared to M2, M3 and M4 of exercise in both the CP and the EP. Moreover, LF (ms2) was signiicantly higher at M2 of exercise compared to M4 of exercise in the CP, while HF (ms2) was signiicantly higher at M2 of exercise compared to M4 of exercise in the EP.
Figure 1. Values are mean ± standard deviation. Heart rate (HR) during (a) exercise and (b) recovery, and the comparison in control and experimental protocols; *Different from all the times of exercise and recovery (p < 0.05); #Different from M1 (p < 0.05); HR, heart rate; bpm, beats per minute.
Figure 3. Values are mean ± standard deviation. (a) LFms2, (b) HFms2, (c) LFnu, (d) HFnu, and (e) LF/HF during exercise and the comparison in control and experimental protocols. Final 5 minutes of rest (M1) and minutes of exercise: 25–30 (M2), 55–60 (M3), 85–90 (M4). *Different from M2, M3, and M4 (p < 0.05); #Different from M4 in the CP (LF ms2) and the EP (HF ms2) (p < 0.05); LF, low frequency; HF, high frequency; M, moment; ms, milliseconds; nu, normalized units.
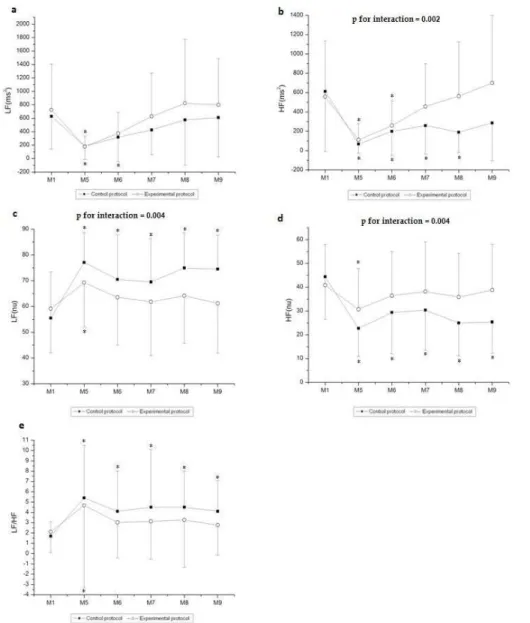
Figures 4 and 5 present the behavior of the HRV index in the time and frequency domains, respectively, during recovery. In relation to the time domain indices, we observed moment effects in the analyzed indices and interactions between moment and protocol (SDNN and RMSSD, p < 0.001). Effect of the protocol
on RMSSD (ms) (p = 0.04) was observed, but not observed for
the SDNN (p = 0.12). Regarding the comparison of the SDNN
(ms) index between recovery and rest, it was signiicantly reduced at M5, M6, M7, M8, and M9 of recovery compared to M1 (rest) in the CP, while it was signiicantly decreased at M5 compared to M1 (rest) in the EP. Regarding RMSSD (ms), it was signiicantly reduced at M5, M6, and M7 of recovery compared to M1 (rest) in the EP, whereas it was signiicantly decreased at M5, M6, M7, M8, and M9 of recovery compared to M1 (rest) in the CP.
In relation to the frequency domain, moment effect was ob
-served in all indices analyzed (p < 0.001). Effects were observed
for those indices between the protocols [HF (ms2), p = 0.03; LF (nu), p = 0.03; HF (nu), p = 0.03], except for the LF/HF ratio (p
= 0.18) and LF (ms2) (p = 0.87). Interactions between moment
and protocol were observed for those indices [HF (ms2), p = 0.002; LF (nu), p = 0.004; HF (nu), p = 0.004], except for the
LF/HF ratio (p = 0.62) and LF (ms2) (p = 0.96).
The LF (ms2) index was reduced at M5 and M6 of recovery compared to M1 (rest) in the CP while it was signiicantly decreased at M5 of recovery compared to M1 (rest) in the EP. HF (ms2) was signiicantly reduced at M5, M6, M7, and M8 of recovery compared to M1 (rest) in the CP, while it was signiicantly decreased at M5 and M6 of recovery compared to M1 (rest) in the EP. In relation to LF (nu), it was signii
Figure 4.Values are mean ± standard deviation. (a) SDNN and (b) RMSSD during recovery and the comparison in control and experimen
-tal protocols. Final 5 minutes of rest (M1) and minutes of recovery: 5–10 (M5), 15–20 (M6), 25–30 (M7), 40–45 (M8), 55–60 (M9). *Dif
-ferent from M5, M6, M7, M8, and M9 (p < 0.05); #Different from M1(p < 0.05); SDNN, standard deviation of the mean of all normal RR
intervals; RMSSD, square root of the mean squared differences between successive normal RR intervals; M, moment; ms, milliseconds.
Figure 5. Values are mean ± standard deviation. (a) LFms2, (b) HFms2, (c) LFnu, (d) HFnu, and(e) LF/HF during recovery and the comparison in control and experimental protocols. Final 5 minutes of rest (M1) and minutes of recovery: 5–10 (M5), 15–20 (M6), 25–30 (M7), 40–45 (M8), 55–60 (M9). *Different from M1 (p < 0.05); LF, low frequency; HF, high frequency; M, moment; ms,
Discussion
The results obtained in this study show that the hydration protocol, despite having produced generally smaller changes in the HRV indices, failed to signiicantly inluence these variables during exercise. However, water intake during the recovery period induced signiicant changes in cardiac autonomic mod
-ulation, promoting faster recovery of HRV indices.
It is well known that the loss of luids through sweating, is the fundamental mechanism of heat dissipation during ex
-ercise, resulting in decreased plasma volume (PV)20. An early study observed that loss of 2.1% of body weight resulted in an average reduction of 5.2% in PV21. Despite PV not being rated in this study, we observed a loss of 2.0±0.6% of body weight when participants were not hydrated. Additionally, a study suggested that the reduction in stroke volume in participants dehydrated during exercise of moderate intensity is associated with a reduction in blood volume and an increase in HR and body temperature22. In our study, body temperature exhibited similar behavior in both protocols—which was also reported by Horswill, Stofan, Lovett and Hannasch23—and were not observed signiicant differences in HR during exercise when water was administered to volunteers in comparison to the CP.
Regarding to cardiac autonomic modulation, no signiicant interaction of the hydration protocol on the HRV indices analyzed was observed despite the predominance of sympathetic modulation on vagal tone during exercise. The RMSSD (ms) and HF (nu) in
-dices, relecting predominantly parasympathetic drive24, decreased during exercise, although they exhibited higher, but not signiicant values, when water was administered to volunteers in comparison to CP. The reduction in PV resulting from the loss of body weight during exercise is responsible for reducing vagal modulation in dehydrated individuals25-27, and possibly inluenced by the lower values of RMSSD (ms) and HF (nu) in the non-hydrated condition.
Reduction in global HRV is expected during exercise28 as well as increase in HR, stroke volume, cardiac output, and SBP, to supply the metabolic requirements. These mechanisms may explain the increased in LF (nu) index during exercise, that is pre
-dominantly modulated by sympathetic modulation, and also the increase in LF/HF ratio, relecting the sympathovagal balance.11 Accordingly,the increase in the spectral indices suggests a sympa
-thetic activation during exercise at low and moderate intensities29. Similarly, it was reported reduced SDNN (ms), RMSSD (ms) and HF and increased LF during exercise in individuals subjected to 8 minutes of the step test at 70% of the maximal potency30.
During exercise, as a consequence of reduced cardiac vagal modulation, the reduction of global HRV is accompanied by a decrease in absolute power (ms2) of the spectral components31. This behavior was also observed in the present study: LF (ms2) and HF (ms2) indices decreased during exercise compared with the rest, regardless of the administration of water. The literature indicates that both spectral indices decreased according to ex -ercise intensity32. Therefore, we expected minimal changes to
be observed in these indices due to the work load maintenance during exercise in our study.
It is important to note that during exercise other aspects, such as central command, mechanorelex, and metaborelex
stimuli are probably more potent than hydration to inluence the changes in autonomic modulation, which could also justify the absence of changes observed during exercise between protocols.
When the recovery period is analyzed, the hydration proto
-cols promoted faster HR recovery (40 minutes post-exercise) compared with the condition in which no rehydration luid was offered, as evidenced by the signiicant interaction between time and protocols on this parameter. Signiicant interaction between time and protocols was also observed after supplying water at the beginning and at 15, 35 and 55 minutes of exercise
for 16 participants33. They found that from the tenth minute of
recovery, HR in the poorly hydrated condition was signiicantly higher (100±4 bpm) until the end of the experiment compared to well-hydrated condition (90±4 bpm).
According to Hendrickse and Triger34, the function of volume retention by the sympathetic system is checked by the reciprocal activity of the vagal system, which promotes diuresis of salt and water. Yun, Lee, and Bazar35 suggest that hydration reduces the sympathetic drive to maintain volume and increases the parasym
-pathetic impulse to promote diuresis. Additionally, the modulation of baroreceptors during gastric distension may be another factor that promotes reduction of sympathetic modulation due to a sec
-ondary effect of increased vagal afferent modulation35. A previous study reported that the ingestion of 500 mL of water caused a bradycardic response followed by an increase in cardiac vagal modulation36. These factors may have inluenced the pattern of HR response observed in this study when water was administered as well as the behavior of HRV indices.
The indices that relect the predominance of vagal modu
-lation, RMSSD (ms), HF (ms2) and HF (nu) showed a gradual increase and rapid recovery, observed in around 40 minutes when the participants were hydrated with water. In contrast, complete recovery of these indices in hypohydrated individuals was not observed. Additionally, a signiicant interaction between time and protocol was observed for all these indices, which suggests better recovery after exercise in the hydrated condition.
Similarly, the indices that relect predominantly sympa
-thetic modulation, LF [ms2] and LF [nu], also recovered better in the EP, especially the LF [nu] index which at 15 minutes post-exercise returned to the baseline. Despite the LF [ms2] index having shown similar behavior in both protocols, the LF index [nu] revealed a signiicant interaction between time and protocols, suggesting fasterrecovery after exercise in the hydrated condition and thus sympathetic predominance in hy
-pohydrated individuals.
Therefore, it is suggested that the process of water deicit, closely associated with the practice of physical activity re
-sulting in 2% loss of body weight observed in the CP of this study, altered the osmotic balance and favored the predomi
-nance of post-exercise sympathetic outlow in hypohydrated individuals37.
reduce the sympathetic-vagal ratio by reducing sympathetic modulation through modulation of cardiovascular barorecep -tors35. Accordingly, the rapid post-exercise cardiac vagal reac
-tivation observed when 500 mL of water were ingested after 30 minute submaximal exercise, was caused mainly by osmotic mechanisms which, mediated by stimulation of osmosensitive structures in the gastrointestinal tract or in the circulation portal, potentially inluenced cardiac vagal modulation6.
In this study, the hypohydrated state also reduced overall HRV after exercise. Signiicant interaction was observed be
-tween moments and protocols for SDNN [ms], suggesting better post-exercise recovery of these indices in the hydrated condition, and given that at 15 minute post-exercise the return of this index to baseline was observed. This response conirms the inluence of hydration status on post-exercise cardiac autonomic stability.
This study has some limitations. The minimum interval between the execution of the CP and the EP was adhered to; however, some collections were completed over a period longer than a week, which may hinder the interpretation of the variables studied. Another important aspect refers to the use of supine rest and recovery conditions, considering that this exercise was performed in the upright position. Although we chose to compare rest and exercise in different positions, we believed that the modiications produced in the parameters during exer
-cise were not inluenced by the postural change. However, in addition to being more tolerable for the volunteer, the choice of the supine position during the recovery period has not impaired the results because the parameters were compared to a baseline, with participants in the same position. Finally, the absence of randomization between protocols can be inluenced the results, however, for the dynamic correct of trial was necessary to ac
-complish irstly the CP to determine the loss of body mass and based on these data suggest the amount of water to be consumed in the hydration protocol.
However, the results of this study reinforce the importance of hydration when performing physical exercise to promote a better response in cardiac autonomic modulation. In sports scope, a faster recovery of the autonomic modulation indicates that the autonomic nervous system of the individual quickly is ready to receive a new stimulus, while in the clinical scope, a better recovery of the autonomic modulation may be important to prevent or reduce cardiovascular events after exercise such as cardiac arrhythmias, decreased or increased blood pressure, pulmonary hyperventilation increasing body pH and an ex
-cessive production of metabolites38.39. As a future perspective, investigating the inluence of water intake over exercise and recovery on sodium concentration and PV can bring better knowledge of this hydration protocol.
Conclusion
In young participants, hydration with small amounts of wa
-ter ingested throughout exercise and recovery did not change autonomic regulation during the exercise, but accelerated autonomic recovery measured by HRV indices in the time and frequency domains.
References
1. Hernandez AJ, Nahas RM. Dietary changes, water replacement,
food supplements and drugs: evidence of ergogenic action and potential healthrisks.Rev Bras Med Esporte. 2009;15: 3-12. 2. Moreno IL, Pastre CM, Papoti M, Vanderlei LCM. Efeitos da
reposição hidroeletrolítica sobre parâmetros cardiorrespiratórios em exercício e recuperação. Motriz. 2012; 18:165-175.
3. Rodriguez NR, DiMarco NM, Langley S. Nutrition and athletic performance.MedSci Sports Exerc. 2009;41:709-731. 4. Sawka MN, Burke LM, Eichner ER, Maughan RJ, Montain SJ,
Stachenfeld NS. American college of sports medicine position stand. Exercise and luid replacement.Med Sci Sports Exerc. 2007;39: 377-390.
5. Montain SJ. Hydration recommendations for sport 2008. Curr Sports Med Reports. 2008; 7;187-192.
6. Vianna LC, Oliveira RB, Silva BM, Ricardo DR, Araújo CG. Water intake accelerates post-exercise cardiac vagal reactivation in humans.Eu J Appl Physiol. 2008; 102: 283-288.
7. Moreno IL, Vanderlei LC, Pastre CM, Vanderlei FM, Abreu LC, Ferreira C. Cardiorespiratory effects of water ingestion during and after exercise. Int Arch Med. 2013; 6: 35.
8. Peçanha T, Paula-Ribeiro M, Campana-Rezende E, Bartels R, Marins JC, de Lima JR. Water intake accelerates parasympathetic reactivation after high-intensity exercise. International J Sport Nutr Exerc Metab. 2014; 24:489-496.
9. Naugle KM, Riley JL. Self-reported physical activity predicts pain inhibitory and facilitatory function. MedSci Sports Exerc. 2014; 46:622-629.
10. Moreno IL, Pastre CM, Ferreira C, Abreu LC, Valenti VE, Vanderrlei LCM. Effects of an isotonic beverage on autonomic regulation during and after exercise. J Society Sports Nutr. 2013; 10:2-11.
11. Vanderlei FM, Moreno IL, Vanderlei LCM, Pastre CM, Abreu LC, Ferreira C. Comparison of the effects of hydration with water or isotonic solution on the recovery of cardiac autonomic modulation. Int J Sport Nutr Exerc Metab. 2015; 25:145-153. 12. Shah BN. On the 50th anniversary of the irst description of a
multistage exercise treadmill test: re-visiting the birth of the ‘Bruce protocol’. Heart. 2013; 99:1793-1794.
13. Costill DL, Sparks KE. Rapid luid replacement following thermal dehydration.J Appl Physiol. 1973; 34:299-303.
14. Von Duvillard SP, Braun WA, Markofski M, Beneke R, Leithäuser R. Fluids and hydration in prolonged endurance performance. Nutrition. 2004; 20:651-656.
15. Armstrong LE, Pumerantz AC, Fiala KA, Roti MW, Kavouras SA, Casa DJ, Maresh CM. Human hydration indices: acute and longitudinal reference values. Int J Sport Nutr Exerc Metab. 2010; 20:145-153.
16. Task Force of the European Society of Cardiology of the North American Society of pacing electrophysiology. Heart rate vari -ability standards of measurement, physiological interpretation and clinical use. Circulation. 1996; 93: 1043-1065.
18. Corrêa PR, Catai AM, Takakura IT, Machado MN, Godoy MF. Heart rate variability and pulmonary infections after myocardial revascularization. Arq Bras Cardiol. 2010;95: 448-456.
19. Tarvainen MP, Niskanen JP, Lipponen JA, Ranta-aho PO, Karjalainen PA. Kubios HRV – A software for advanced heart rate variability analysis. In: 4th European Conference os the
International Federation for Medical and Biological Engineering, Sloten JV, Verdonck P, Nyssen M, Haueisen J, editors. 2008, pp. 1022-1025.
20. Sawka MN, Young AJ. Physiological systems and their respons -es to conditions of heat and cold. In: Tipton CM, Sawka MN,
Tate CA, Terjung RL, editors. ACSM`s Advanced Exercises Physiology. Baltimore: Lippincott, Williams & Wilkins; 2006. p. 535-63.
21. Maughan RJ, Leiper JB, Shirreffs SM. Restoration of luid balance after exercise induced dehydration: effects of food and luid intake. Eur J Appl Physiol. 1996; 73: 317-325.
22. González-Alonso J, Mora-Rodríguez R, Coyle EF. Stroke volume during exercise: interaction of environment and hydration. Am J Physiol: Heart Circ Physiol. 2000;278:H321–H330.
23. Horswill CA, Stofan JR, Lovett SC, Hannasch C. Core tempera -ture and metabolic responses after carbohydrate intake during exercise at 30 degrees C. J Athletic Training. 2008; 43:585-591. 24. Vanderlei LCM, Pastre CM, Hoshi RA, Carvalho TD, Godoy MF.
Basic notions of heart rate variability and its clinical applicability. Rev Bras Cirurgia Cardiovascular. 2009;24:205-217.
25. González-Alonso J, Mora-Rodríguez R, Below PR, Coyle EF. Dehydration markedly impairs cardiovascular function in hy -perthermic endurance athletes during exercise. J Appl Physiol. 1997; 82: 1229-1236.
26. Crandall CG, Zhang R, Levine BD. Effects of whole body heating on dynamic barorelex regulation of heart rate in humans. Am J Physiol: Heart Circ Physiol. 2000;279:H2486-2492.
27. Charkoudian N, Halliwill JR, Morgan BJ, Eisenach JH, Joyner MJ. Inluences of hydration on postexercise cardiovascular control in humans. J Physiol. 2003; 552, 635-44.
28. Alonso DO, Forjaz CLM, Rezende LO, Braga AM, Barretto AC, Negrão CE, Rondon MU. Heart rate response and its vari -ability during different phases of maximal graded exercise.Arq Bras Cardiol. 1998;71:787-792.
29. Mendonca GV, Fernhall B, Heffernan KS, Pereira FD. Spectral methods of heart rate variability analysis during dynamic exercise. Clin Auton Res. 2009;19:237-245.
30. Javorka M, Zila I, Balhárek T, Javorka K. Heart rate recovery after exercise: relations to heart rate variability and complexity. Braz J Med Biol Res. 2002; 35:991-1000.
31. Perini R, Veicsteinas A. Heart rate variability and autonomic activ -ity at rest and during exercise in various physiological conditions. Eur J Appl Physiol. 2003; 90:317-325.
32. Sandercock GRH, Brodie DA. The use of heart rate variability measures to assess autonomic control during exercise. Scand J Med Sci Sports. 2006;16:302-313.
33. Saat M, Tochihara Y, Hashiguchi N, Sirisinghe RG, Fujita M, Chou CM. Effects of exercise in the heat on thermoregulation of Japanese and Malaysian males.J Physiol Anthropol Appl Human Sci. 2005; 24:267-275.
34. Hendrickse MT, Triger DR. Vagal dysfunction and impaired uri -nary sodium and water excretion in cirrhosis. Am J Gastroenterol. 1994; 89:750–757.
35. Yun AJ, Lee PY, Bazar KA. Clinical beneits of hydration and volume expansion in a wide range of illnesses may be attributable to reduction of sympatho-vagal ratio. Med Hypotheses. 2005; 64:646-650.
36. Routledge HC, Chowdhary S, Coote JH, Townend JN. Cardiac vagal response to water ingestion in normal human subjects. Clin Sci. 2002; 103:157-162.
37. Scrogin KE, Grygielko ET, Brooks VL. Osmolality: a phys -iological long-term regulator of lumbar sympathetic nerve activity and arterial pressure. Am J Physiol. 1999; 276: R1579-R1586.
38. Brum PC, Forjaz CLM, Tinucci T, Negrão CE. Adaptações agu -das e crônicas do exercício físico no sistema cardiovascular. Rev Paulista Educação Física. 2004; 18: 21-31.
39. Guyton A, Hall J. Tratado de Fisiologia Médica (11ª ed.). Brasil: Elsevier; 2006.
Funding
This study was support by the Foundation for Research Support of São Paulo State (FAPESP–Proc. 2011/10887-7).
Corresponding Author
Isadora Lessa Moreno Department of Medicine
Rua Napoleão de Barros, 715, Térreo, São Paulo, SP, Brasil. Email: [email protected]
Manuscript submitted: October 15, 2015 Manuscript accepted: April 10, 2016