Vibrational Properties of Bulk Boric Acid
2A
and
3T
Polymorphs and
Their Two-Dimensional Layers: Measurements and Density
Functional Theory Calculations
M. Bezerra da Silva,
*
,†R. C. R. Santos,
†,‡P. T. C. Freire,
†E. W. S. Caetano,
§and V. N. Freire
†,‡†
Departamento de Física, Universidade Federal do Ceará, Caixa Postal 6030, 60440-900 Fortaleza-CE, Brazil
‡
Departamento de Química Analítica e Físico-Química, Universidade Federal do Ceará, 60440-554 Fortaleza-CE, Brazil
§
Instituto Federal de Educação, Ciência e Tecnologia do Ceará, DEMEL, Campus Fortaleza, 60040-531 Fortaleza-CE, Brazil
*
S Supporting InformationABSTRACT: Boric acid (H3BO3) is being used effectively
nowadays in traps/baits for the management ofAedes aegyptiL. andAedes albopictusSkuse species of mosquitoes, which are the main spreading vectors worldwide for diseases such as malaria, dengue, and zika. Previously, we published results on the structural, electronic, and optical properties of its molecular triclinic H3BO3-2A and trigonal H3BO3-3T polymorphs within the framework of density functional theory (DFT). Because of the renewed importance of these materials, the focus of this work is on the vibrational properties of the bulk boric acid2Aand3T
polymorphs. We measured the infrared and Raman spectra of the former, which was accompanied and interpreted through state-of-the-art DFT calculations, supplemented by
computa-tions regarding the H3BO3molecule and two-dimensional layers based on the bulk structures. We identify/assign their normal modes and find vibrational signatures for each polymorph as well as in- and out-of-plane motions and molecular vibrations,
unveiling a nice agreement between the DFT level of theory employed and our improved spectroscopic measurements in the wavenumber ranges of 400−2000 cm−1 (infrared) and 0−1500 cm−1 (Raman). We show that a dispersion-corrected DFT
functional within the generalized gradient approximation (GGA) can be very accurate in describing the vibrational properties of the boric acid polymorphs. Besides, several issues left open/not clearly resolved in previously published works on the vibrational mode assignments of the bulk and 2D sheets of boric acid are explained satisfactorily. Finally, phonon dispersions and associated densities of states were also evaluated for each polymorph along with their temperature-dependent DFT-calculated entropy, enthalpy, free energy, heat capacity, and Debye temperature. In particular, our DFT calculations suggest a possible way to differentiate the 2Aand3Tboric acid polymorphs through Raman spectroscopy and heat capacity measurements.
1. INTRODUCTION
Among the many boron compounds, boric acid (also known as orthoboric acid, molecular formula H3BO3) has received particular attention due to its technological and medical importance. It has been widely used in various industrial applications, such as the fabrication of glasses, lubricants, and nuclear reaction control as well as in the agricultural, medical, and pharmaceutical sectors.1−4 Nowadays, it is employed
effectively in traps/baits for the management of Aedes species
insects1,2 (which are the main spreading vectors for malaria, dengue, and zika worldwide4−6) as well as in anticancer
therapy.7,8
The pioneering study on boric acid crystal X-ray diffraction
was published by Zachariasen in 1954,9 showing that it crystallizes in a triclinic layered structure with four molecules in the unit cell and with aP1¯ space group. A more detailed
structural analysis was performed by Dorset in 1992,10with a much more precise determination of hydrogen atom positions
that unveiled a double-layer pattern of sheets arranged in the repeating sequenceAB..., slightly buckled. Each sheet is formed by H3BO3molecular units with nearly perfect C3h symmetry, linked together through hydrogen bonds. Later, the exploratory research on boron synthetic compounds by Shuvalov and Burns11 indicated the crystallographic structure of a new trigonal polytype of boric acid, H3BO3-3T, with triple-layer sheets stacked in the repeating sequence pattern ABC.... Therefore, the two crystalline layered boric acid polymorphs were labeled as H3BO3-2A (double layer) and H3BO3-3T (triple layer). Notwithstanding these experimental structural studies, a theoretical investigation of the structural, electronic, and optical properties of these compounds within the density functional theory (DFT) framework was performed only
Received: October 11, 2017 Revised: January 12, 2018 Published: January 12, 2018
recently,12demonstrating that the properties of both boric acid
2A- and 3T-polymorphs are ruled by intra- and interplane hydrogen bonds and weak van der Waals dispersion interactions between the B(OH)3 units, where the relatively close interplanar distances between parallel boric acid single layers lead to subtle differences in the electronic and optical
features of these systems. Although hydrogen bonds are much weaker than covalent bonds, they have important consequences for the optical, electronic, and vibrational properties of layered molecular crystals.13,14
Vibrational spectroscopy techniques, such as infrared absorption and Raman scattering, are essential tools in characterizing solid-state amino acid-based systems (which are molecular crystals), being applied to both amino acid molecules in vacuum and solvated as well as to their crystal structures.15 The interpretation of vibrational features (normal mode assignments, for instance) receives invaluable aid from density functional theory calculations (DFT), which provide a quantum-mechanical description of the electronic energies and forces involved. In the case of molecular crystals, however, it is common practice to perform DFT calculations only for isolated molecules to estimate the vibrational properties and interpret the experimental data accordingly. This approach, unfortunately, has some pitfalls as long-range Coulomb forces and charge polarization induced by intermolecular interactions are not taken into account and the impact of hydrogen bonds on the molecular elastic constants is neglected.
In the low-wavenumber range, where lattice modes are expected, differences in the vibrational spectra are quite useful
in distinguishing among specific crystalline polymorphs.
However, using vibrational spectroscopy to identify a given structure turns out to be a significant challenge without the help
of X-ray measurements of reference samples. Bedoya-Martineź et al.16 have recently proposed to use DFT calculations combined with a many-body dispersion correction to diff
er-entiate two polymorphs of an organic molecule. As a matter of fact, the vibrational lattice modes of a molecular crystal are sensitive to the description of intermolecular interactions.17,18 Hybrid functionals without dispersion correction tend to underestimate low-wavenumber vibrational frequencies due to the overestimation of the unit cell lattice parameters. On the other hand, the inclusion of dispersion effects increases the
DFT-calculated vibrational wavenumbers, improving the comparison with experiment, remaining differences being
related to anharmonic effects, for example. Besides, the use of
an appropriate scale factor can eventually be implemented to improve the quality of DFT calculations for lattice modes in the solid state for weakly bound molecules.19 Vibrational frequencies obtained using DFT calculations do not match experimental vibrational wavenumbers mostly due to anharmo-nicity and basis set limitations. This can be corrected using a scaling factor which helps to improve a comparison.20 It is worth noting, however, that this scaling approach is often unable to depict the full spectral range. Anyway, by taking into account the nice agreement between our results and the experimental measurements in this work, we have decided to present them without any scaling correction.
The vibrational properties of molecules and crystals can be evaluated by combining experimental infrared and Raman spectra with theoretical results based on density functional theory (DFT) calculations.5,6 Quantum principles are applied to accurately describe molecular and condensed matter systems at a reasonable computational cost, being a powerful and very
reliable tool for molecular structure prediction, the description of chemical bonds, and the evaluation of optical, electronic, and vibrational properties such as the lattice dynamics of crystals.5−7
In the case of layered molecular crystals, such as H3BO3-2Aand -3Tpolymorphs, dispersive forces related to charge polarization induced by intermolecular interactions21,22and hydrogen bonds must be included in the DFT modeling approach. This is particularly relevant for the vibrational spectrum at low wavenumbers (ω < 200 cm−1), for which the intermolecular
forces are most relevant.
There are several studies on the infrared (IR) and Raman spectra14,15,23−28of molecular boric acid and their crystals. In
the theoretical domain, calculations for orthoboric acid have focused on the gas-phase boric acid molecule. Tian et al.29 performed a theoretical study on gas-phase molecular boric acid using various exchange-correlation functionals (LDA, GGA, and hybrid functionals), predicting the geometry, zero-point vibrational energies (ZPVEs), and harmonic infrared vibrational (IR) frequencies. Using GGA and hybrid functionals obtained good IR frequencies in comparison with experimental data. Zaki and Pouchan30obtained the IR intensities and vibrational frequencies of the orthoboric acid and six of its isotopomers through MP2 calculations, also presenting anharmonic corrections for the A′ mode. Andrews and Burkholder26 performed an argon matrix infrared study of molecular B(OH)3, applying self-consistent field calculations within the scope of a multibody perturbation theory to explain their experimentalfindings. Ogden and Young,31on the other hand,
characterized the molecular boric acid by mass spectrometry and matrix isolation infrared spectroscopy.
As the physical properties of boric acid in the solid state are still under debate, infrared and Raman spectroscopies emerge as very appropriate tools for nondestructive studies of this system. However, the existence of different but very similar
crystal polymorphs have led to some difficulties. Nevertheless,
the investigation of the vibrational properties of crystals has benefited from computational advances and sophisticated
improvements in DFT levels of calculations. As a matter of fact, the vibrational properties of complex structures such as organic molecules21,32and crystals33have been well elucidated with the assistance of DFT calculations. In particular, our research group has applied DFT calculations in the investigation of the vibrational spectra (infrared and Raman) of several solid-state systems.34−36
In this work, we measure the H3BO3-2A polymorph FTIR and Raman spectra and interpret the vibrational spectrum of boric acid molecules, 2D sheets, and both the H3BO3-2Aand H3BO3-3T polymorphs through DFT calculations within the generalized gradient approximation (GGA). Besides, a dispersion correction scheme was employed to better describe the interlayer van der Waals forces, which have allowed us to probe how distinct levels of intermolecular interactions affect
the vibrational spectra and normal mode assignments for the boric acid polymorphs. To the best of our knowledge, this is the
first time the results of such computations have been reported
in the literature. DFT calculations of the phonon dispersion and phonon density of states of the boric acid polymorphs were obtained. Finally, the DFT-calculated specific heat, Debye
temperature, enthalpy, and free energy and entropy of boric acid crystals are presented and discussed.
The Journal of Physical Chemistry A Article
DOI:10.1021/acs.jpca.7b10083
J. Phys. Chem. A2018, 122, 1312−1325
2. MATERIALS AND METHODS
2.1. IR and Raman Measurements. Polycrystalline powder of the H3BO3-2A polymorph was purchased from VETEC (99.5% purity) and used to perform FTIR and Raman spectroscopy measurements after its crystalline structure was confirmed through X-ray diffraction (the diffractogram is not
shown in this work). Fourier transform infrared (FTIR) spectra of the solid samples dispersed in KBr powder were obtained by using an FTIR ABB Bomen FTLA 2000-102 spectrometer at 4 cm−1resolution in the 400
−4000 cm−1range, accumulating 40
scans per spectrum. The Raman spectra were recorded using a T64000 Jobin Yvon triple spectrometer equipped with a nitrogen-cooled charge-coupled device (CCD) detector. A Nd:YAG laser excitation source at 532 nm with an output power of 40 mW was used to record the Raman spectrum from 70 to 4000 cm−1. The measurements were referenced to Si at
521 cm−1. Both the infrared and Raman spectra of the boric
acid sample were recorded at room temperature.
2.2. Crystallographic Properties of H3BO3-2A and
H3BO3-3T. The H3BO3-2A lattice parameters used as inputs for the DFT calculations were obtained from the X-ray diffraction measurements of Zachariasen.9On the other hand,
the H3BO3-3Tstructural parameters were retrieved from the X-ray diffraction data of Shuvalov et al.37Considering that the
X-ray data selected to be the input of the DFT computations and the best optimized geometries (GGA+TS, see Section 3) are very similar, it is very reasonable to believe that the simulations match the true ground state of the systems under study. Reinforcing this picture, the lack of imaginary vibrational frequencies in the IR and Raman calculations is a proof that the geometry optimization procedure has achieved the local minima of the total energy hypersurfaces. Therefore, if our
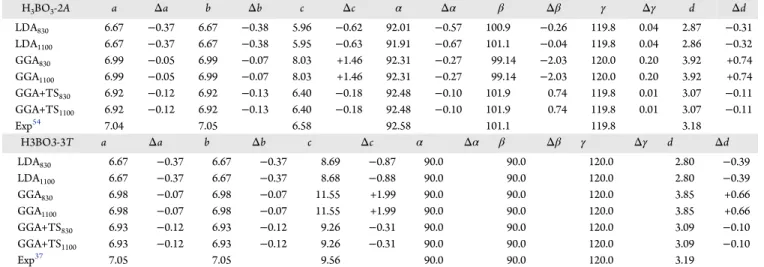
Table 1. Lattice Parameters and Planar Distances Calculated at the LDA, GGA, and GGA+TS Levels for Triclinic H3BO3-2A
and Trigonal H3BO3-3TPolymorphs
a
H3BO3-2A a Δa b Δb c Δc α Δα β Δβ γ Δγ d Δd
LDA830 6.67 −0.37 6.67 −0.38 5.96 −0.62 92.01 −0.57 100.9 −0.26 119.8 0.04 2.87 −0.31
LDA1100 6.67 −0.37 6.67 −0.38 5.95 −0.63 91.91 −0.67 101.1 −0.04 119.8 0.04 2.86 −0.32
GGA830 6.99 −0.05 6.99 −0.07 8.03 +1.46 92.31 −0.27 99.14 −2.03 120.0 0.20 3.92 +0.74
GGA1100 6.99 −0.05 6.99 −0.07 8.03 +1.46 92.31 −0.27 99.14 −2.03 120.0 0.20 3.92 +0.74
GGA+TS830 6.92 −0.12 6.92 −0.13 6.40 −0.18 92.48 −0.10 101.9 0.74 119.8 0.01 3.07 −0.11
GGA+TS1100 6.92 −0.12 6.92 −0.13 6.40 −0.18 92.48 −0.10 101.9 0.74 119.8 0.01 3.07 −0.11
Exp54 7.04 7.05 6.58 92.58 101.1 119.8 3.18
H3BO3-3T a Δa b Δb c Δc α Δα β Δβ γ Δγ d Δd
LDA830 6.67 −0.37 6.67 −0.37 8.69 −0.87 90.0 90.0 120.0 2.80 −0.39
LDA1100 6.67 −0.37 6.67 −0.37 8.68 −0.88 90.0 90.0 120.0 2.80 −0.39
GGA830 6.98 −0.07 6.98 −0.07 11.55 +1.99 90.0 90.0 120.0 3.85 +0.66
GGA1100 6.98 −0.07 6.98 −0.07 11.55 +1.99 90.0 90.0 120.0 3.85 +0.66
GGA+TS830 6.93 −0.12 6.93 −0.12 9.26 −0.31 90.0 90.0 120.0 3.09 −0.10
GGA+TS1100 6.93 −0.12 6.93 −0.12 9.26 −0.31 90.0 90.0 120.0 3.09 −0.10
Exp37 7.05 7.05 9.56 90.0 90.0 120.0 3.19
aLengthsa,b, andcare planar distancesdgiven in Å, while anglesα,β, andγare in degrees.
Figure 1.(a) Unit cell of the H3BO3-2Acrystal and (b) unit cell of H3BO3-3T: experimental interplanar distances are shown. (c) Four unit cells
GGA+TS best structures do not correspond to the true ground state of the boric acid polymorphs, they must be very close. On the other hand, the B(OH)3 molecular unit in the triclinic H3BO3-2Aand trigonal H3BO3-3Tpolymorphs has a structure that it is different from those in B(OH)3-water and B(OH)3
-protein systems due to their intermolecular interactions. However, the B(OH)3 molecular structures in interacting systems such as those cited (and others) were not considered in this paper since the focus here is on the vibrational properties of the isolated B(OH)3molecular unit and the H3BO3-2Aand H3BO3-3Tpolymorphs.
Table 1summarizes the main structural parameters of each polymorph, according to the results of our DFT energy convergence study in regard to several levels of calculations. The H3BO3-2Astructure has a primitive triclinic unit cell with space group symmetry P1¯ being formed by stacked H3BO3 displaced planes in the repeating sequence AB...,10 which are 3.18 Å apart as shown inFigure 1a. The H3BO3-3Tpolymorph is trigonal and has P32 symmetry, being formed by stacked displaced planes in the repeating sequence ABC...37 with an interplanar distance of 3.19 Å (seeFigure 1b). The atom labels used in this work are also depicted inFigure 1a−c. The boric
acid molecule in both polymorphs has its two boron atoms constrained to the same plane (average deviation from planarity smaller than 0.01 Å). The hydrogen bonds were labeled δ1
(H1···O1),δ2(H2···O2),δ3(H3···O3),δ4(H4···O4),δ5(H5···
O5), and δ6 (H6···O6), being formed between all of the
hydrogen atoms of each molecule. Atoms O1, O2, O4, and O6 are involved in intermolecular bonds, whereas the O3 and O5 atoms participate in intramolecular bonds. There are no interlayer bonds.
2.3. Computational Approach. The DFT plane-wave code CASTEP38,39was used to minimize the total energy of the H3BO3-2A and H3BO3-3T unit cells employing two different exchange-correlation functionals: the local density approxima-tion (LDA) parametrized according to Cerpeley−Alder−
Perdew−Zunger40,41 and the generalized gradient
approxima-tion (GGA) parametrized by Perdew, Burke, and Ernzerhof (PBE).42As pure DFT functionals cannot describe the van der Waals interactions between molecules, the dispersion energy correction scheme of Tkatchenko and Scheffler (TS)43,44was
taken into account. This scheme was chosen as it has predicted more accurate lattice parameters for the boric acid crystals than simulations performed by employing the method of Grimme et al.45 Norm-conserving pseudopotentials46 were adopted to represent the core electrons in each atomic species with valence configurations 2s22p1for boron and 2s22p4for oxygen. The unit
cells of the H3BO3-2Aand-3Tpolymorphs have, respectively, 128 electrons (32 core and 96 valence electrons) and 192 electrons (48 core and 144 valence electrons). A 2 ×2 × 3
Monkhorst−Pack47 sampling grid was employed to evaluate
integrals in reciprocal space.
Plane-wave basis energy cutoffs of 830 and 1100 eV were
selected for unit cell optimization by varying the lattice parameters, angles, and atomic positions. The geometry optimization convergence limits were set as follows: total energy variation smaller than 5.0× 10⁻⁶ eV/atom, maximum
force per atom below 1.0×10⁻²eV/Å, pressure smaller than
2.0 × 10⁻² GPa, and maximum atomic displacement smaller
than 1.0×10⁻⁴Å. Electronic self-consistency was achieved at
each optimization step when the total energy/atom and electronic eigenenergies vary by less than 5.0 × 10⁻⁷ and
1.250×10⁻⁸eV, respectively, within a convergence window of
three cycles. The structural results indicate that a plane-wave energy cutoffof 830 eV is enough to ensure good convergence
of the unit cell (see Table 1), as our research group has obtained for many other molecular crystals whose structural, optoelectronic, and vibrational properties were studied within the DFT scope.12,21,48The quality of this basis set was kept
fixed even as the unit cell volume varied during the geometry
optimization procedure. After finding the minimum-energy
structures, we obtained the infrared and Raman spectra as well as the phonon dispersion curves and the partial phonon density of states for the GGA+TS structure only, as well as the heat capacity at constant pressure, Debye temperature, and other thermodynamic properties. Linear-response calculations, yield-ing vibrational and dielectric properties of the boric acid structures investigated in this paper, were performed using density functional perturbation theory as described in the work by Baroni et al.49
2.4. Vibrational Mode Assigments. For the mode assignments of the boric acid structures, besides the lattice, libration, and translation modes found for low frequencies, the following convention was adopted to represent the normal modes:σ, scissors motion;ν, bond stretching; β, bending; ω, wagging; andτ, twisting. The s and a subscripts are employed to denote symmetric and antisymmetric displacements, and the out and in subscripts denote outward and inward motions with respect to a molecular plane.
3. RESULTS AND DISCUSSION
Table 1depicts the calculateda,b, andclattice parameters, the
α,β, andγunit cell angles, and the interplanar distance dfor the boric acid H3BO3-2Aand H3BO3-3Tlevels of calculation. The experimental data of Zachariasen9and Shuvalov et al.37are shown for the sake of comparison. One can observe that computations at the LDA level predict lattice parameters for H3BO3-2A that are significantly smaller than the X-ray diffraction data. In the case of a plane wave cutoff energy of
830 eV (1100 eV), the value ofcis 9.4% (9.6%) smaller than in the experiment, while the interplanar distance is almost 10% below the measured value; for H3BO3-3T something similar also occurs, with c being 9.1% (9.2%) lower. Using the pure GGA functional with a 830 eV (1100 eV) cutoffenergy, thec
parameter becomes too large (+22%) in comparison to the X-ray measurements for H3BO3-2A. For H3BO3-3T, the correspondingfigure was +21%. For both crystals, in addition,
a significant increase was observed in the interplanar distances
(above 20%). A comparison between the well-converged results for the LDA and GGA structural parameters reveals that the LDA functional, notwithstanding being less sophisticated, is able to predict more accurately the interplanar distance for both boric acid polymorphs (probably due to its natural trend to overestimate interatomic forces), while the GGA functional is more accurate for the description of in-plane features such as the formation of hydrogen bonds between the boric acid molecules.
By applying a dispersion correction to the GGA functional using the TS scheme, we obtain that the calculated structural characteristics improve significantly, with unit cell parameters
becoming slightly smaller than in the experiment (−1.6% for
lattice parameter a in H3BO3-2A and −3.1% for lattice
parameter c in H3BO3-3T). In this case, we also have the best estimate for the planar distances, with an error on the order of∼−0.1 Å. Using a 830 eV plane wave cutoffenergy, all
normal modes obtained for the crystal geometry of both H3BO3
The Journal of Physical Chemistry A Article
DOI:10.1021/acs.jpca.7b10083
J. Phys. Chem. A2018, 122, 1312−1325
polymorphs using the GGA+TS functional exhibited positive frequencies, indicating that a total energy local minimum was reached. Consequently, the converged unit cell parameters for the H3BO3-2Aand H3BO3-3Tcrystals considered in this work for the vibrational properties (including phonon dispersion curves/density of states and the thermodynamic property calculations) were evaluated at the GGA+TS830level.
The optimization results for the two-dimensional layers depicted in Figure 1c are presented in Table S1 of the Supporting Information. As a matter of fact, the unit cell of the 2D sheets exhibited lattice parametersaandb(anglesαandβ) differing by less than 1% (0.16 and 0.19%) from those of the
bulk boric acid polymorphs. The unit cell of the bidimensional layer contains two boric acid molecules positioned symmetri-cally, with the boron atoms being located at equivalent positions. The vertical distance between adjacent layers was set to 10 Å, which is large enough to be disregarded as weak van der Waals forces. It is clear fromFigure 1c that there are four hydrogen bonds connecting in-plane boric acid molecules. This layered molecular arrangement was shown to be
responsible for the electronic and optical anisotropies of the bulk H3BO3-2Aand trigonal H3BO3-3Tpolymorphs.12
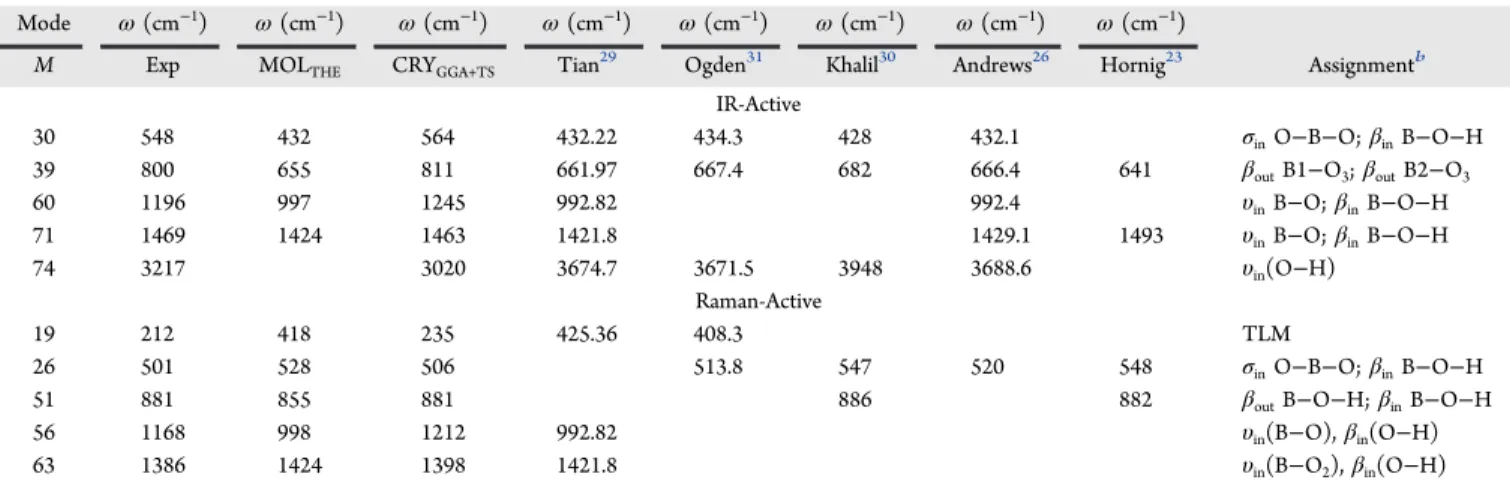
3.1. Vibrational Properties. Finding vibrational frequen-cies is computationally demanding, mostly if one uses last-generation exchange-correlation functionals.50 In our simu-lations, we have taken into account three systems: (i) a single H3BO3 molecule, (ii) a two-dimensional, infinite layer of H3BO3 molecules, and (iii) bulk crystals H3BO3-2A and H3BO3-3T. After optimizing their geometries, we evaluated the infrared and Raman spectra for each structure. The calculations for the single molecule and the two-dimensional layer were compared with the results of the bulk boric acid crystal to better distinguish molecular and in-plane features. Ten normal modes found for the molecule are presented in Table 2, while the 15 normal modes obtained for the two-dimensional layer are presented in Table 3. A detailed description of the vibrational modes for the H3BO3-2A bulk crystal is provided inTable 4, contrasting it with the previously published complete data of Medvedev,14 which have not reported four bands at 127, 210, 235, and 3020 cm−1. Two
low-frequency lattice modes, at 127 and 210 cm−1, were also Table 2. Normal Modes of a Single Boric Acid Molecule Theoretical (MOLTHE) According to the DFT-GGA+TS Approach
a
Mode ω(cm−1) ω(cm−1) ω(cm−1) ω(cm−1) ω(cm−1) ω(cm−1) ω(cm−1) ω(cm−1)
M Exp MOLTHE CRYGGA+TS Tian29 Ogden31 Khalil30 Andrews26 Hornig23 Assignmentb
IR-Active
30 548 432 564 432.22 434.3 428 432.1 σinO−B−O;βinB−O−H
39 800 655 811 661.97 667.4 682 666.4 641 βoutB1−O3;βoutB2−O3
60 1196 997 1245 992.82 992.4 υinB−O;βinB−O−H
71 1469 1424 1463 1421.8 1429.1 1493 υinB−O;βinB−O−H
74 3217 3020 3674.7 3671.5 3948 3688.6 υin(O−H)
Raman-Active
19 212 418 235 425.36 408.3 TLM
26 501 528 506 513.8 547 520 548 σinO−B−O;βinB−O−H
51 881 855 881 886 882 βoutB−O−H;βinB−O−H
56 1168 998 1212 992.82 υin(B−O),βin(O−H)
63 1386 1424 1398 1421.8 υin(B−O2),βin(O−H)
aExperimental results for the2Aboric acid crystal (CRY) are also shown for the sake of comparison. The EXP and CRY columns corresponds to the
experimental data and theoretical calculations for the bulk crystal in our work, while the mode column (m) indexes the single-molecule vibrations at increasing wavenumbers.bNormal modes:σ, scissors motion;ν, bond stretching;β, bending;ω, wagging;τ, twisting. Translatory lattice mode (TLM) and libration lattice mode (LLM). The s and a subscripts are employed to denote symmetric and antisymmetric.
Table 3. GGA+TS-2D Sheet Calculated Normal Modes and Assignments for an Infinite Two-Dimensional Boric Acid Sheeta
Mode ω(cm−1) ω(cm−1) Intensities
M (GGA+TS-2D) (EXP-bulk) IIR,t IR,t Assignment
1 120 121 0.0000 0.0002 τ(B-(OH)3)
2 204 186 0.0000 0.0002 β(B-(OH)3)
3 238 212 0.0000 0.0008 β(B-(OH)3)
4 507 501 0.0000 0.0026 σin(O1−B1−O2; O4−B2−O6),βin(B1−O2−H2; B2−O6−H6)
5 565 548 0.0729 0.0000 σin(O1−B1−O3; O4−B2−O6),βin(B1−O2−H2; B2−O5−H5)
6 652 648 0.0000 0.0001 βin(B1−O3),βout(B2−O3)
7 868 800 0.1386 0.0001 βout(O−H),υin(B−O)
8 877 881 0.0030 0.0008 τ(B-(OH)3)
9 1215 1168 0.0000 0.0014 υin(B1−O2; B1−O3; B2−O5; B2−O6),βin(B1−O1−H2; B2−O4−H4)
10 1249 1196 0.4224 0.0000 υin(B1−O1; B1−O3; B2−O4; B2−O5),βin(B1−O2−H2; B2−O6−H6)
11 1401 1386 0.0000 0.0049 υin(B1−O1; B1−O3; B2−O4; B2−O5),βin(B1−O2−H2; B2−O6−H6)
12 1462 1469 1.0000 0.0000 υin(B1−O1; B1−O3; B2−O4; B2−O5),βin(B1−O2−H2; B2−O6−H6)
13 2956 3166 0.0033 1.0000 υin(O−H)
14 3004 3217 0.0033 1.0000 υin(O−H)
15 3092 3243 0.0000 0.2254 υin(O−H)
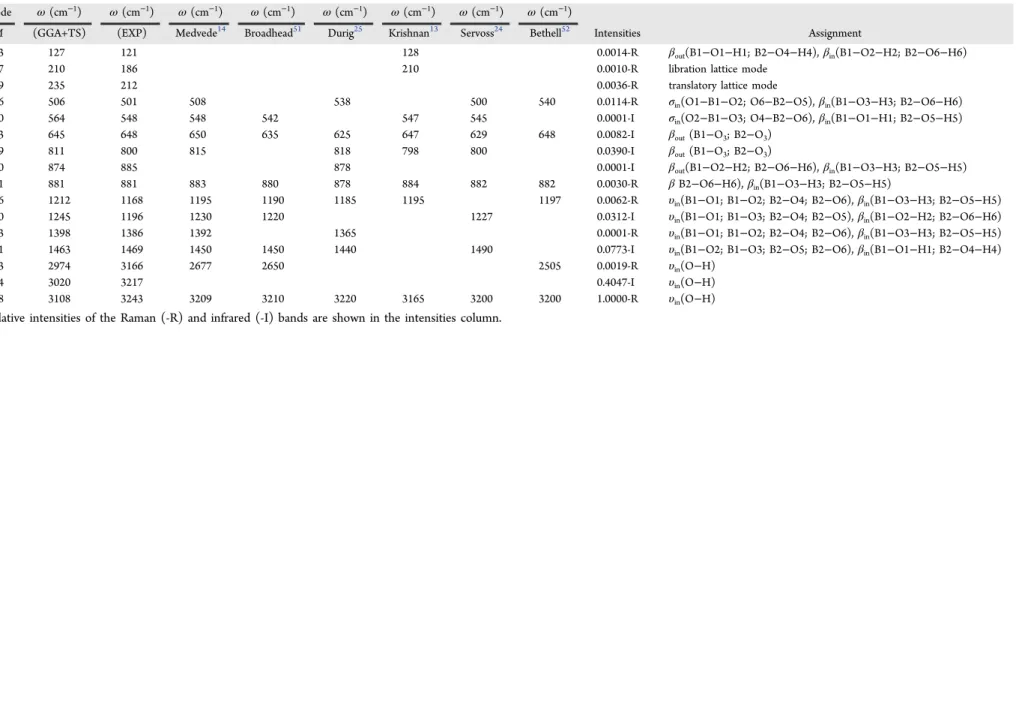
Table 4. Normal Modes Assigned to the Most Intense Infrared and Raman Peaks of the2A Boric Acid Crystal with Corresponding Assignments Using the DFT GGA+TS
Simulationsa
Mode ω(cm−1) ω(cm−1) ω(cm−1) ω(cm−1) ω(cm−1) ω(cm−1) ω(cm−1) ω(cm−1)
M (GGA+TS) (EXP) Medvede14 Broadhead51 Durig25 Krishnan13 Servoss24 Bethell52 Intensities Assignment
13 127 121 128 0.0014-R βout(B1−O1−H1; B2−O4−H4),βin(B1−O2−H2; B2−O6−H6)
17 210 186 210 0.0010-R libration lattice mode
19 235 212 0.0036-R translatory lattice mode
26 506 501 508 538 500 540 0.0114-R σin(O1−B1−O2; O6−B2−O5),βin(B1−O3−H3; B2−O6−H6) 30 564 548 548 542 547 545 0.0001-I σin(O2−B1−O3; O4−B2−O6),βin(B1−O1−H1; B2−O5−H5) 33 645 648 650 635 625 647 629 648 0.0082-I βout(B1−O3; B2−O3)
39 811 800 815 818 798 800 0.0390-I βout(B1−O3; B2−O3)
50 874 885 878 0.0001-I βout(B1−O2−H2; B2−O6−H6),βin(B1−O3−H3; B2−O5−H5) 51 881 881 883 880 878 884 882 882 0.0030-R βB2−O6−H6),βin(B1−O3−H3; B2−O5−H5)
56 1212 1168 1195 1190 1185 1195 1197 0.0062-R υin(B1−O1; B1−O2; B2−O4; B2−O6),βin(B1−O3−H3; B2−O5−H5) 60 1245 1196 1230 1220 1227 0.0312-I υin(B1−O1; B1−O3; B2−O4; B2−O5),βin(B1−O2−H2; B2−O6−H6) 63 1398 1386 1392 1365 0.0001-R υin(B1−O1; B1−O2; B2−O4; B2−O6),βin(B1−O3−H3; B2−O5−H5) 71 1463 1469 1450 1450 1440 1490 0.0773-I υin(B1−O2; B1−O3; B2−O5; B2−O6),βin(B1−O1−H1; B2−O4−H4)
73 2974 3166 2677 2650 2505 0.0019-R υin(O−H)
74 3020 3217 0.4047-I υin(O−H)
78 3108 3243 3209 3210 3220 3165 3200 3200 1.0000-R υin(O−H) aRelative intensities of the Raman (-R) and infrared (-I) bands are shown in the intensities column.
The
Journal
of
Physical
Chemistry
A
Article
DOI:
10.1021/acs.jpca.7b10083
J.
Phys.
Chem.
A
2018,
122,
1312
−
1325
observed. The first one was never described before in the
literature, while the latter was acknowledged by Krishnan.13 Other IR and Raman active modes and their respective assignments are included in theSupporting Information(Table S2).
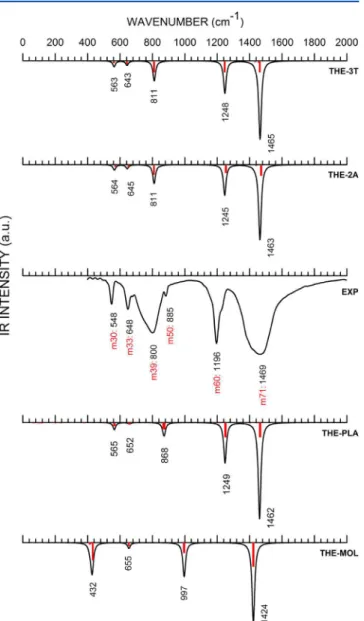
InFigure 2, one can see the infrared spectra in the 0−2000
cm−1wavenumber range for bulk H
3BO3-3T(theoretical,
THE-3T), bulk H3BO3-2A(theoretical, THE-2A, experimental EXP), a two-dimensional layer of H3BO3(theoretical, THE-PLA), and a single molecule (theoretical, THE-MOL). There is nice agreement between the main features of the experimental spectrum of the2Apolymorph and the calculated curve
THE-2Aspectrum. In the EXP case, a set of two broad absorption bands occur between 600 and 1000 cm−1 and between 1300
and 2000 cm−1. Thefirst region corresponds to bending normal
modes, while the second region originates mostly from bending and bond-stretching vibrations. The most intense maxima occur at∼1469 cm−1(EXP), 1463 cm−1(THE-2A), and 1465 cm−1
(THE-3T), as also found by Medvedev,14who, however, has
not made vibrational assignments. Broadhead,51Durig et al.,25 and Bethell52found, respectively, 1450, 1440, and 1490 cm−1
for the same peak, assigning it to a B−O stretch. However, our
theoretical result shows that this peak corresponds more precisely to υin (B−O) and βin (B−O−H) motions. Other
relevant peaks observed in the experimental curve occur at 548, 800, 1196, and 1469 cm−1, which match the GGA+TS
vibrations at 564 (σin O2−B1−O3; βin B1−O1−H1), 811
(βoutB1−O3; B2−O3), 1245 (υinB−O;βinB−O−H), and 1463
(υinB−O;βin B−O−H) cm−1for the2Apolymorph. The3T
polymorph spectral curve, on the other hand, follows very closely the2A polymorph spectrum, with differences equal to
or smaller than 3 cm−1. For the two-dimensional layer
(THE-PLA), there is a noticeable shift for the normal mode at 868 cm−1in comparison with its THE-2Acounterpart at 811 cm−1,
which corresponds to B−O bond stretching. We argue that the
interaction between the boric acid layers contributes to the decrease in the wavenumber of this vibration relative to that of the isolated two-dimensional sheet. Besides, the 2D peak at 868 cm−1 can also be related to the observed experimental
maximum at 885 cm−1. It is also worth remembering here
the works of Bethell52 and Krishnan,13 who attributed the fundamental vibrations of the boric acid crystal using a“ cell-layer-cell”containing two boric acid molecules withC6hcrystal site symmetry. The corresponding values calculated by them for the same peaks were 547 cm−1 (inactive) and 798 cm−1
(inactive). For the isolated boric acid molecule, the normal modes below 1000 cm−1are shifted downward in comparison
to those of the crystal and have fewer features in common with the latter (only four maxima can be discerned, while the theoretical curves exhibitfive). Overall, the data we present are
in agreement with other experimental reports32−37(seeTable 4) and surpass the quality of estimates which were performed using a more accurate exchange-correlation functional but without van der Waals corrections.29,30
Figure 3 shows the 0−2000 cm−1 Raman spectral curves
following the same scheme inFigure 2. One can see that the relative intensities of the peaks are in good agreement between the experimental and the THE-3T, THE-2A, and THE-PLA theoretical data. The most intense EXP Raman peak can be seen at 881 cm−1, being related to the theoretical normal mode
(for both the2A and3T polymorphs) at 881 cm−1(β HO),
which matches the 885 cm−1 peak identified in the infrared
spectra. It also presents two other significant peaks at 212 cm−1
(translation lattice mode) and 501 cm−1(σ
inOBO;βinBOH), which correspond to the THE-2Amaxima at 235 and 506 cm−1,
in this order. The calculation for the two-dimensional boric acid sheet, on the other hand, also nicely fits the experimental
Raman measurements, while the calculation for a single molecule mispredicts some important features, such as the absence of normal modes below 380 cm−1and the occurrence
of a normal mode at 998 cm−1, perhaps related to the
experimental normal mode at 1168 cm−1. An important feature
of the Raman spectra is the difference between the two active
lines with the smallest wavenumbers for the 3T and 2A
polymorphs, which are the only spectral features potentially useful in distinguishing between the two types of crystals. As a matter of fact, in the3Tpolymorph these peaks are observed at 111 and 201 cm−1; for the 2Apolymorph, they are observed at
larger wavenumbers, 127 and 210 cm−1, respectively, with
differences of 16 and 9 cm−1.
Moving now to the infrared spectra in the 2000−4000 cm−1
range (Figure 4), one can see just a set of normal modes
Figure 2. Infrared spectra of boric acid in the 0−2000 cm−1 range.
EXP: Experimental curve. Theoretical single molecule (THE-MOL),
two-dimensional plane (THE-PLA), H3BO3-2A (THE-2A), and
concentrated near 3000 cm−1for the THE-2A, -3T, and -PLA
spectra, while the single molecule shows a vibrational mode near 3700 cm−1. The EXP spectrum, on the other hand,
consists of a very broad peak centered at about 3200 cm−1,
which is assigned to the stretching of OH bonds. Krishnan13 reported this same band at 3210 cm−1 and During25at 3220
cm−1, both with the same vibrational assignment. Three small
bands can be seen in the experimental spectrum at 2262, 2364, and 2513 cm−1(see inset inFigure 4), which could be due to
invasive water molecules contaminating the samples. The larger differences observed between the peak wavenumbers of the
theoretical calculations above 3000 cm−1 versus the
exper-imental measurements (also observed inTables 3 and 4) are typical in DFT calculations for large wavenumbers, with discrepancies of 200 cm−1being common, requiring additional
corrections.53
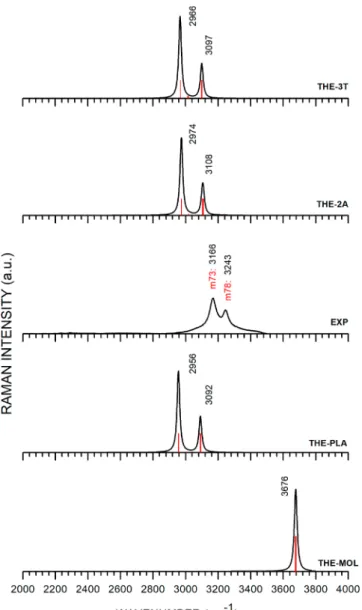
Concerning the Raman spectra in the 2000−4000 cm−1
range, (seeFigure 5), onefinds much less thermal broadening
than in the infrared absorption ofFigure 4. Two intense lines are clearly visible in the THE-2A/-3T/PLA data at wave-numbers of 2974, 2966, and 2956 cm−1(EXP: 3166 cm−1) and
at 3108, 3097, and 3092 cm−1 (EXP: 3243 cm−1). The
experimental peaks at 3166 and 3243 cm−1are due to OH bond
stretching vibrations. For comparison, Durig et al.25 also reported two rather strong Raman bands at 3168 and 3245 cm−1. In general, there is good agreement among various works
on the rather strong peaks found in the 3000 cm−lregion. The
calculation for a single molecule, incidentally, predicts a Raman peak at 3700 cm−1, which is observed but severely shifted in the
experimental data.
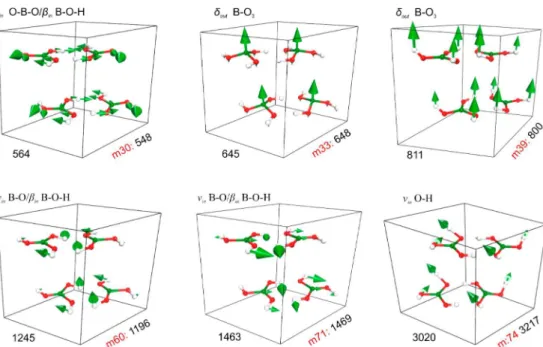
Atomic displacements for the most important vibrational modes contributing to the FTIR and Raman spectra of the2A
boric acid polymorph are shown in Figures 6 and 7, respectively. For the infrared absorption, the selected modes correspond to the experimental (EXP) wavenumbers of 548, 648, 800, 1196, 1469, and 3217 cm−1. In the Raman spectrum,
the EXP normal modes at 127, 212, 501, 881, 1168, and 1386 cm−1 are depicted. The green arrows reveal the atomic
displacements. Animation files depicting these displacements
are included in theSupporting Information.
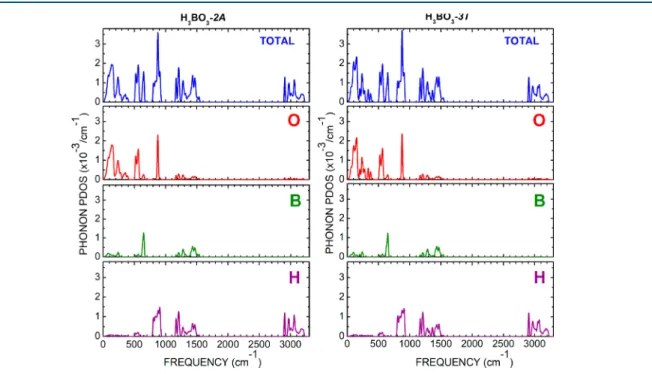
3.2. Phonon Dispersion and Density of States.Figure 8 shows the phonon dispersion curves for the H3BO3-2A (left)
Figure 3.Raman spectra of boric acid in the 0−2000 cm−1range. EXP:
Experimental curve. Theoretical single molecule (THE-MOL), two-dimensional plane (THE-PLA), H3BO3-2A(THE-2A), and H3BO3-3T
(THE-3T) DFT-GA+TS calculated curves are shown. Figure 4.Infrared spectra of the boric acid in the 2000−4000 cm
−1 range. EXP: Experimental curve. Theoretical single molecule
(THE-MOL), two-dimensional plane (THE-PLA), H3BO3-2A (THE-2A),
and H3BO3-3T(THE-3T) DFT-GA+TS calculated curves are shown.
The Journal of Physical Chemistry A Article
DOI:10.1021/acs.jpca.7b10083
J. Phys. Chem. A2018, 122, 1312−1325
and H3BO3-3T (right) polymorphs in the full 0−3200 cm−1
wavenumber range (top) and with a zoom in the 0−150 cm−1
range (bottom). The phonon dispersion for H3BO3-2Ain the smaller-wavenumber range is less dense than for the -3T
polymorph, as the latter has a more complex stacking pattern of molecular planes. The tree acoustic branches alongΓ→F and Γ→B (in H3BO3-2A) andΓ→F andΓ→K (in H3BO3-3T) behave in a similar fashion whereas the acoustic phonon branches along theΓ→Z andΓ→Q (for both polymorphs) directions display some anisotropy. At Z, the two transversal acoustic (TA) phonons have wavenumbers of 24.7 and 24.9 cm−1(in H
3BO3-2A) and 20.3 and 20.4 cm−1(-3T), while the longitudinal acoustic (LA) phonon wavenumber at the same point is 29.6 cm−1for the2Apolymorph and 21.6 cm−1for the 3Tsystem. As we approach the Q point, the wavenumbers for the TA branches reach 72.1 and 80.3 cm−1in the H
3BO3-2A polymorph. For the3T crystal, the corresponding figures are
61.4 and 70.3 cm−1. The longitudinal optical
−transverse optical
phonon splitting (labeled here as ΔLO−TO) calculated for H3BO3-2A was 0.4 cm−1, with the TO band at 82.5 cm−1
belonging to the Agirreducible representation (point groupCi), while the LO bands at 82.9 cm−1have and an A
u irreducible representation. The maximum of the TO branch is close to the F point, being approximately 98.3 cm−1, while the maximum of
the LO band reaches its peak value at the middle point of the F→ Γ segment (100.8 cm−1). In the case of the H3BO3-3T polymorph, we haveΔLO−TO(q= 0) = 21.8 cm−1between two
TO bands at 42.9 cm−1and a LO band at 64.7 cm−1. Figure 9shows the phonon density of states (DOS) total and per atom for both2A-and3T-boric acid polymorphs. For the wavenumber interval (0−200 cm−1), we have a broad band
related to oxygen, followed by set of structured narrow peaks between 200 and 400 cm−1 with a maximum at 250 cm−1,
followed by a gap between 400 and 500 cm−1. Other maxima in
the oxygen contribution occur at 523, 555, and 873 cm−1(the
largest DOS value). The boron and hydrogen atoms have smaller phonon DOS values than oxygen, with the boron atoms contributing more to the phonons near 640 (see alsoTable 3, which assigns an out-of-plane bending of the B1O3and B2O3 groups, in H3BO3-2A), 1250, and 1470 cm−1. On the other hand, the hydrogen atoms produce intense phonon DOS peaks between 800 and 900 cm−1and between 1100 and 1300 cm−1.
The large-wavenumber modes, starting near 3000 cm−1, are
mostly due to OH bond-stretching vibrations.
3.3. Entropy, Enthalpy, Free Energy, Specific Heat, and Debye Temperature. The following thermodynamic potentials were evaluated for the boric acid polymorphs using the phonon vibrational data: entropy times temperature (ST), enthalpy (H), and free energy (G=H−TS), as presented in
Figure 10. The 3T crystal shows the largest variation for all potentials as the temperature increases in comparison to that for H3BO3-2A. Looking to the enthalpy curves, we have, atT= 300 K, the following energies: 0.49 eV (11.30 kcal/mol) for H3BO3-2A and 0.73 eV (16.70 kcal/mol) for H3BO3-3T. Calculated values ofSTatT= 300 K are 1.00 eV (23.00 kcal/ mol) and 1.47 eV (34.06 kcal/mol) for the H3BO3-2A and H3BO3-3Tcrystals, respectively. The free energy is negative for both systems, with values of−0.48 eV (−11.12 kcal/mol) and −0.59 eV (−13.61 kcal/mol) at 300 K, respectively.
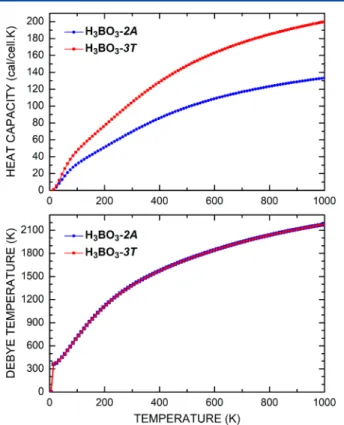
The constant-volume specific heatC
Vof the boric crystal as a function of temperatureTcan be estimated from the phonon density of states. In Figure 11, one can see the calculated constant-volume heat capacity of each crystal (CV, top) and the Debye temperature (TD, bottom) as a function of temperature (T). Between 0 and 100 K,CVdisplays a rapid increase for both forms of boric acid, with the curve for H3BO3-2A lagging behind the curve for the H3BO3-3Tcrystal. At 300 K, we have
CV= 70 cal/cell·K for the2Asystem and CV= 103 cal/cell·K for the3T. Between 100 and 600 K,CVgrows more smoothly than between 0 and 100 K within a practically linear regime, reaching 109 cal/cell·K (H3BO3-2A) and 163 cal/cell·K (H3BO3-3T) at T= 600 K. Above 600 K, the rate of increase ofCVbecomes even smaller, with maximum values of about 133 and 200 cal/cell·K at 1000 K for the2Aand 3Tpolymorphs, respectively.
At the bottom of Figure 11, one can see the Debye temperatureθDas a function of temperature T. IfθDis larger thanT, then all vibrational modes have the same energykBT
and the heat capacity of the crystal approaches a constant value. Otherwise, high-frequency normal modes are unoccupied and the heat capacity increases with the lattice temperatureT. The Debye temperature has a boost fromT = 0 to 13 K for both
Figure 5.Raman spectra of boric acid in the 2000−4000 cm−1range.
EXP: Experimental curve. Theoretical single molecule (THE-MOL),
two-dimensional plane (THE-PLA), H3BO3-2A (THE-2A), and
phases of boric acid, which also exhibit very similar behavior, reaching nearly 2200 atT= 1000 K.
4. CONCLUSIONS
In this work, we have presented experimental measurements of the infrared and Raman spectra of the H3BO3-2Acrystal and DFT calculations for the structural, vibrational, and thermody-namic properties for both H3BO3-2A and H3BO3-3T polymorphs. Unit cell optimizations were performed using the LDA and GGA exchange correlation functionals, with the latter including a semiempirical correction (TS) to take into account van der Waals interactions. The structural optimiza-tions for the 2A system at the GGA+TS level showed nice agreement with the lattice parameters obtained through X-ray
diffraction data, while the LDA (pure GGA)-optimized
structures exhibited lattice parameters much smaller (much larger) than experiment. For the sake of comparison, additional calculations were also performed for a single boric acid molecule and an infinite two-dimensional layer of boric acid
molecules resembling a single monolayer of each bulk crystal. In the wavenumber ranges of 400−2000 cm−1(IR) and 0−
1500 cm−1(Raman), there is good agreement between the
two-dimensional layer and bulk theoretical results in comparison to the experimental curves. Normal mode attributions were successfully achieved for each experimental infrared and Raman spectral feature through the DFT simulations, improving their interpretation in comparison with previous works.13,14,24,51,52Five measured infrared absorption maxima, at
Figure 6.Normal modes of the H3BO3-2Acrystal corresponding to the IR experimental absorption lines at 548, 648, 800, 1196, 1463, and 3217
cm−1with their respective assignments. ThemNnotation indicates normal mode indexNin the theoretical simulations.
Figure 7.Normal modes of the H3BO3-2Acrystal corresponding to the Raman experimental bands at 127, 212, 501, 881, 1168, and 1386 cm−1and
respective assignments. ThemNnotation indicates normal mode indexNin the theoretical simulations.
The Journal of Physical Chemistry A Article
DOI:10.1021/acs.jpca.7b10083
J. Phys. Chem. A2018, 122, 1312−1325
548, 648, 800, 1196, and 1469 cm−1, are closely matched by
their theoretical counterparts for the 2Acrystal, with predicted wavenumbers of 564, 645, 811, 1245, and 1463 cm−1, in the
same order. The largest error obtained was 49 cm−1, observed
for the theoretical mode at 1245 cm−1; the smallest error
occurred for the theoretical mode at 645 cm−1, with a red shift
of only 3 cm−1. On the other hand, the experimental infrared
peak at 885 cm−1 was related to the two-dimensional layer
mode at 868 cm−1. Our results show clearly that the infrared
spectrum of a single boric acid molecule is unable to describe the vibrational IR features of the crystal below 1400 cm−1. For
wavenumbers above 3000 cm−1, the theoretical absorption
bands for the 2Astructure are shifted by about−200 cm−1in
comparison with the experimental data. The Raman spectrum recorded for the H3BO3-2Asystem, an intense line at 881 cm−1, is accurately matched by the calculations for both2Aand 3T
systems, corresponding to BOH in-plane and out-of-plane bendings. Low-wavenumber Raman peaks below 300 cm−1are
accurately described by the simulations for the bulk crystals and
the two-dimensional layer, while the single-molecule simu-lation, as expected, does not show any feature in this range, which is dominated by lattice modes. The theoretical Raman curves in the 2800−3800 cm−1 range are red-shifted by
approximately 150 cm−1relative to the experimental spectrum.
The phonon dispersion curves reveal acoustic branches with some degree of anisotropy, especially along the directionsΓ→ Z andΓ→Q. In H3BO3-2A, a near crossing of the LA and TA2 curves occurs at the Q point, and the calculated LO−TO
splitting atq= 0 was 0.4 cm−1for H
3BO3-2Aand 21.8 cm−1for H3BO3-3T. The thermodynamic potentials for H3BO3-2A
qualitatively follow the curves for the3Tcrystal, but the latter exhibits larger increases (decreases) in entropy and enthalpy (free energy) as the temperature increases. The same trend is also observed for the constant-volume heat capacity, withCV= 70 and 103 cal/cell·K at 300 K for H3BO3-2Aand H3BO3-3T, respectively. The Debye temperature increases sharply fromT
= 0 to 13 K (T= 5.5 and 15.5 K) in H3BO3-2A(H3BO3-3T). For both materials, it reaches about 2200 K atT= 1000 K.
Figure 8.Phonon dispersion curves for the H3BO3-2A(left) and H3BO3-3T(right) crystals. Close-ups showing the dispersion in the 0−1.5×10²
cm−1wavenumber range are shown at the bottom.
Overall, the results presented here indicate that dispersion-corrected DFT is necessary to provide an accurate description of the vibrational properties of boric acid crystal polymorphs, including their infrared and Raman spectra. They also point out
that infrared vibrational spectroscopy measurements are unable to distinguish between the2Aand3Tpolymorphs of boric acid from the comparison of their lattice modes, as their most intense lines occur at very close wavenumbers (less than a 3 cm−1 difference between them). For the Raman spectra, in
contrast, there are two active lines below 250 cm−1which could
be used to distinguish between the two types of crystals. For the3Tsystem, these maxima are observed at 111 and 201 cm−1,
while for the 2A, case they occur at 127 and 210 cm−1, with
their differences being experimentally resolvable. Finally, the
heat capacity CV even at low temperatures for the 3T
polymorph is significantly larger than for the 2A system,
suggesting that thermodynamic measurements ofCVare able to identify the boric acid solid-state phase.
■
ASSOCIATED CONTENT*
S Supporting InformationThe Supporting Information is available free of charge on the ACS Publications websiteat DOI:10.1021/acs.jpca.7b10083.
Lattice parameters and planar distances calculated at the GGA+TS levels for boric acid two-dimensional layers (plane). Experimental (EXP) and theoretical (GGA+TS) normal modes with corresponding assignments for the
2Aboric acid crystal polymorphs (PDF).
Animation files depicting the atomic displacements
related to some assignments (ZIP).
■
AUTHOR INFORMATION ORCIDM. Bezerra da Silva:0000-0001-7941-3956
Notes
The authors declare the following competing financial
interest(s): CNPq projects 307843/2013-0 and 140898/2016-6. FUNCAP/CNPq PRONEX PR2-0101-0000140898/2016-6.01.00/15.
■
ACKNOWLEDGMENTSV.N.F., P.T.C.F., and E.W.S.C. are researchers from the Brazilian National Research Council (CNPq) and acknowledge thefinancial support received during the development of this
work from Brazilian Research Agency CNPq. E.W.S.C. and M.B.d.S. received financial support from CNPq projects
307843/2013-0 and 140898/2016-6, respectively. E.W.S.C. and P.T.C.F. also acknowledge PRONEX CNPq/FUNCAP.
■
REFERENCES(1) Farfan-García, E. D.; Castillo-Mendieta, N. T.; Cipré ́s-Flores, F. J.; Padilla-Martínez, I. I.; Trujillo-Ferrara, J. G.; Soriano-Ursúa, M. A. Current Data Regarding the Structure-Toxicity Relationship of Boron-Containing Compounds.Toxicol. Lett.2016,258, 115−125.
(2) Nielsen, F. H. Update on Human Health Effects of Boron.J.
Trace Elem. Med. Biol.2014,28(4), 383−387.
(3) Erdemir, A.; Bindal, C.; Zuiker, C.; Savrun, E. Tribology of
Naturally Occurring Boric Acid Films on Boron Carbide.Surf. Coat.
Technol.1996,86−87, 507−510.
(4) Wilder-Smith, A.; Murray; Quam, M. Epidemiology of Dengue: Past, Present and Future Prospects.Clin. Epidemiol.2013, 299.
(5) Benelli, G.; Mehlhorn, H. Declining Malaria, Rising of Dengue and Zika Virus: Insights for Mosquito Vector Control.Parasitol. Res.
2016,115(5), 1747−1754.
(6) Musso, D.; Gubler, D. J. Zika Virus.Clin. Microbiol. Rev.2016,29
(3), 487. Figure 10.Temperature times entropy, enthalpy, and free energy of
boric acid H3BO3-2A (top) and boric acid polymorph H3BO3-3T
(bottom).
Figure 11.Calculated constant-volume specific heat (top) and Debye
(bottom) temperature for H3BO3-2Aand3Tcrystals.
The Journal of Physical Chemistry A Article
DOI:10.1021/acs.jpca.7b10083
J. Phys. Chem. A2018, 122, 1312−1325
(7) Rotaru, P.; Scorei, R.; Hară ̆bor, A.; Dumitru, M. D. Thermal
Analysis of a Calcium Fructoborate Sample. Thermochim.
Thermo-chim. Acta2010,506(1−2), 8−13.
(8) Scorei, R. I.; Rotaru, P. Calcium FructoboratePotential Anti-Inflammatory Agent.Biol. Trace Elem. Res.2011,143(3), 1223−1238.
(9) Zachariasen, W. H. The Crystal Lattice of Boric Acid, BO3H3.Z.
Kristallogr. - Cryst. Mater.1934,88, 1−6.
(10) Dorset, D. L.; Dorset, D. L.; Tivol, W. F.; Turner, J. N.; Dorset, D. L. Dynamical Scattering and Electron Crystallography - Ab Initio
Structure Analysis of Copper Perbromophthalocyanine.Acta
Crystal-logr., Sect. A: Found. Crystallogr.1992,48(4), 562−568.
(11) Shuvalov, R. R.; Burns, P. C. A New Polytype of Orthoboric Acid, H 3BO3−3T.Acta Crystallogr., Sect. C: Cryst. Struct. Commun.
2003,59(6), i47−i49.
(12) da Silva, M. B.; dos Santos, R. C. R.; da Cunha, A. M.; Valentini, A.; Pessoa, O. D. L.; Caetano, E. W. S.; Freire, V. N. Structural, Electronic, and Optical Properties of Bulk Boric Acid 2A and 3T Polymorphs: Experiment and Density Functional Theory Calculations.
Cryst. Growth Des.2016,16(11), 6631−6640.
(13) Krishnan, K. The Raman Spectrum of Boric Acid.Proc. Indian
Acad. Sci. - Sect. A1963,57, 103−108.
(14) Medvedev, E. F.; Komarevskaya, A. S. IR Spectroscopic Study of the Phase Composition of Boric Acid as a Component of Glass Batch.
Glass Ceram.2007,64(1−2), 42−46.
(15) Ananthakrishnan, R. The Raman Spectra of Some Boron Compounds.Proc. Indian Acad. Sci. A1937,5, 200.
(16) Bedoya-Martínez, N.; Schrode, B.; Jones, A. O. F.; Salzillo, T.; Ruzie, C.; Demitri, N.; Geerts, Y. H.; Venuti, E.; Della Valle, R. G.;́
Zojer, E.; et al. DFT-Assisted Polymorph Identification from Lattice Raman Fingerprinting.J. Phys. Chem. Lett.2017,8(15), 3690−3695.
(17) Civalleri, B.; Zicovich-Wilson, C. M.; Valenzano, L.; Ugliengo, P. B3LYP Augmented With an Empirical Dispersion Term
(B3LYP-D*) as Applied to Molecular Crystals.CrystEngComm2008,10(4),
405−410.
(18) Van Troeye, B.; Torrent, M.; Gonze, X. Interatomic Force
Constants Including the DFT-D Dispersion Contribution.Phys. Rev.
B: Condens. Matter Mater. Phys.2016,93(14), 144304.
(19) Ennis, C.; Auchettl, R.; Appadoo, D. R. T.; Robertson, E. G. Density Functional Theory for Prediction of Far-Infrared Vibrational Frequencies: Molecular Crystals of Astrophysical Interest.Mon. Not. R. Astron. Soc.2017,471(4), 4265−4274.
(20) Scott, A. P.; Radom, L. Harmonic Vibrational Frequencies: An Evaluation of Hartree−Fock, Møller−Plesset, Quadratic Configuration
Interaction, Density Functional Theory, and Semiempirical Scale Factors.J. Phys. Chem.1996,100, 16502.
(21) Silva, A. M.; Costa, S. N.; Sales, F. A. M.; Freire, V. N.; Bezerra, E. M.; Santos, R. P.; Fulco, U. L.; Albuquerque, E. L.; Caetano, E. W. S. Vibrational Spectroscopy and Phonon-Related Properties of the
L-Aspartic Acid Anhydrous Monoclinic Crystal.J. Phys. Chem. A2015,
119(49), 11791−11803.
(22) Milman, V.; Refson, K.; Clark, S. J.; Pickard, C. J.; Yates, J. R.; Gao, S.-P.; Hasnip, P. J.; Probert, M. I. J.; Perlov, A.; Segall, M. D. Electron and Vibrational Spectroscopies Using DFT, Plane Waves and
Pseudopotentials: CASTEP Implementation. J. Mol. Struct.:
THEO-CHEM2010,954(1−3), 22−35.
(23) Hornig, D. F.; Plumb, R. C. Vibrational Spectra of Molecules and Complex Ions in Crystals. IX. Boric Acid.J. Chem. Phys.1957,26
(3), 637−641.
(24) Servoss, R. R.; Clark, H. M. Vibrational Spectra of Normal and Isotopically Labeled Boric Acid.J. Chem. Phys. 1957,26(5), 1175−
1178.
(25) Durig, J. R.; Green, W. H.; Marston, A. L. The Low-Frequency Vibrations of Molecular Crystals. IV. Boric Acid.J. Mol. Struct.1968,2
(1), 19−37.
(26) Andrews, L.; Burkholder, T. R. Infrared Spectra of Molecular
B(OH)3 and HOBO in Solid Argon.J. Chem. Phys.1992,97(10),
7203−7210.
(27) Mitra, S. M. Boric Acid.Indian J. Phys.1938,12, 9.
(28) Venkateswaran, C. S. The O-H Raman Frequency in Inorganic Acids.Nature1937,140(3534), 151−151.
(29) Tian, S. X.; Xu, K. Z.; Huang, M.-B.; Chen, X. J.; Yang, J. L.; Jia, C. C. Theoretical Study on Infrared Vibrational Spectra of Boric-Acid
in Gas-Phase Using Density Functional Methods. J. Mol. Struct.:
THEOCHEM1999,469(1−3), 223−227.
(30) Zaki, K.; Pouchan, C. Vibrational Analysis of Orthoboric Acid H3BO3 from Ab Initio Second-Order Perturbation Calculations.
Chem. Phys. Lett.1995,236(1−2), 184−188.
(31) Ogden, J. S.; Young, N. A. The Characterisation of Molecular Boric Acid by Mass Spectrometry and Matrix Isolation Infrared Spectroscopy.J. Chem. Soc., Dalton Trans.1988,6, 1645.
(32) Hetmańczyk, J.; Hetmańczyk,Ł.; Migdał-Mikuli, A.; Mikuli, E. Vibrational and Reorientational Dynamics, Crystal Structure and Solid-Solid Phase Transition Studies in [Ca(H 2 O) 6 ]Cl 2 Supported by Theoretical (DFT) Calculations.J. Raman Spectrosc.2016,47(5), 591−601.
(33) Aliatis, I.; Lambruschi, E.; Mantovani, L.; Bersani, D.; Ando, S.;̀
Diego Gatta, G.; Gentile, P.; Salvioli-Mariani, E.; Prencipe, M.; Tribaudino, M.; et al. A Comparison between Ab Initio Calculated and
Measured Raman Spectrum of Triclinic Albite (NaAlSi 3 O 8). J.
Raman Spectrosc.2015,46(5), 501−508.
(34) Silva, A. M.; Costa, S. N.; Silva, B. P.; Freire, V. N.; Fulco, U. L.; Albuquerque, E. L.; Caetano, E. W. S.; Maia, F. F. Assessing the Role of Water on the Electronic Structure and Vibrational Spectra of
Monohydrated L-Aspartic Acid Crystals.Cryst. Growth Des.2013,13
(11), 4844−4851.
(35) Costa, S. N.; Freire, V. N.; Caetano, E. W. S.; Maia, F. F.; Barboza, C. A.; Fulco, U. L.; Albuquerque, E. L. DFT Calculations with van Der Waals Interactions of Hydrated Calcium Carbonate Crystals CaCO3 (H2O, 6H2O): Structural, Electronic, Optical, and Vibrational Properties.J. Phys. Chem. A2016,120(28), 5752−5765.
(36) Bezerra Neto, J. R.; de Lima Neto, P.; Sales, F. A. M.; da Silva, E. E.; Ladeira, L. O.; Freire, V. N.; Caetano, E. W. S. Phosphate Group
Vibrational Signatures of the Osteoporosis Drug Alendronate. J.
Raman Spectrosc.2014,45(9), 801−806.
(37) Shuvalov, R. R.; Burns, P. C. A New Polytype of Orthoboric
Acid, H3BO3−3T1. Acta Crystallogr. Sect. C Cryst. Struct. Commun.
2003,34, doi:10.1002/chin.200339006.
(38) Clark, S. J.; Segall, M. D.; Pickard, C. J.; Hasnip, P. J.; Probert, M. I. J.; Refson, K.; Payne, M. C. First Principles Methods Using CASTEP.Z. Kristallogr. - Cryst. Mater.2005,220(5/6), 567−570.
(39) Segall, M. D.; Lindan, P. J. D.; Probert, M. J.; Pickard, C. J.; Hasnip, P. J.; Clark, S. J.; Payne, M. C. First-Principles Simulation:
Ideas, Illustrations and The CASTEP Code.J. Phys.: Condens. Matter
2002,14(11), 2717−2744.
(40) Perdew, J. P.; Zunger, A. Self-Interaction Correction to
Density-Functional Approximations for Many-Electron Systems.Phys. Rev. B:
Condens. Matter Mater. Phys.1981,23(10), 5048−5079.
(41) Perdew, J. P. Density-Functional Approximation for the
Correlation Energy of the Inhomogeneous Electron Gas.Phys. Rev.
B: Condens. Matter Mater. Phys.1986,33(12), 8822−8824.
(42) Perdew, J. P. J.; Burke, K.; Ernzerhof, M. Generalized Gradient
Approximation Made Simple.Phys. Rev. Lett.1996,77(18), 3865−
3868.
(43) Tkatchenko, A.; Scheffler, M. Accurate Molecular Van Der Waals Interactions from Ground-State Electron Density and
Free-Atom Reference Data.Phys. Rev. Lett.2009,102(7), 073005.
(44) Tkatchenko, A. Current Understanding of van Der Waals Effects in Realistic Materials.Adv. Funct. Mater.2015,25, 2054−2061.
(45) Grimme, S.; Hansen, A.; Brandenburg, J. G.; Bannwarth, C. Dispersion-Corrected Mean-Field Electronic Structure Methods.
Chem. Rev.2016,116, 5105−5154.
(46) Lin, J. S.; Qteish, A.; Payne, M. C.; Heine, V.; Lin, A.; Qteish, M. C. P.; Lin, J. S.; Qteish, A.; Payne, M. C.; Heine, V. Optimized and Transferable Nonlocal Separable Ab Initio Pseudopotentials.Phys. Rev. B: Condens. Matter Mater. Phys.1993,47, 4174−4180.
(48) Araújo-Filho, A. A.; Silva, F. L. R.; Righi, A.; Silva, M. B. da; Silva, B. P.; Caetano, E. W. S.; Freire, V. N. Structural, Electronic and Optical Properties of Monoclinic Na2Ti3O7 from Density Functional Theory Calculations: A Comparison With XRD and Optical Absorption Measurements.J. Solid State Chem.2017,250, 68−74.
(49) Baroni, S.; de Gironcoli, S.; Dal Corso, A.; Giannozzi, P. Phonons and Related Crystal Properties From Density-Functional Perturbation Theory.Rev. Mod. Phys.2001,73(2), 515−562.
(50) Bloino, J.; Biczysko, M.; Santoro, F.; Barone, V. General Approach to Compute Vibrationally Resolved One-Photon Electronic Spectra.J. Chem. Theory Comput.2010,6(4), 1256−1274.
(51) Broadhead, P.; Newman, G. A. The Vibrational Spectra of
Orthoboric Acid and Its Thermal Decomposition Products. J. Mol.
Struct.1971,10(2), 157−172.
(52) Bethell, D. E.; Sheppard, N. The Infra-Red Spectrum and Structure of Boric Acid.Trans. Faraday Soc.1955,51, 9.
(53) Sibaev, M.; Crittenden, D. L. Quadratic Corrections to
Harmonic Vibrational Frequencies Outperform Linear Models. J.
Phys. Chem. A2015,119(52), 13107−13112.
(54) Zachariasen, W. H. The Precise Structure Boric Acis.pdf.Acta
Crystallogr.1954,7, 305−310.
The Journal of Physical Chemistry A Article
DOI:10.1021/acs.jpca.7b10083
J. Phys. Chem. A2018, 122, 1312−1325