A combined experimental (IR, Raman and UV
–
Vis) and quantum
chemical study of canadine
Bhawani Datt Joshi
a,b,⁎
, Anubha Srivastava
c, Poonam Tandon
c,⁎⁎
, Sudha Jain
d, A.P. Ayala
b aDepartment of Physics, Siddhanath Sc. Campus, Tribhuvan University, 10406, NepalbDepartamento de Fisica, Universidate Federal do Ceará, C. P. 6030, 60.455-900, Fortaleza, CE, Brazil
cDepartment of Physics, University of Lucknow, University Road, Lucknow 226 007, Uttar Pradesh, India d
Department of Chemistry, University of Lucknow, University Road, Lucknow 226007, Uttar Pradesh, India
a b s t r a c t
a r t i c l e
i n f o
Article history:
Received 9 February 2017
Received in revised form 3 September 2017 Accepted 3 October 2017
Available online 4 October 2017
Plant based natural products cover a major sector of the medicinalfield, as such focus on plant research has been increased all over the world. As an attempt to aid that research, we have performed structural and spectroscopic analysis of a natural product, an alkaloid: canadine. Bothab initioHartree-Fock (HF) and density functional theory (DFT) employing B3LYP using 6-311++G(d,p) basis set were used for the calculations. The calculated vibration-al frequencies were scvibration-aled and compared with the experimentvibration-al infrared and Raman spectra. The complete vibra-tional assignments were made using potential energy distribution. The structure-activity relation has also been interpreted by mapping electrostatic potential surface and evaluating the reactivity descriptors, which are valu-able information for quality control of medicines and drug-receptor interactions. Natural bond orbital analysis has also been performed to understand the stability and hyperconjugative interactions of the molecule. Further-more, UV–Vis spectra have been recorded in an ethanol solvent (EtOH) and the electronic property has been an-alyzed employing TD-DFT for both gaseous and solvent phase. The HOMO and LUMO calculation with their energy gap show that charge transfer occurs within the molecule. Additionally, the nonlinear optical properties of the title compound have been interpreted that predicts it's the best candidate for the NLO materials.
© 2017 Elsevier B.V. All rights reserved.
Keywords:
CAD
Ab initio
DFT
Vibrational spectroscopy NBO
NLO properties
1. Introduction
Literature reveals the traditional use of medicinal herb Goldenseal (Hydrastis canadensisL., belonging to the genus, Menispermaceae) for mild pathological conditions such as gastritis, colitis, duodenal ulcers, loss of appetite, and liver disease[1–3]. Benzylisoquinoline alkaloids viz.; berberine,β-hydrastine, canadine, and canadaline have active com-ponents of Goldenseal. Canadine (CAD) possesses ventricular anti-fibrillatory effects (that may be attributed to its blockade of Na+, K+, and Ca2+currents)[4], a potent inhibitor of platelet aggregation (
in vitroandin vivotriggered by ADP, collagen, and arachidonic acid), and promising antithrombotic drug[5]. Having non-quaternary nitrogen and two non-aromatic rings, it has an antioxidant activity[6], and display very low cytotoxicity[7]. Algarra et al.[8]analyzed different separation techniques for CAD alkaloid in goldenseal extracts. Also, Pingali et al.[3] determined the crystalline structure of canadine molecule by single crys-tal diffraction technique. Its chemical structure is shown in theFig. 1(a).
Spectroscopic techniques, when combined with the quantum chemi-cal chemi-calculations, are emerging as one of the most valuable methods for studying the structural behavior and to gain insight into the electronic structures of alkaloids at microscopic level[9,10]. As the natural products show a diversity of chemical structures, in the recent years there has been increasing interest in the application ofab initiocalculations to alkaloids as demonstrated in our earlier studies[9,11,12]as well as in others[13– 16]. The theoretical investigations on the molecular properties can facili-tate the solutions confronted in the experimental techniques.
A literature search reveals that neither the experimental infrared, Raman, and UV–Vis spectral analyses nor the theoretical calculations on molecular geometry, vibrational modes, natural bond orbital (NBO) and nonlinear optical (NLO) properties of the title molecule has been in-vestigated so far. We would like to eliminate this deficiency observed in the literature. The main objective of this study is to investigate the structural and electronic properties of the title compound with the help of vibrational spectroscopic techniques and quantum mechanical calculations using bothab initioHartree-Fock (HF) and the density func-tional theory (DFT)[17]. To understand the various conjugative and hyperconjugative interactions as well intermolecular interactions that would form the H-bonded network within the molecule, natural bond orbital (NBO) analysis has been performed. Also, to interpret the struc-tural-activity relationship and reactive sites of the molecule, molecular ⁎ Correspondence to: B.D. Joshi, Department of Physics, Siddhanath Sc. Campus,
Tribhuvan University, 10406, Nepal.
⁎⁎Corresponding author.
E-mail addresses:[email protected],[email protected](B.D. Joshi),
[email protected](P. Tandon).
https://doi.org/10.1016/j.saa.2017.10.008
electrostatic potential (MEP) and reactivity descriptors have been calcu-lated. Further, the nonlinear (NLO) property reveals that the title com-pound can be used as a good NLO material.
2. Experimental Details
Infrared spectra of CAD were recorded on a Bruker TENSOR 27 FT-IR spectrometer with a spectral resolution of 4 cm−1in the region 300
–
4000 cm−1. Pellets of solid samples were prepared from mixtures of KBr and the sample in 200:1 ratio using a hydraulic press.
The Raman spectra were recorded using an efficient visible Raman setup, Ar-514 nm, and 12 mW, at room temperature. An excitation laser of wavelength 514 nm was emitted from an Argon ion laser source with a power of 12 mW was used to record the vibrational spectra. The scattered Raman light was collected in a back scattering geometry using a microscope objective (ULW ×50). The scattered light was dispersed using a monochromator with 1200 grooves/mm diffraction grating, and an entrance slit width of 200μm. The Raman signals were detected using liquid nitrogen cooled charged coupled device (CCD) with an op-timal sensitivity in the visible range. The total exposure time for each sample was 5 s and averaged overfive accumulations.
The ultraviolet absorption spectra of the molecule were examined in the range 200–800 nm using a Varian - Cary 50 Bio, UV–Vis
Spectropho-tometer equipped with a 10 mm quartz cell. The UV pattern is taken from a 1 × 10⁻⁵M solution of CAD, dissolved in ethanol at 20 °C.
3. Computational Details
The molecular structure, vibrational frequencies, and energies of the CAD were computed employing the DFT[17]method using Gaussian 09
program[18]package and Becke's three parameters (local, non-local, Hartree-Fock) hybrid exchange functional with Lee-Yang-Parr correla-tion funccorrela-tional (B3LYP)[19–21]. First, the B3LYP/6-311++G(d,p) level of theory has been used for optimization protocol. Using these op-timized parameters, the vibrational frequencies have been calculated at same level theory, which were used further for the spectra simulation. The split valence basis set 6-311++G(d,p)[22,23]augmented by‘d’
polarization functions on heavy atoms and‘p’polarization functions on hydrogen atoms as well as diffuse functions for both hydrogen and heavy atoms[23,24]have been used. The absolute Raman intensities and infrared absorption intensities were calculated in the harmonic ap-proximation at the same level of theory as used for the optimized geom-etries. The vibrational assignments of normal modes were performed and the PED was calculated employing Gar2ped program[25]along with the internal coordinates using localized symmetry. For this pur-pose, a complete set of 132 internal coordinates were defined using Pulay's recommendations[26,27].
The graphical representation of the calculated Raman and IR spectra were made using GaussView program[28]. Visualization and confi rma-tion of calculated data were done by using the Chemcraft program[29]. Isoelectronic molecular electrostatic potential surface (MEP) was mapped with GaussView program[28]using B3LYP/6-311++G(d,p) basis. Mulli-ken atomic charges, HOMO–LUMO gap (∆E), ionization potential, dipole moments and total energy have also been obtained for the optimized ge-ometry. A theoretical time dependent density functional theory (TD-DFT) [23,24]method was used to calculate the electronic absorption parame-ters in the gas phase, employing 6-31G basis set and the solvent effects (in EtOH solvent) were taken into account by means of integral equation formalism polarizable continuum model (IEF-PCM)[30–32]. NBO[17] analysis, which deals about the intra- and intermolecular charge
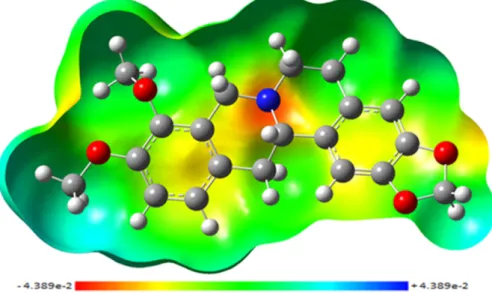
Fig. 2.MEP mapped (from−4.389e-2 to +4.389e-2).
Fig. 1.(a). Chemical structure of CAD. (b). Optimized structure of CAD.
delocalization between the bonds of a molecular system, has been per-formed at the DFT/B3LYP level of theory. Further, the reactivity descrip-tors have been calculated using B3LYP/6-31G(d,p) basis.
state optimized structure of the molecule is presented inFig. 1(b). The optimized structure is remarkably similar to the experimental one[3]. Both the optimized and experimental molecular conforma-tions were compared by superimposing them using a least-square al-gorithm that minimizes the distance between the corresponding non hydrogen atoms, as shown in Fig. S1 (Supplementary material). For clarity, all the hydrogen atoms are removed. The good agreement between the optimized and the experimental structure show that the optimized structure makes a replica of the experimentally ob-served conformation.
The relative energies of the molecule are calculated employingab initio HF and DFT functional. The energy calculated by DFT (− 709,572.532 kcal/mol) is lower, showing more stability, than the one calculated by HF (−705,094.857 kcal/mol). The enthalpy differ-ence between these two theories is 17.586 kcal/mol. A comparison of the optimized values of structural parameters (bond length, bond angle and torsion angle) with the observed values is given in Table S1 (Supplementary material).In general, the bond lengths do not dif-fer byN0.02 Å, except the bonds O1-C18 and O3-C9, which differ by
0.06/0.07 and 0.015/0.03 Å in the DFT/HF, respectively. The bond an-gles do not differ by more than 3°, except the anan-gles C9-O3-C19 and C6-N1-C15, which differ by 4.4/4.6° and 2.9/3.3° in the DFT/HF. Sim-ilarly, the dihedral angles do not differ by more than 10°, except the angles C20-O4-C10-C9, C20-O4-C10-C11, and C7-N1-C15-C14, which differ by 13.8/12.2°, 14.7/12.4° and 9.8/10.4 in the DFT/HF, respectively.
Table 2
Atomic charges (in esu), Fukui functions (f+k,f −
k); Local softness (s+k,s −
k)); and local electrophilicity indices (ω+k,ω −
k)); in eV for atomic sites, using Hirshfeld population analysis at
B3LYP/6-31G(d,p) level.
s Hirshfeld atomic charges Fukui functions Local softness Local electrophilicity indices
qN qN + 1 qN-1 f+k f
−
k s+k s −
k ω+k ω −
k
1 O −0.165488 −0.122057 −0.180717 0.043431 0.015229 0.059801 0.020969 0.058922 0.020661 2 O −0.164636 −0.114692 −0.185035 0.049944 0.020399 0.068769 0.028088 0.067759 0.027675 3 O −0.169553 −0.144161 −0.176066 0.025392 0.006513 0.034963 0.008968 0.034449 0.008836 4 O −0.148781 −0.107017 −0.150034 0.041764 0.001253 0.057506 0.001725 0.056661 0.001700 1 N −0.120830 −0.083205 −0.121785 0.037625 0.000955 0.051807 0.001315 0.051046 0.001296 1C 0.233609 0.302269 0.167463 0.068660 0.066146 0.094539 0.091078 0.093150 0.089740 2C 0.052989 0.092700 0.009552 0.039711 0.043437 0.054679 0.059809 0.053876 0.058931 3C −0.008032 0.038037 −0.116305 0.046069 0.108273 0.063433 0.149083 0.062501 0.146893 4C −0.015226 0.019149 −0.033162 0.034375 0.017936 0.047332 0.024696 0.046636 0.024334 5C 0.018291 0.063392 −0.022792 0.045101 0.041083 0.062100 0.056568 0.061188 0.055737 6C 0.052459 0.097040 0.010711 0.044581 0.041748 0.061384 0.057484 0.060483 0.056639 7C 0.059514 0.100245 0.003940 0.040731 0.055574 0.056083 0.076521 0.055259 0.075397 8C −0.020745 −0.013799 −0.045168 0.006946 0.024423 0.009564 0.033628 0.009424 0.033134 9C 0.052690 0.089556 0.005925 0.036866 0.046765 0.050761 0.064392 0.050016 0.063446 10C 0.059311 0.096577 0.035486 0.037266 0.023825 0.051312 0.032805 0.050558 0.032323 11C −0.034798 0.007966 −0.105321 0.042764 0.070523 0.058882 0.097104 0.058018 0.095678 12C −0.014170 0.044029 −0.106163 0.058199 0.091993 0.080135 0.126667 0.078958 0.124806 13C −0.020859 0.004017 −0.032678 0.024876 0.011819 0.034252 0.016274 0.033749 0.016035 14C 0.016552 0.057367 −0.018815 0.040815 0.035367 0.056199 0.048697 0.055373 0.047982 15C 0.048796 0.089400 0.024872 0.040604 0.023924 0.055908 0.032941 0.055087 0.032457 16C −0.017853 0.011469 −0.040174 0.029322 0.022321 0.040374 0.030734 0.039781 0.030283 17C −0.007228 0.023172 −0.105810 0.0304 0.098582 0.041858 0.135739 0.041243 0.133745 18C 0.052136 0.084925 0.019574 0.032789 0.032562 0.045148 0.044835 0.044485 0.044177 19C 0.118028 0.162462 0.051688 0.044434 0.06634 0.061182 0.091345 0.060283 0.090003 20C 0.143607 0.200949 0.088600 0.057342 0.055007 0.078955 0.075740 0.077795 0.074628
–
σ*C7–H8 0.03865 8.39 0.65 0.067
σC16–C17 1.9644 σ*O1–C18 0.02870 6.17 1.01 0.071
σC3–C4 1.96576 σ*O2–C2 0.02884 6.37 1.01 0.072
σC17–C18 1.97090 σ*C2–C18 0.03844 5.15 1.29 0.073
σC2–C18 1.97304 σ*C2–C3 0.36557 5.08 1.29 0.072
πC4–C16 1.69172 π*C17–C18 0.36546 18.46 0.27 0.064
π*C2–C3 0.36557 18.09 0.27 0.064
πC12–C13 1.67477 π* C8–C9 0.37837 21.56 0.28 0.07
π*C10–C11 0.40903 19.44 0.27 0.066
πC8–C9 1.67004 π*C12–C13 0.36307 19.33 0.30 0.068
π*C10–C11 0.40903 21.31 0.28 0.070
πC17–C18 1.71465 π*C4–C16 0.34877 17.72 0.32 0.068
π*C2–C3 0.36557 19.59 0.30 0.070
πC2–C3 1.71267 π*C4–C16 0.34877 18.38 0.32 0.069
π*C17–C18 0.36546 19.56 0.30 0.069
πC10–C11 1.68223 π*C12–C13 0.36307 19.48 0.31 0.070
π*C8–C9 0.37837 17.13 0.30 0.065
π*C17–C18 0.36546 π*C4–C16 0.34877 137.61 0.02 0.080 π*C2–C3 0.36557 π*C4–C16 0.34877 141.91 0.02 0.08
π*C10–C11 0.40903 π*C12–C13 0.36307 159.12 0.02 0.081
π*C8–C9 0.37837 228.59 0.01 0.082 Energy E(2)≥5 kcal/mol is assigned.
aE(2)means energy of hyper conjugative interaction (stabilization energy). b Energy difference between donor and acceptor
iandjNBO orbitals.
4.2. Molecular Electrostatic Potential (MEP) Surface
The MEP provides a visual method to understand the sites of the rel-ative charge distribution in a molecule[12,24]. In the generated surface, negative electrostatic potential colored in shades red, whereas, positive one colored in the shades of blue. A molecule shows its non-polar be-havior if the surface is largely white or lighter color shades. Potential in-creases in the order redborangebyellowbgreenbblue. The MEP of
CAD mapped using the DFT/6-311++G (d,p) output is shown in the Fig. 2. The highest negative potential with red blobs is visible over the regions near nitrogen in ring and oxygen atoms of methoxy groups. The yellowish blob reflects less negative potential, is visible over the ox-ygen atoms of ring R1. A positive charge is localized near the hydrogen atoms of the methyl group. The value of Mulliken charges is presented in the Table S2 (Supplementary material).
4.3. Natural Bond Orbital (NBO) Analysis
NBO analysis is one of the efficient method for studying hybridiza-tion, conjugative interactions, covalence effects and charge transfer in polyatomic wave functions[11,12]. The information from the first-order density matrix of theab initiocalculations develops a unique set of atomic hybrids and bond orbitals, which leads to“Lewis structure”. It helps in the investigation of intra- and intermolecular interactions among bonds. In the present work, utilizing the second-order micro-disturbance theory analysis, we have accounted some of the electron ac-ceptors, donor orbitals and the interacting stabilization energy, E(2). The hyperconjugative interaction energy was deduced from the second-order perturbation approach[33–35]. The most important interaction
between“filled”(donor) Lewis type NBOs and“empty”(acceptor)
non-Lewis NBOs are reported inTable 1.
There occurs a strong hyperconjugative interaction ofπelectrons from C12\\C13 and C8\\C9 toπ*C10\\C11 bond of ring R5 which in-crease the ED (0.409e) leading to the stabilization energy of 19.44 and 21.31 kcal/mol, respectively. This enhancedπ*C10-C11 NBO further conjugates withπ*C8-C9 resulting to high stabilization of 228.59 kcal/ mol. Another hyperconjugative interactions were observed fromπ C4-C16 andπC17\\C18 toπ*C2\\C3 bond of ring R2, and fromπC8\\C9 andπC10\\C11 toπ*C12\\C13 of ring R5 which increase the EDs of 0.366e and 0.363e, respectively. Similarly, the enhancedπ*C17-C18/ π*C2-C3 NBOs further conjugate toπ*C4\\C16 leading to stabilization of 137.61/141.91 kcal/mol, respectively. The interactions related to the resonance in the molecule, are electron donation from LP(2)O1/ LP(2)O2 to antibond acceptorsπ*C17-C18 /π*C2-C3 of ring R2 (24.98 / 25.28 kcal/mol), and from LP(2)O4 to the antibond acceptorπ *C10-C11 of ring R5 (27.78 kcal/mol). The interactions are confined between those atoms which are attached with the rings. A comparison of Mulli-ken and NBO charges is presented in the Table S2 (Supplementary material).
Selected Lewis (bond or lone pair) NBO orbitals of investigated mol-ecule with their valence hybrids corresponding to the various interac-tions are listed in Table S3 (Supplementary material). The valence hybrids analyses of NBO orbitals show that all the C\\N bond orbitals are polarized towards the nitrogen atom (60.95–61.60% at N), whereas the C\\O bond orbitals are polarized towards the oxygen atom (67.04– 68.48% at O). Therefore, they consist with the maximum electron densi-ty on the nitrogen and oxygen atoms. The electron densidensi-ty distribution around the imino group also influences the polarity of the compound.
Table 3
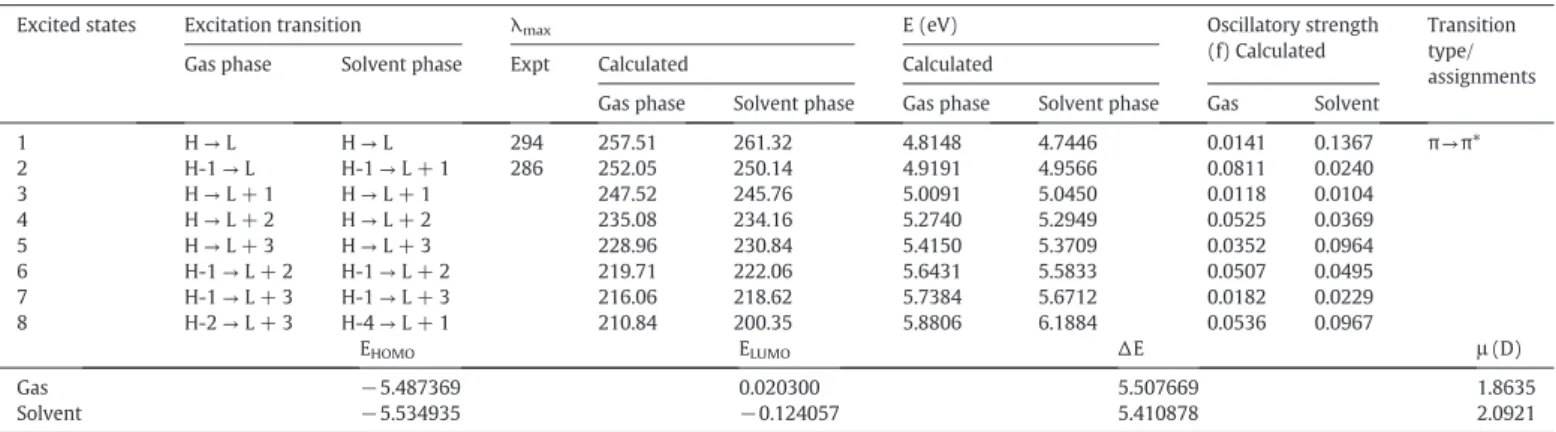
Electronic transitions, absorption wavelengthλmax(nm), excitation energy (eV), oscillator strengths (f), frontier orbital energies (eV) and dipole moment (Debye).
Excited states Excitation transition λmax E (eV) Oscillatory strength
(f) Calculated
Transition type/ assignments Gas phase Solvent phase Expt Calculated Calculated
Gas phase Solvent phase Gas phase Solvent phase Gas Solvent 1 H→L H→L 294 257.51 261.32 4.8148 4.7446 0.0141 0.1367 π→π*
2 H-1→L H-1→L + 1 286 252.05 250.14 4.9191 4.9566 0.0811 0.0240
3 H→L + 1 H→L + 1 247.52 245.76 5.0091 5.0450 0.0118 0.0104
4 H→L + 2 H→L + 2 235.08 234.16 5.2740 5.2949 0.0525 0.0369
5 H→L + 3 H→L + 3 228.96 230.84 5.4150 5.3709 0.0352 0.0964
6 H-1→L + 2 H-1→L + 2 219.71 222.06 5.6431 5.5833 0.0507 0.0495
7 H-1→L + 3 H-1→L + 3 216.06 218.62 5.7384 5.6712 0.0182 0.0229
8 H-2→L + 3 H-4→L + 1 210.84 200.35 5.8806 6.1884 0.0536 0.0967
EHOMO ELUMO ∆E μ(D)
Gas −5.487369 0.020300 5.507669 1.8635
Solvent −5.534935 −0.124057 5.410878 2.0921
Fig. 3.UV–Vis spectra taken in ethanol.
4.4. Chemical Reactivity
4.4.1. Global reactivity descriptor
Electrophilicity and hardness are two important molecular proper-ties, which are useful for interpreting and understanding the stability and reactivity of molecular system[21]. According to the Hohenberg and Kohn (HK) theorems[17], the energy of the basic state of an elec-tronic system is a functional of electron density. On the basis of Koopman's theorem[21], global reactivity descriptors; electronegativity (χ), chemical potential (σ), global hardness (η), global softness (S) and
global electrophilicity index (ω) were calculated using the energies of frontier molecular orbitals EHOMO, ELUMOand given by relations:
χ¼−½ E½ HOMOþELUMO ð1Þ
σ¼−χ¼½ E½ HOMOþELUMO ð2Þ
η¼½ E½ HOMOþELUMO ð3Þ
S¼½ð Þη ð4Þ
ω ¼σ2=2η ð5Þ
△Nmax¼−σ=η ð6Þ
According to Parr et al. 1999[36]ω, a positive andfinite quantity is a global reactivity index similar toη(a measure of the resistance of a sys-tem to transfer charge), andσ. The direction of the charge transfer is
completely determined by the electronic chemical potential of the mol-ecule because an electrophile is a chemical species capable of accepting electrons from the environments. Therefore, its energy must decrease upon accepting the electronic charge and electronic chemical potential must be negative. The values of frontier energy levels (EHOMO, ELUMO), energy band gap (ΔE),χ,σ,η, S,ω, and additionalΔN for CAD are listed in the Table S4 (Supplementary material). The calculated high value of the electrofilicity index (ω) shows that the molecule behaves as a strong electrophile.
4.5. Local Reactivity Descriptors
Using Hirschfield population analysis of neutral, cation and anion state of molecule, Fukui functions (fk+,fk−,fk0)[36–39], are calculated at same calculation method B3LYP/6–21 G(d,p) using following relations:
fkþ ¼½q Nð þ1Þ−q Nð Þfor nucleophilic attack ð7Þ
fk−¼½q Nð Þ−q Nð −1Þfor electrophilic attack ð8Þ
fk0¼½ q N½ ð þ1Þ−q Nð −1Þfor radical attack ð9Þ
Fig. 5.Comparison between observed and the calculated FT-Raman spectra.
Table 4
Comparison between calculated and observed (FT-IR and micro-Raman) wavenumbers (cm−1) and the PED distribution of CAD.
Calculated Observed Potential energy distribution (PED %) Unscaled Scaled IR Raman
DFT HF DFT HF
3220 3367 3079 3212 3065 3069 R5[υ(CH)](99) 3216 3359 3075 3204 3038 3067 R2[υ(CH)](98) 3206 3344 3067 3191 3036 3038 R2[υ(CH)](98) 3177 3316 3040 3166 – 3025 R5[υ(CH)](99) 3148 3299 3014 3151 3001 3003 Me2[υ
a(CH3)](100)
3145 3279 3011 3133 2999 3002 Me1[υ
a(CH3)](99)
3109 3278 2978 3132 2997 3000 R1[υa(CH2)](99)
3098 3246 2969 3102 – – Me1[υ
a(CH3)](99)
3086 3237 2958 3094 2939 2946 R4[υa(CH2)](96)
3077 3225 2949 3083 2937 2940 R4[υa(CH2)](99)
3075 3222 2948 3081 2930 3938 Me2[υ
a(CH3)](100)
3074 3209 2947 3069 2928 2930 R3[υa(CH2)](93)
3069 3202 2942 3063 2926 2928 R3[υa(CH2)](98)
3038 3189 2914 3051 2899 2897 R4[υs(CH2)](99)
3032 3178 2908 3041 2897 2895 R3[υs(CH2)](97)
3025 3166 2902 3030 2887 – Me1[υ
s(CH3)](99)
3015 3166 2893 3030 2885 2878 Me2[υ
s(CH3)](99)
3008 3162 2886 3027 2872 2868 R1[υs(CH2)](99)
2918 3078 2805 2950 – 2805 R3[υs(CH2)](95)
2895 3068 2784 2942 2752 2755 R4[υs(CH2)](95)
2875 3046 2766 2921 2750 2753 R3[υ(CH)](94) +υa(CH2)(5)]
1677 1822 1646 1783 1622 1626 R2[υ(CC)(57) +δa(11) +δin(CH](5)] + R1[δring](8)
1674 1806 1642 1768 1618 1625 R2[υ(CC)(52) + [δ'a](11) + R1[υ(CC)](23) 1660 1798 1629 1760 1605 1607 R5[υ(CC)(51) +δa(11) +δin(CH)(8)]
1632 1769 1603 1733 1584 1586 R5[υ(CC)(51) +δ'a(10) +δin(CH)(6)] + R4[υ(CC)](21)
1563 1680 1537 1649 1531 1533 R1[δ(CH2)](84)
1538 1662 1513 1631 1506 1501 R5[υ(CC)(32) +δin(CH)(26)] + R4[υ(CC)](15) +δa[Me2(CH3)](8)
1536 1655 1511 1625 1495 1493 R2[δin(CH)(29) +υ(CC)](24)] + R1[υ(CC)(19) +δCH2](12) +υ(CO)(5)] 1527 1637 1503 1608 1493 1491 Me1(CH
3)[(δa(56) +δ′(32) +ρ′(9)]
1522 1634 1497 1605 1491 1490 R3[δ(CH2)](67) + R4[δ(CH2)](13) +δ[Me2(CH3)](5)
1519 1631 1495 1601 1485 1480 Me2(CH
3)[δa(77) +ρ′(8)] + R3[δ(CH2)](6)
1505 1621 1481 1592 1474 1470 Me2(CH
3)[δ'a(88) +ρ(5)]
1504 1621 1480 1592 1470 1468 R4[δ(CH2)](23) +δa[Me1(CH3)](21) + R3[δ(CH2)](12) + R5[υ(CC)](8) + R5[υ(CO)](6) 1497 1617 1473 1588 1468 1466 Me1(CH
3)[δ'a(55) +δa(33) +ρ(7)]
1495 1611 1472 1583 1466 1461 R4[δ(CH2)](48) +δs[Me1(CH3)](20) +δs[Me2(CH3)](6) + R3[δ(CH2)](5)
1487 1604 1464 1576 1458 1457 R3[δ(CH2)](88)
1485 1603 1462 1575 1456 1455 δs[Me2(CH3)](66) + R4[δ(CH2)](15)
1480 1600 1457 1573 1454 1453 R4[δ(CH2)](68) +δs[Me2(CH3)](10) +δs[Me1(CH3)](7)
1473 1593 1451 1565 1450 1441 R2[υ(CC)](22) + R3[υ(CC)(10) +δtrig(5) +δa(5)] + R4[δ(CH2)](6) + R1[ω(CH2)](6)
1467 1587 1444 1559 1443 1439 δs[Me1(CH3)](34) + R5[υ(CC)](18) + R4[υ(CC)](6) 1440 1565 1419 1539 1414 1426 R1[ω(CH2)](42) + R3[ω(CH2)](20) + R4[ω(CH2)](8)
1430 1550 1409 1524 1408 1410 R1[ω(CH2)](36) + R3[ω(CH2)](24) + R4[ω(CH2)](8)
1427 1534 1406 1509 1406 1407 R2[υ(CC)](56) + R1[υ(CO)](5)
1396 1510 1377 1486 1358 1357 R4[ω(CH2)](31) + R3[CH(ρ′)(CH(20) +ω(CH2)(8)]
1383 1497 1363 1474 1356 1355 R4[ω(CH2)](35) +υ(CC)(13)] + R3[ρ(CH)(13) +ω(CH2)](11)]
1371 1493 1352 1469 1348 1349 R3[(ω(40) +γ(10))CH2+υ(CC)(13)] 1363 1471 1344 1449 1339 1345 R3[ρ(CH)(40) + (ω(CH2)(19) +γ(CH2)(5)]
1347 1444 1329 1423 1325 1326 R5[υ(CC)](50) + R3[ρ′(CH)](9) + R4[υ(CC)](7)
1328 1436 1311 1415 1304 1303 R4[γ(24) + (5)](CH2) + R3[ρ′(CH)](17) +υ(N5C33)(5) +γ(CH2)(5)] + R5[υ(CC)](8) +δin(CH)(5)]
1317 1426 1300 1405 1300 1295 R4[υ(CC)](16) +υ(NC)(6)] + R5[υ(CC)](16) + R3[γ(CH2)](14)
1310 1384 1293 1365 1281 1283 R5[υ(CO)(28) +δin(CH)(13) +υ(CC)(10) + R4[ω(CH2)](6) + R3[γ(CH2)](5)
1290 1378 1274 1359 1273 1277 R4[γ(CH2)](22) + R1[υ(CO)](11) +υ(CC)(9)] + R2[υ(CC)(19)] + R3[γ(CH2)](7)
1270 1366 1254 1348 1250 1247 R2[δin(CH)](27) + R3[γ(CH2)(10) +δtrig(9)] + R4[γ(CH2)(10) +υ(NC)(5)] 1263 1352 1248 1334 1248 1241 R5[δtrig(24) +υ(CO)(23)] + R4[ω(CH2)(8) +υ(CC)](7)
1256 1349 1241 1331 1229 1239 R4[γ(CH2)](25) + R2[υ(CC)(22) +δin(CH)(6)] + R1[υ(CC)(7) +υ(CO)(9)]
1248 1329 1234 1311 1227 1233 R5[δin(CH)(21) +υ(CC)(16)] + R4[ω(CH2)](16) +υ(CC)(6)] + R3[ρ′(CH)](10)
1236 1327 1222 1309 1213 1216 R2[δtrig(12) +δin(CH)(13)] + R1[γ(CH2)](22) + R3[γ(CH2)](14)
1225 1324 1212 1307 1211 1212 R3[γ(CH2)](30) + R4[γ(CH2)](23) + R1[γ(CH2)](10)
1219 1314 1206 1297 – 1198 R1[γ(CH2)](32) + R4[γ(CH2)(21) + R2[δin(CH)(7)] + R2[δin(CH)](6)
1213 1310 1200 1293 – 1196 ρ′[Me2(CH
3)](29) + R5[δin(CH)(15) +δtrig(7)] +υ(CC)(6)] + R4[υ(CC)](5) + R1[γ(CH2)](5)
1210 1307 1196 1291 1186 1189 ρ′[Me1(CH
3)](51) +ρ′[Me2(CH 3)](12)
1202 1298 1189 1282 1184 1187 R2[δtrig](24) + R1[γ(CH2)](18) + R3[υ(CC)](13) + R4[γ(CH2)](5)
1196 1285 1184 1269 1182 1185 R3[υ(NC)](30) + R4[γ(CH2)](6) + R3[υ(CC)](6) + R5[υ(CC)](5) +ρ′[Me2(CH3)](5)
1193 1279 1180 1264 1180 1183 ρ′[Me2(CH
3)](15) + R5[δin(CH)(15) +υ(CC)(7)] + R3[υ(NC)](13)
1178 1278 1166 1263 1163 1164 [ρ(69) +ρ′(22)] Me2(CH 3)
1177 1258 1165 1243 1162 1162 [ρ(73) +ρ′(20)] Me1(CH 3)
1171 1252 1159 1237 1159 1160 R3[υ(NC)](14) +υ(CC)(11)] + R2[δin(CH)](21) + R2[υ(CC)](20) 1162 1222 1150 1208 1140 1146 R4[υ(NC)](33) + R3[γ(CH2)(11) +υ(NC)(5)] + R2[δtrig](11)
1149 1210 1138 1196 1130 1131 R1[ρ(CH2](88)
1121 1193 1110 1180 1082 1083 υ(C20O)(35) + R5[δin(CH)](8) + R4[υ(CC)](7) +υ(C19O)(6)
1099 1187 1088 1174 1080 1081 R3[ρ(CH2)](17) +υ(C19O)(13) + R4[υ(CC)](8) + R3[puck](6) +υ(C20O)(6)
where N, N-1 and N + 1 are total electrons present in neutral, cation and anion state of molecule, respectively.
Local softness (sk+, sk−, sk0) and local electrophilicity indices (ωk+,ωk−, ωk0), also used to describe the reactivity of atoms in the molecule, are calculated using the following equations:
skþ¼Sf
kþ;sk −
¼Sfk−;sk0¼Sfk0 ð10Þ
ωkþ¼ωfkþ;ωk−¼ωfk−;ωk0¼ωfk0 ð11Þ
where +,−, 0 signs show nucleophilic, electrophilic and radical attack, respectively.
The calculated values of Fukui functions, electrophilicity descriptors, and the nucleophilicity descriptors are listed in theTable 2. The high value offk−at O2 and O1 atoms indicate that these sites are more
978 1074 971 1065 957 959 R3[υ(CC)(14) +ρ(CH2)(8)] +υ(C19O)(11) + R4[υ(CC)](9) + R5[δa](6) +υ(C20O)(6) 973 1050 966 1041 955 957 R1[υ(CO)](73) + R1[δ'ring](6)
930 1043 924 1035 – 919 R5[oop(CH)(75) + puck(7)]
921 1002 915 994 910 912 R3[ρ(CH2)(22) +δtrig(8)] + R4[δtrig](6) + R5[oop(CH)](9)
901 997 895 990 883 884 R4[υ(CC)(11) +ρ(CH2)(9)] + R2[oop(CH)](16) + R3[ρ(CH2)(12) +υ(NC)](5)
876 976 871 969 881 874 R2[oop(CH)](73) + R2[τ′](5)
874 966 870 959 860 863 R2[oop(CH)](23) + R2[puck](7) + R5[δ'a](6) + R1[υ(CO)] (5)
867 938 863 932 858 861 R2[oop(CH)](66) + R2[puck](11)
834 911 830 905 820 824 R1[υ(CO)(22) +υ(CC)(13) +δring(5)] + R2[υ(CC)(10) +δ'a(9)]
807 896 803 891 804 805 R5[oop(CH)(73) + puck(10) +τ(6) + oop(C9O)(5)]
781 865 778 861 775 776 R5[puck(25) + oop(C9O)(17) + oop(C10O)(6) + R3[υ(NC)(13) +ρ(CH2)(6)]
761 840 758 835 767 755 R5[puck(29) + oop(C9O)(17) + oop(C10O)(8) + oop(CH)(5)] 754 818 751 814 750 753 R1[δ'ring](16) + R3[υ(CC)](10) + R5[δtrig](6) + R2[υ(CC)](6)
746 812 743 809 748 751 R2[δtrig](17) + R1[δ'ring](16) + R5[δtrig](10)
735 805 733 801 – 720 R2[puck](47) + R1[δring](13) + R3[puck](7) +τ(C35C12)(5) 722 797 720 793 717 718 R1[δring(37) +υ(CO)(6)] + R2[puck(20) +δ'a(11)]
716 765 714 763 706 708 R5[puck(12) +υ(CC)(10) +υ(CO)(6)] + R4[υ(CC)](15) 689 759 687 756 687 689 R2[τ(24) + puck(6)] + R1[δ'ring(12) +τ(8)] + R3[δtrig](13)
669 728 667 725 667 660 R2[τ(23) +δa(11)] + R3[puck](10)
652 700 651 698 654 651 R5[δin(CO)(21) + puck(7) +υ(CC)(6) +δ'a(5)] + R4[δ'a(9) +δtrig(6)] +δ(C10C20O)(7)
615 674 614 672 619 610 R5[τ(18) + puck(14) + oop(CO)(13)] + R4[τ(9) + puck(8)]
566 625 566 624 559 560 R5[τ′(14) + oop(CO)(11) + puck(5)] +τ(N1C15)(7) + R3[δ'a](6) + R4[δ'a](5)
558 605 558 605 557 558 R5[oop(CO)(19) +τ′(12) +τ(8) + R2[δ'a](7)
532 571 532 571 530 531 R5[δ'a(11) +τ′(9) +δa(5) + oop(CO)(5)] + R3[δa](12) + R2[δ'a](8) + R4[puck](5)
518 556 518 556 515 516 R3[δ'a(26) +δa(10)] + R5[δin(CO)](6) +τ(N1C15)(5)
510 552 511 552 509 510 R4[δ'a(17) +δa(9) +ρ(CH2)(5)] + R5[δ'a(12) +τ′(8) +δa(5)]
501 539 501 539 507 505 R5[δa(18) +τ′(5)] +δ(C10C20O)](12) + R3[δa](7)
446 484 447 485 442 440 R2[τ′(27) +δa(24)] +τ(C4C16)(8) + R5[δa](5) + R3[puck](5)
432 467 432 468 431 427 R2[τ′(31) +δa(23)] +τ(C4C16)(17) +τ(C2C18)(8)
407 440 407 440 405 410 R4[δa(20) +τ(5)] + R5[τ′](15) +δ(C10C20O)](13) +δ(C9C19O)](8)
388 424 389 425 – 388 R3[δ'a(15) +δa(15) + puck(7)] +τ(N1C15)(10)
381 415 382 416 – 383 τ(C2C18)(33) + R5[τ′](8) + R2[τ′](8) + R5[oop(C10O)](6) 373 400 374 401 – 375 τ(C2C18)(19) + R5[τ′(11) + oop(C10O)(8)] + R4[puck](12) 345 374 346 375 – 340 R5[δin(C9O)](11) +δ(C10C20O)](9) + R4[δa](8) +τ(C8C13)(5)
339 366 340 367 – 338 τ(C8C13)(31) +δ(C9C19O)](12) + R4[τ](9) + R4[τ′](8) + R5[τ](6) + R5[puck](5) 300 333 301 334 – 292 τ(N1C15)(20) + R5[δin(C9O)](12) +τ(C2C18)(10) + R3[τ](6) + R1[τ′](5) 286 312 287 313 – 288 τ(C2C18)(18) + R3[puck](18) + R2[puck](12) + R3[τ](12) + R1[τ](9) + R4[puck](5) 268 292 269 293 – 269 R3[puck(12) +τ′(12) +δ'a(9)] +τ(C2C18)(7) +τ(N1C15)(7) + R1[τ′](6)
254 270 255 271 – 248 R4[τ′(15) + puck(7)] + R5[oop(C9O)](12) +τ(C20O)(7) + R4[τ](6) + R5[τ′](5) +δ(C9C19O)](5) 242 256 243 258 – 244 τ(C20O)(67) +τ(C8C13)(6) + R4[puck](5)
222 243 223 244 – 207 R4[puck(12) +τ′(5)] + R2[τ](9) +τ(C8C13)(9) + R1[τ](8) + R3[τ](6) + R3[δa](5)
195 211 196 213 – 201 R5[δin(C10O)(17) + oop(C9O)(14))] + R2[τ](8) +δ(C10C20O)](8) + R1[τ](5) +δ(C9C19O)](5) 188 204 189 205 – 190 τ(N1C15)(27) + R1[τ′(19) +τ(8)] + R3[τ](7) +τ(C4C16)(6) +τ(C2C18)(5)
181 191 182 192 – 180 R4[δa](17) + R5[oop(C9O)(9) +δin(C10O)(6)] +τ(C19O)(8) + R4[τ](5) + R1[τ](5)
148 159 148 160 – – τ(C19O)(26) +τ(N1C15)(13) +τ(C8C13)(9) + R4[puck](8)
141 150 141 151 – 140 R1[τ′](34) + R5[τ](12) + R4[puck(9) +τ(9)] +τ(C8C13)(11) +τ(N1C15)(6)
125 140 126 141 – 122 R3[τ](17) +τ(N1C15)(16) + R1[τ](14) +τ(C4C16)(6) + R4[τ](6) +τ(C2C18)(5) +τ(C19O)(5) + R5[τ](5) + R2[τ](5) 111 128 112 129 – 109 R1[τ′](43) +τ(C8C13)(8) +τ(C19O)(6)
89 115 90 116 – 107 R3[τ′(13) + puck(6)] +τ(C10O)(12) +τ(C4C16)(9) + R4[τ](11) + R5[τ′](8) +τ(C2C18)(6) + R2[τ](5) +τ(N1C15)(5) 82 104 83 104 – – τ(C9O)(59) +δ(C9C19O)](8) +τ(C19O)(6) + R5[δin(C9O)](5)
74 71 75 71 – – τ(C10O)(37) +τ(C20O)(14) +τ(C9O)(9) + R4[τ′](8) + R3[τ′](5
61 66 62 67 – – τ(N1C15)(31) + R3[puck](17) + R2[τ](9) + R3[τ](11) +τ(C10O)(7) +τ(C8C13)(6) 39 41 39 42 – – τ(N1C15)(41) + R4[τ](20) + R3[τ′(12) +τ(5)]
28 31 28 31 – – R4[τ′](30) + R3[τ](14) +τ(C4C16)(14) +τ(C8C13)(14) +τ(N1C15)(14)a
Proposed assignments and potential energy distribution (PED) for vibrational normal modes. Types of vibration:ν, stretching;δ, deformation (bending), scissoring; oop, out-of-plane bending;ω, wagging;γ, twisting;ρ, rocking;τ, torsion;
prone to nucleophilic attack. Similarly, the sites at C1, C12, and C20 are more prone to electrophilic attack due to having maximum value offk+.
4.6. UV Spectroscopy and HOMO-LUMO Analysis
The UV–Vis absorption spectrum of CAD is shown in theFig. 3with the absorption bands at 294 and 286 nm in EtOH solvent. Both the fron-tier molecular orbitals (FMOs), highest occupied molecular orbital (HOMO) and lowest unoccupied molecular orbital (LUMO) are the most important orbitals participated in a chemical reaction. The transi-tion of an electron between HOMO and LUMO is a principal factor that determines the easiness of chemical reaction and its path, irrespective to the intra- and intermolecular processes. Higher the gap between these two bands (∆E) more is the stability of the system andvice versa. Here, we have demonstrated the molecular orbital both in the gas and solvent phases as an example to compare the effect of the solu-tion on absorpsolu-tions. The energy gap in gas phase as well as in the solvent phase is 5.508 eV and 5.411 eV, respectively.
The calculated wavelengths (λmax), vertical excitation energies, os-cillator strengths (f), dipole moments (μ), and excitation transition
with spectral assignments for vacuum and the solvent environment are carried out as given inTable 3. The transition observed in the UV spectrum isπ→π*. In the gaseous phase in the LUMO, the charge is mainly accumulated on the ring R2 portions. Similarly, in HOMO and HOMO-1 the charge density is over the rings R2 and R3. However, in LUMO + 1 it is over the ring R5 portion as shown in Fig. S2 ( Supplemen-tary material). In solvent phase, the allowed dipole transition is at 261.32 nm (H→L) with oscillator strength of 0.1363 and, in the gaseous phase, it is at 257.51 nm (H→L) with oscillator strength of 0.0141. The H–1→L transition is predicted at 252.05 nm with the oscillator strength 0.0811 in the gas phase, while, H–1→L + 1 transition at 290.14 nm is predicted with oscillator strength 0.0240 in the solvent phase, respectively. The charge accumulation within the molecule in solvent phase is given in the Fig. S3 (Supplementary material).
4.7. Vibrational Spectrum
This CAD molecule has 46 atoms and hence gives 132 (3N-6; N the number of atoms) modes of vibrations. All the wavenumbers are both IR and Raman active. We have calculated these fundamental wavenumbers, their intensities and PED along with the internal coordi-nates obtained by HF and DFT with 6-311++G(d,p) basis set calcula-tions. The wavenumbers predicted by HF method are larger than B3LPY due to the inclusion of electron correlation in the later. Since, the vibrational wavenumbers obtained from the DFT calculations are higher than the experimental wavenumbers, so the vibrational wavenumbers obtained from the DFT calculations were corrected by the wavenumber linear scaling (WLS) of Yoshida et al.[40]. by using the expression:υobs= (1.0087–0.0000163υcal)υcal.
The Raman scattering cross-sections,∂σj/∂Ω, which is proportional to the Raman intensities may be calculated from the Raman scattering amplitude and predicted wavenumbers for each normal modes using the relationship[41–43]:
∂σj
∂Ω ¼ 24π4
45 !
v0−vj 4
1−exp −hcvj kT 0 B B @ 1 C C A h 8π2cvj
Sj
where, sj and υj are the scattering activities and the predicted wavenumbers (in cm−1), respectively of the jth normal mode,
υois the Raman exciting wavenumber (cm−1), and h, c and k are the univer-sal constants.
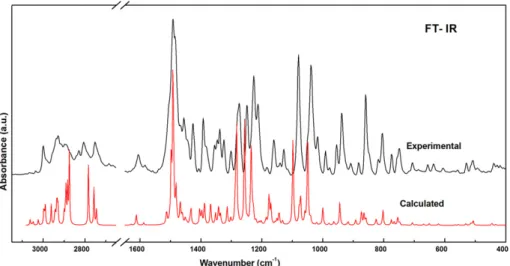
A comparison of the wavenumbers calculated by the DFT method shows very good agreement with the experimental values due to incor-poration of electron correlation. The simulated and observed IR and
Raman modes of the CAD molecule are given inFigs. 4 and 5, respective-ly. Out of several internal coordinates that may be present in the PED as given inTable 4, we have discussed here only some prominent modes:
4.7.1. Methoxy Group Vibration
In a molecule containing methoxy group, the electronic charge is back donated from the lone pair atoms (oxygen) to theσ* orbital of CH bond weakens the CH bonds. This increases the CH bond resulting in the enhancement of the IR intensities in CH stretching[44,45]. CH3 group has several modes associated with it, such as symmetric and asymmetric stretches, bends, rocks and torsions. There are two methyl groups (Me1and Me2) connected to the same ring R5 as shown in the Fig. 1(b), forming methoxy groups. Asymmetric stretching modes asso-ciated to each Me1and Me2groups predicted in the range of 3000
–
2935 cm−1, were assigned in the weak IR and the strong Raman peaks. Symmetric stretching modes were predicted at 2902 and 2893 cm−1. Asymmetric deformations of Me1and Me2were assigned at 1493/1468 and 1485/1474 cm−1in the IR, and at 1491/1466 and 1480/1470 cm−1in the Raman spectra, that is calculated at 1503/ 1473 and 1495/1481 cm−1, respectively. The calculated rocking vibra-tions at 1196/1166 cm−1 are in good agreements with 1186/ 1163 cm−1in the IR and 1189/1164 cm−1in the Raman peaks.
4.7.2. Ring R1 Vibrations
Basically, six fundamental vibrational assignments can be associated with each CH2moiety namely; symmetric and asymmetric stretch, de-formation and rocking modes which belong to the polarized in-plane vi-bration. In addition to that, CH2 wagging and twisting would be expected to be depolarized out-of-plane symmetry[46]. The asymmet-ric stretching vibration of CH2calculated at 2978 cm−1and observed at 2997/3000 cm−1in the IR/Raman spectrum. The symmetric stretching was observed at 2872/2868 cm−1in the IR/Raman spectrum and calcu-lated at 2886 cm−1as shown inTable 4. Deformation mode of vibration predicted at 1537 cm−1is in good agreement with the observed IR/ Raman band at 1531/1533 cm−1. Highly mixed CH
2wagging, twisting and rocking vibrations were predicted at 1419,
1206 and 1138 cm−1, respectively.
4.7.3. Ring R2 Vibrations
The carbon hydrogen stretching vibrations give rise to the weak bands in the region 3100–3000 cm−1in all the aromatic compounds [47]. In the present case, the CH stretching modes were observed in this range with 100% contributions in PED. These bands are weak in the IR and medium strong in the Raman spectra. The in-plane deforma-tion observed as the weak IR peak at 1495 cm−1and the strong Raman peak at 1493 cm−1and predicted at 1511 cm−1. The out-of-plane de-formations were calculated below 875 cm−1.
4.7.4. Ring R3 Vibrations
The CH stretching vibration predicted at 2766 cm−1was assigned to IR/Raman peak at 2750/2753 cm−1. The rocking mode was observed at 1339/1345 cm−1in the IR/Raman spectra. The mixed NC stretching vi-brations were predicted at 1184 and 1159 cm−1in the scaled DFT.
4.7.5. Ring R4 Vibrations
The CH2 asymmetric stretching vibrations predicted at 2958/ 2949 cm−1 were assigned to the strong Raman peaks at 2946/ 2940 cm−1and the weak IR peaks at 2939/2937 cm−1. The calculated symmetric stretching vibrations for these modes are 2914 and 2784 cm−1. Their deformation, wagging, twisting and rocking vibra-tions are predicted at 1480/1472, 1377/1363, 1311/1274 and 1025 cm−1, respectively. The ring CC stretching vibration predicted at 1145 cm−1is in good agreement with the observed IR/Raman peak at 1142/1140 cm−1.
CO in-plane deformation calculated at 651 cm was assigned at 654/ 651 cm−1in the IR/Raman spectra.
4.8. Nonlinear Optical (NLO) Properties
Nonlinear optics deals with the interactions of various materials in applied electromagneticfields to generate newfield altered in phase, frequency, amplitude or other physical properties [48]. Some organic substances withπelectronic system exhibit the largest known nonlinear coefficients and show promise for thin fabrication, allowing the enormous function and cost integrated electronic circuitry.
The total dipole moment (μo), mean polarizability (∆α), the anisot-ropy of the polarizability (|α0|) and the totalfirst hyperpolarizability (βo) using x, y, z components[39,49]are calculated from the Gaussian 09 output and listed in the Table S5 (Supplementary material). In this study, the calculated values ofμoμ0, |α0| andβoare 1.92 Debye, 32.76 × 10⁻²⁴esu and 1200.87 × 10−33esu, respectively which are higher than those of urea (μo= 1.528 Debye,βoβ0= 343.27 × 10⁻³³esu.) [50,51]. These values are very much comparable with brucine/ strych-nine (3.18/3.30 Debye, 39.47 × 10⁻²³/33.63 × 10−23esu and 221.97 × 10⁻³⁴/111.58 × 10−34esu)[13]and the p-NA[52]. From the above results, it appears that the title compound can be used as a good nonlin-ear material for the optical devices.
5. Conclusion
Present work is mainly concentrated on the study of the wavenum-ber assignments of CAD by using IR and Raman data together with the quantum chemical calculations. Both the IR and Raman spectra were in good agreements with the modes calculated by the DFT. A compari-son of the scaled wavenumbers obtained using DFT methods have bet-ter accuracy with the experimental modes than HF due to the fact that the former includes some of the electron correlation effects. The ob-served electronic spectra have some higher values (294 and 286 nm) compared with the theoretical absorption data (258 and 252 nm) and the molecular orbital coefficient analysis suggests that the electronic transitions are assigned toπ→π*. NBO analysis shows the stability and charge delocalization from various bonding to anti-bonding orbitals (π*) of the title compound. MEP studies suggest that the nitrogen and oxygen (of the methoxy groups) atoms are the most reactive sites. The reactivity descriptors also tell that O2 and O1 atoms are more prone to nucleophilic attack. The observed microscopic NLO properties suggest its potential use in the development of NLO materials. It is re-ported that the title compound possesses anti-fibrillatory and antioxi-dant activity as well as behaves as a potent inhibitor of platelet aggregation. To predict and confirm these types of activity theoretically, molecular docking studies will be performed which are very useful for the industrial and biologically active compounds.
Supplementary data to this article can be found online athttps://doi. org/10.1016/j.saa.2017.10.008.
Acknowledgments
B.D. Joshi would like to thank the CNPq-TWAS for fellowship (CNPq-TWAS/Post-.
[2] S. Foster, J. Duke, A Field Guide to Medicinal Plants and Herbs of Eastern and Central North America, New York, Houghton Mifflin, 2000.
[3] S. Pingali, J.P. Donahue, F. Payton-Stewart, Acta Crystallogr., Sect. C: Struct. Chem. 71 (2015) 262–265.
[4] A.Y. Sun, D.X. Li, Acta Pharmacol. Sin. 14 (1993) 301–303.
[5] B. Xuan, W. Wang, D.X. Li, Acta Pharmacol. Sin. 15 (1994) 133–135.
[6] E.R. Correché, S.A. Andujar, R.R. Kurdelas, M.J. Gómez-Lechón, M.L. Freile, R.D. Enriz, Bioorg. Med. Chem. 16 (2008) 3641–3651.
[7] S. Chen, L. Wan, L. Couch, H. Lin, Y. Li, V.N. Dobrovolsky, N. Mei, L. Guo, Toxicol. Lett. 221 (2013) 64–72.
[8] F.G. Sánchez, A.N. Díaz, I.M. Lama, A. Aguilar, M. Algarra, J. Liq. Chromatogr. Relat. Technol. 37 (2014) 26–38.
[9] R. Mishra, B.D. Joshi, A. Srivastava, P. Tandon, S. Jain, Spectrochim. Acta A 118 (2014) 470–480.
[10] J.M. Chamers, P.R. Griffiths (Eds.), Handbook of Vibrational Spectroscopy, John Wiley and Sons, 2002.
[11] B.D. Joshi, R. Mishra, P. Tandon, A.C. Oliveira, A.P. Ayala, J. Mol. Struct. 1058 (2014) 31–40.
[12] A. Srivastava, R. Mishra, P. Tandon, A.K. Bansal, Spectrochim. Acta A 104 (2013) 409–418.
[13] N. Islam, S. Niaz, T. Manzoor, A.H. Pandith, Spectrochim. Acta A 131 (2014) 461–470.
[14]H.P. Gümüs, Ö. Tamer, D. Avci, E. Tarcan, Y. Atalay, Russ. J. Phys. Chem. A 88 (13) (2014) 2348–2358.
[15] N. Islam, S.S. Chimni, J. Coord. Chem. (2017) 1–16.
[16] M. Govindarajan, M. Karabacak, A. Suvitha, S. Periandy, Spectrochim. Acta A 89 (2012) 137–148.
[17] P. Hohenberg, W. Kohn, Phys. Rev. B 136 (1964) 864–871.
[18]M.J. Frisch, G.W. Trucks, H.B. Schlegel, G.E. Scuseria, J.R. Cheeseman, M.A. Robb, G. Scalmani, V. Barone, B. Mennucci, G.A. Petersson, H. Nakatsuji, M. Caricato, X. Li, H.P. Hratchian, A.F. Izmzylov, J. Bloino, G. Zheng, J.L. Sonnenberg, M. Hada, M. Ehara, K. Toyota, R. Fukuda, J. Ishida, M. Hasegawa, T. Nakajima, Y. Honda, O. Kitao, H. Nakai, T. Vreven, J.A. Montgomery Jr., J.E. Peralta, F. Ogliaro, M. Bearpark, J.J. Heyd, E. Brothers, K.N. Kudin, V.N. Staroverov, R. Kobayashi, J. Normand, A. Raghavachari, A. Rendell, J.C. Burant, S.S. Iyengar, J. Tomasi, M. Cossi, N. Rega, J.M. Millan, M. Klene, J.E. Knox, J.B. Cross, V. Bakken, C. Adamo, J. Jaramillo, R. Gomperts, R.E. Stratmann, O. Yazyev, A.J. Austin, R. Cammi, C. Pomelli, J.W. Ochterski, R.L. Martin, K. Morokuma, V.G. Zakrzewski, G.A. Voth, P. Salvador, J.J. Dannerberg, S. Dapprich, A.D. Daniels, J. Farkas, B. Foresman, J.V. Ortiz, J. Cioslowski, D.J. Fox, GAUSSIAN 09, Revision, Gaussian, Inc., Wallingford CT, USA, 2009.
[19] C. Lee, W. Yang, R.G. Parr, Phys. Rev. 37 (1988) 785–789.
[20] A.D. Becke, J. Chem. Phys. 98 (1993) 5648–5652.
[21] R.G. Parr, W. Yang, Density Functional Theory of Atoms and Molecules, Oxford, New York, 1989.
[22] E.D. Glendering, A.E. Reed, J.E. Carpenter, F. Weinhold, NBO Version 3.1, TCI, Univer-sity of Wisconsin, Madison, 1998.
[23] G.A. Petersson, A. Bennett, T.G. Tensfeldt, M.A. Allaham, W.A. Shirley, J. Mantzaris, J. Chem. Phys. 89 (1988) 2193–2218.
[24] G.A. Petersson, M.A. Allaham, J. Chem. Phys. 94 (1991) 6081–6090.
[25] J.M.L. Martin, C. Van Aslenoy, Gar2ped, University of Antwerp, 1995.
[26] P. Pulay, G. Fogarasi, F. Pang, J.E. Boggs, J. Am. Chem. Soc. 101 (1979) 2550–2560.
[27] G. Fogarasi, X. Zhou, P.W. Taylor, P. Pulay, J. Am. Chem. Soc. 114 (1992) 8191–8201.
[28]A. Frisch, A.B. Nielson, A.J. Holder, Gauss View User Manual, Gaussian Inc., Pitts-burgh, P.A, 2000.
[29] G.A. Zhurko, D.A. Zhurko, Chemcraft,http://www.chemcraftprog.com2005. [30] S. Miertuš, E. Scrocc, J. Tomasi, Chem. Phys. 55 (1981) 117–129.
[31] S. Miertus, J. Tomasi, Chem. Phys. 65 (1982) 239–247.
[32] M. Cossi, V. Barone, R. Cammi, J. Tomasi, Chem. Phys. Lett. 255 (1996) 327–335.
[33] M.W. Wong, Chem. Phys. Lett. 256 (1996) 391–399.
[34] A.P. Scott, L. Radom, J. Phys. Chem. 100 (1996) 16502–16513.
[35]F. Weinhold, C.R. Landis, Valency, and Bonding: A Natural Bond Orbital Donor-Ac-ceptor Perspective, Cambridge University Press, New York, 2005.
[36] R.G. Parr, L. Szentpály, S. Liu, J. Am. Chem. Soc. 121 (1999) 1922–1924.
[37] R.G. Parr, R.G. Pearson, J. Am. Chem. Soc. 105 (1983) 7512–7516.
[38] P. Geerlings, F. De Proft, W. Langenaeker, Chem. Rev. 103 (2003) 1793–1874.
[39] P.K. Chattaraj, S. Giri, J. Phys. Chem. A 111 (2007) 11116–11121.
[40] H. Yoshida, K. Takeda, J. Okamura, A. Ehara, H. Matsurra, J. Phys. Chem. A 106 (2002) 3580–3586.
[41] P. Pulay, G. Fogarasi, G. Pongor, J.E. Boggs, A. Vargha, J. Am. Chem. Soc. 105 (1983) 7037–7047.
[42] G.A. Guirgis, P. Klaboe, S. Shen, D.L. Powell, A. Gruodis, V. Aleksa, C.J. Nielsen, J. Tao, C. Zheng, J.R. Durig, J. Raman Spectrosc. 34 (2003) 322–336.
[44]R.M. Silverstein, F.X. Webster, Spectroscopic Identification of Organic Compounds, sixth ed John Wiley & Sons Inc., New York, 2003.
[45]P. Agarwal, N. Choudhary, A. Gupta, P. Tandon, Vibrational Spectrosc. 64 (2013) 134–147.
[46] B.D. Joshi, A. Srivastava, P. Tandona, S. Jain, Spectrochim. Acta A 82 (2011) 270–278.
[47] B. Smith, Infrared Spectral Interpretation. A Systematic Approach, CRC Press, Wash-ington, DC, 1999.
[48] D.J. Williams, Angew. Chem. Int. Ed. Engl. 23 (1984) 690–703.
[49] H. Alyar, Z. Kantarci, M. Bahat, E. Kasap, J. Mol. Struct. 834-836 (2007) 516–520.
[50]N. Sundaraganesan, J. Karpagam, S. Sebastian, J.P. Cornard, Spectrochim. Acta A 73 (2009) 11–19.
[51] K. Chandramohan, K. Ravikumar, J. Chem. Crystallogr. 29 (1999) 121–125.