Article
Printed in Brazil - ©2017 Sociedade Brasileira de Química0103 - 5053 $6.00+0.00*e-mail: [email protected]
Brazoides A-D, New Alkaloids from
Justicia gendarussa
Burm. F. Species
Luciana G. S. Souza,a Macia C. S. Almeida,a Telma L. G. Lemos,*,a Paulo R. V. Ribeiro,b
Kirley M. Canuto,b Raimundo Braz-Filho,c,d Catarina N. Del Cistia,e
Carlos Mauricio R. Sant’Anna,f Francisco S. Barretog and Manoel O. de Moraesg
aDepartamento de Química Orgânica e Inorgânica, Universidade Federal do Ceará,
60451-970 Fortaleza-CE, Brazil
bEmbrapa Agroindústria Tropical, 60511-110 Fortaleza-CE, Brazil
cFAPERJ, Departamento de Química, ICE, Universidade Federal Rural do Rio de Janeiro,
23890-000 Seropédica-RJ, Brazil
dLaboratório de Ciências Químicas, Universidade Estadual do Norte Fluminense Darcy Ribeiro,
28035-200 Campos dos Goytacazes-RJ, Brazil
eDepartamento de Matemática and fDepartamento de Química, ICE,
Universidade Federal Rural do Rio de Janeiro, 23894-374 Seropédica-RJ, Brazil
gNúcleo de Pesquisa e Desenvolvimento de Medicamentos (NPDM),
Universidade Federal do Ceará, 60430-275 Fortaleza-CE, Brazil
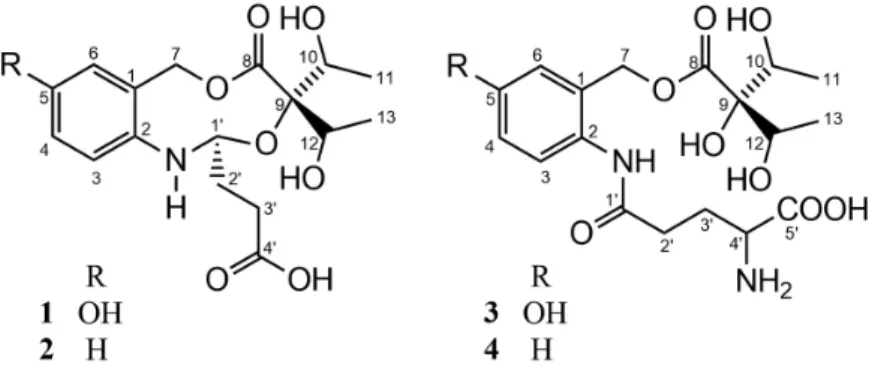
Four new alkaloids, Brazoides A-D, together with three known compounds squalene,
β-sitosterol and lupeol, were isolated from leaves of Justicia gendarussa. These structures were established by spectrometric techniques, mainly high-resolution electrospray ionization mass spectrometry (HRESIMS) and 1D and 2D nuclear magnetic resonance (NMR), including comparative analysis with literature values. Structural determination of the compounds, Brazoides A-D, was strengthened by molecular modeling and density functional theory (DFT) calculations to predict the NMR data and compare with the experimental NMR values of these natural products. The new compounds were tested against three human cancer cell lines (glioblastoma, prostate and colon), but none exhibited activity.
Keywords: Acanthaceae, Justicia gendarussa, alkaloids, Brazoides
Introduction
Justicia is the largest genus of Acanthaceae family, with approximately 600 species, distributed throughout the tropics and subtropics of both hemispheres, extending into the temperate regions of North America.1-3 In Brazil, this
genus is represented by approximately 128 species.4 The
species Justicia gendarussa Burm. F. is found in tropical and subtropical areas of Asia and India, and also in northeastern Brazil. It exhibits several biological properties, such as antioxidant, anti-arthritic, anti-inflammatory, analgesic, anti-cancer, hepatoprotective and larvicide. J. gendarussa has been used in folk medicine to treat fever, cough, aphthae, arthritis, headaches, facial paralysis, earache, bronchitis,
liver diseases, chronic rheumatism, inflammations, vaginal discharges, dyspepsia and ocular diseases.5-9
The species of the genus Justicia have many morphological similarities among themselves, so that share some common names and medicinal indications. In Brazil J. gendarussa is known as Anador or Anador grande.5
Earlier phytochemical studies reported the presence of triterpenoids,9 steroids,9-11 flavonoides,11-13 and nitrogen
compounds in its leaves.14,15
values. Structural determination of the compounds was strengthened by molecular modeling and density functional theory (DFT) calculations to predict the NMR data and compare with the experimental NMR values of these natural products. Cytotoxic activities in vitro of compounds were evaluated using three human cancer cell lines, SF-295 (glioblastoma), PC-3 (prostate) and HCT-116 (colon).
Experimental
General experimental procedures
Optical rotations were obtained on a JASCO P-200 polarimeter. Infrared spectra (IR) were recorded on a PerkinElmer Spectrum 1000 FT-IR spectrometer using KBr pellets. The NMR spectra were accomplished on Bruker Avance DRX-500 and Agilent VNMR-600 spectrometers. The 1H and 13C chemical shifts are expressed in the d scale
and were referenced to TMS through the residual solvent. HRESIMS were obtained on a Shimadzu spectrometer LCMS-IT-TOF type equipped with electrospray ionization source. Column chromatographies were performed with silica gel 60 (63-200 µM, Vetec), Sephadex LH-20 (Pharmacia) and cartridge SPE C18 (Phenomenex). Thin layer chromatography (TLC) was performed on precoated silica gel aluminum sheets (Macherey-Nagel) with fluorescent indicator 254 nm. The compounds were visualized by UV detection and by spraying with vanillin/ perchloric acid/EtOH solution, followed by heating. High performance liquid chromatography (HPLC) separations were carried out on a Shimadzu apparatus equipped with SPD-M20A UV-Vis detector, and a Phenomenex®
Luna 5u C18 preparative column (250 × 10 mm), using a H2O/MeOH solvent system as mobile phase.
Plant material
The leaves of J. gendarussa, were collected in the Garden of Medicinal Plants of the Federal University of
Ceará (UFC) in March 2012. A voucher specimen was identified by the botanist Edson Nunes deposited in the Herbarium Prisco Bezerra, of UFC with the number 52214.
Extraction and isolation
The dried and crushed leaves of J. gendarussa (295.0 g) were extracted exhaustively with ethanol at room temperature and then evaporated under reduced pressure to give 55.4 g of crude extract. Afterwards, this extract was subjected to removal of chlorophyll. The chlorophyll extraction was performed by dripping of water on the ethanol extract under stirring until obtaining a ethanol-water (7:3) solution. Subsequently this solution was stored at low temperature for 24 hours and then vacuum filtered, yielding a precipitate rich in chlorophyll and a free ethanol extract chlorophyll (46.0 g).16 Approximately
20.0 g of chlorophyll-free crude extract was subjected to column chromatography on silica gel eluted with mixtures of solvents: hexane, CH2Cl2, EtOAc and MeOH in
increasing polarity, giving seven fractions. After removing the solvent, the major fraction AcOEt/MeOH (50:50, v/v) eluate (12.0 g), was separated by silica gel column eluted with CH2Cl2 containing increasing percentages of MeOH,
providing eight fractions (F1-F8). The fraction F1 (85.0 mg)
was chromatographed over Sephadex LH 20 eluted with MeOH, affording 95 fractions. Fractions 43-76 were similar in TLC and were combined to give 50.0 mg of a mixture of compounds. Later on, this mixture was chromatographed by semi-preparative RP-18 HPLC, using H2O/MeOH
(80:20, v/v) isocratic elution, and a flow of 2.3 mL min-1,
to afford 1 (2.5 mg) and 2 (2.0 mg). The fraction F6-7 (4.0 g)
was chromatographed on a C18 cartridge eluting H2O/
MeOH (50:50, v/v) resulting in 47 fractions. Subsequently, the fraction 1 (615.0 mg) was subjected to a C18 cartridge
eluted with H2O/MeOH in gradient of increasing MeOH
(0-100%), resulting in 68 fractions. Fractions 4-6 were similar in TLC and were combined to give 80.0 mg of a mixture of compounds. Then, this mixture was separated
by semi-preparative RP-18 HPLC using the previous methodology, to afford 3 (23.0 mg) and 4 (13.0 mg).
Calculated NMR
The Spartan’14 software (Wavefunction, Inc.) provides new options for NMR calculations. To know which method would be better for offer values closer to the experimental, the DFT17 and the Hartree-Fock (HF)18 methods were tested
with reference compounds from the literature, to define which one would be the most appropriate. After these tests, DFT was the best method, chosen for this work. These ligands structures were constructed and energy-minimized first with the PM6 method.19 Then, DFT method was used
for a second minimization, considering the presence of a solvent, preferably the one used in the experimental procedure, and the generation of the NMR spectra.
Cytotoxic activity
The cytotoxic activity was performed using tumor cell lines, SF-295 (glioblastoma), PC-3 (prostate) and HCT-116 (colon) (National Cancer Institute, USA). The cell lines were cultured in RPMI 1640 supplemented with 10% fetal bovine serum and 1% antibiotic, which were incubated at 37 °C and in an atmosphere containing 5% CO2. Samples were
diluted in DMSO and tested at a concentration of 5 µg mL-1.
Cells were plated at a concentration of 0.1 × 10⁶ cells mL-1
for strains SF-295 and PC-3 and 0.7 × 10⁵ cells mL-1
for the strain HCT-8 and incubated for 72 hours in an oven. Subsequently the samples were centrifuged and the supernatant was removed. Then 150 µL of 3-(4,5-dimethyl-2-thiazol)-2,5-diphenyl-2H-tetrazolium bromide (MTT) solution were added and the plates were incubated for 3 h. The absorbance was measured after dissolution of the precipitate with 150 µL of DMSO in plate spectrophotometer at 595 nm. Cell viability was evaluated by reduction of the yellow dye (MTT) to a blue product as described by Mosmann.20Doxorubicin was used as a positive control.
Brazoide A (1)
Amorphous white solid; mp 199-203 °C; [α]D20 +16.5°
(c 0.1, MeOH); IR (KBr) νmax / cm-1 3328, 2915, 2851,
1675, 1603, 1453, 1411, 1233, 1083; 1H (600 MHz,
MeOH) and 13C (150 MHz, MeOH) NMR data, see Table 1;
HRESIMS (positive mode) m/z, calcd. for C17H23NO8
[M + Na]+: 392.1316, found: 392.1315.
Brazoide B (2)
Yellow resin; [α]D20 +14.43° (c 0.1, MeOH); IR (KBr)
νmax / cm-1 3419, 2909, 2847, 1723, 1661, 1453, 1463, 1422,
1245, 1068; 1H (600 MHz, MeOH) and 13C (150 MHz,
MeOH) NMR data, see Table 1; HRESIMS (positive mode) m/z, calcd. for C17H23NO7 [M + Na]+: 376.1367,
found: 376.1362.
Brazoide C (3)
Yellow resin; [α]D20 –2.2° (c 0.1, MeOH); IR (KBr)
νmax / cm-1 3364, 2982, 2923, 1725, 1646, 1503, 1443,
1298, 1233; 1H (500 MHz, MeOH) and 13C (125 MHz,
MeOH) NMR data, see Table 4; HRESIMS (positive mode) m/z, calcd. for C18H27N2O9 [M + H]+: m/z 415.1711, found:
415.1738; HRESIMS (negative mode) m/z, calcd. for C18H25N2O9 [M − H]−: 413.1566, found: 413.1560.
Brazoide D (4)
Yellow resin; [α]D20 +14.66° (c 0.1, MeOH); IR (KBr)
νmax / cm-1 3357, 2972, 2822, 1732, 1667, 1624, 1453, 1411,
1297, 1254; 1H (500 MHz, MeOH) and 13C (125 MHz,
MeOH) NMR data, see Table 4; HRESIMS (positive mode) m/z, calcd. for C18H27N2O8 [M + H]+: 399.1762,
found: 399.1774; HRESIMS (positive mode) m/z, calcd. for C18H25N2O8 [M − H]−: 397.1616, found: 397.1610.
Results and Discussion
Successive chromatographic columns of the EtOH extract of J. gendarussa leaves followed by HPLC led to the isolation of compounds 1-4. The structures of the compounds were determined using IR, NMR (1D and 2D), HRESIMS and molecular modeling.
Compound 1 was isolated as a yellow resin. The molecular formula C17H23NO8 (seven degrees of
unsaturation) was deduced from quasi-molecular ion peak at m/z 392.1315 ([M + Na]+, calcd. m/z 392.1316), observed
in the HRESIMS, in conjunction with the 1H NMR (1D
and 2D 1H-1H correlation spectroscopy (COSY)) spectra
and 13C NMR data deduced by experiments ({1H} and
heteronuclear single quantum correlation (HSQC)) that revealed the presence of two methyl groups, three methylenes (all sp3, including one oxygenated at dC 63.0),
six methine carbons [three sp3 oxygenated represented by
two signals at dC 86.9 (CH-1’) and 69.0 (CH-10 and CH-12) and three sp2 aromatic carbons], along with quaternary
carbon atoms (five sp2 carbons including two carbonyl
groups at dC 173.9 and 176.0, one oxygenated at dC 157.4, one nitrogenated at dC 135.5 and one sp3 oxygenated at dC
82.9) (Table 1). The absorption bands in the IR spectrum at
νmax 3328, 1675, 1603 cm-1 showed the presence of hydroxyl
and carbonyl groups.
The 1H NMR spectrum showed signals attributed
(meta-coupling, J 2.4 Hz, H-2) and 7.09 (ortho-coupling, J 8.4 Hz, H-5), as well as double doublet at dH 6.82 (meta/ ortho-coupling, J 2.4 and 8.4 Hz, H-4), compatible with trisubstituted aromatic ring. It was also observed signals corresponding to oxymethine and methyl hydrogens, among which the signal at dH 4.00 (integration for two hydrogens H-10 and H-11), and dH 1.15 (integration to six hydrogens
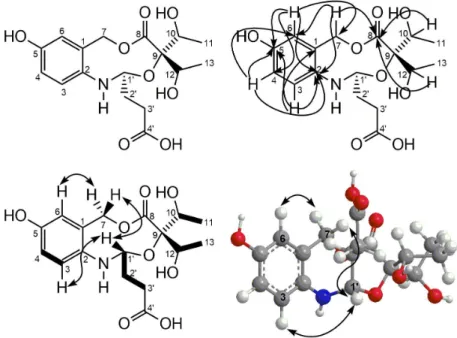
for two methyl, 3H-11 and 3H-13), was attributed to two equivalents of hydroxy-ethyl groups confirmed by correlations revealed by 1H-1H COSY spectrum, between dH 4.00 (H-10/H-12) and dH 1.15 (H-11/H-13) (Figure 2).
All proton and carbon signals were fully assigned through HSQC and heteronuclear multiple bond correlation (HMBC) spectra analyses (Table 1).
Table 1.1H (600 MHz) and 13C (150 MHz) NMR for Brazoide A (1) and Brazoide B (2), including results obtained by heteronuclear 2D shift-correlated HSQC (1J
CH) and HMBC (nJCH, n = 2 and 3), in MeOH-d4 as solvent. Chemical shifts (d, ppm) and coupling constants (J, Hz) in parenthesisa
Position 1 2
dC dH (J in Hz) HMBC dC dH (J in Hz) HMBC
1 135.5 − 2H-7, H-3 133.9 − 2H-7, H-5, H-3
2 126.5 − H-3, H-6; H-4; 2H-7 135.3 − H-6, H-4, 2H-7
3 116.4 7.09, d (8.4) H-4 128.2 7.32, d (7.8)
4 115.6 6.82, dd (2.4, 8.4) H-3 129.0 7.44, t (7.8) H-6
5 157.4 − H-6, H-4, H-3 128.2 7.41, t (7.8) H-3
6 116.4 7.05, d (2.4) H-4, 2H-7 129.8 7.61, d (7.8) H-4, 2H-7
7 63.0 5.11, m H-6 63.1 5.20-5.16, m H-6
8 173.9 − H-10/H-12, 2H-7 173.4 − 2H-7, H-10, H-12
9 82.9 − H-10/12, 3H-11/13 82.6 − 3H-11, 3H-13, H-12
10 69.0 4.00, m 3H-11 68.9 4.04, q (6.6) 3H-11
11 16.2 1.15, d (6.6) H-10 16.0 1.16, d (6.6) H-10
12 69.0 4.00, m 3H-13 69.1 3.96, q (6.0) 3H-13
13 16.2 1.15, d (6.6) H-12 16.5 1.14, d (6.0) H-12
1’ 86.9 5.46, m H-3’b 86.1 5.45, m H-3’b
2’ 27.9 1.55, m; 1.99, m 2H-3’ 28.2 2.53, m; 2.05, m 2H-3’
3’ 28.7 2.68, m; 2.49, m H-2’a 28.8 2.73, m; 2.48, m H-2’a
4’ 176.0 − 2H-3’, H-1’ 175.9 − 2H-3’
aNumber of hydrogens bound to carbon atoms deduced by comparative analysis of {1H}- and APT-13C NMR spectra. Chemical shifts and coupling constants (J) obtained of 1D 1H NMR spectrum. Superimposed 1H signals are described without multiplicity and chemical shifts deduced by HSQC, HMBC and 1H-1H COSY spectra.
The HMBC cross-peaks revealed the location of the hydroxyl on carbon C-5 and the two carbonyl groups at positions C-8 and C-4’, summarized in Table 1 and Figure 2. The relative configuration of 1 was deduced from analysis of nuclear Overhauser effect spectroscopy (NOESY) correlations between the signals at dH 5.11 (H-7) and dH 7.05 (H-6), between H-7 and dH 5.46 (H-1’), and between H-1’ and dH 7.09 (H-3) (Figure 1). Chemical calculations based on DFT can be used to provide reliable prediction of NMR parameters (1H and 13C NMR chemical
shifts). Initially, by NMR and mass spectroscopy was proposed to compound 1, three possible structures that have the same molecular formula (C17H23NO8) and molecular
weight (calcd. m/z 392.1316, [M + Na]+). These structures
showed compatibility with all NMR data presented. Thus the prediction of NMR data by DFT was important to define the structure, which was confirmed by comparison of the NMR experimental data with the NMR results of the theoretical model (Tables 2 and 3), and comparison with data reported in the literature.14 The structure of 1
was elucidated as the new alkaloid named Brazoide A in honor of the renowned researcher Raimundo Braz-Filho.
Compound 2 (Brazoide B)was obtained as a yellow resin, and was assigned the molecular formula C17H23NO7
corresponding to molecular quasi-molecular ion peak at m/z 376.1362 ([M + Na]+, calcd. m/z 376.1367), observed
in the HRESIMS, in conjunction with the 13C NMR data
(Table 1). Spectroscopic data of 2 showed to be very similar to 1 (Table 1), but the former one had a different pattern of NMR signals in the aromatic region and the absence of the hydroxylated aromatic carbon signal in the
1H and 13C NMR spectra, respectively. The structure of this
compound was confirmed by 2D NMR and the comparison with results of theoretical models (Tables 2 and 3).
Compound 3, a yellow resin, gave the molecular formula C18H26N2O9 from its positive-mode HRESIMS m/z 415.1738 ([M + H]+ calcd. m/z 415.1711), and
negative-mode HRESIMS m/z 413.1560 ([M − H]− calcd.
m/z 413.1566). The NMR spectra of 3 (Table 4) also showed many similarities with the compound 1, but it was observed an additional signal of a carbonyl carbon at dC 174.0 (C-5’). This signal was not observed in the 13C NMR spectrum, but
the HMBC cross-peak between dH 3.67 (H-4’) and dC 174.3 (C-5’) revealed the presence of the carbonyl group, and has been confirmed by HRESIMS. The analyzed spectroscopic data and comparison with data from the literature14 and
previously characterized compounds, allowed to identify the compound 3 named Brazoide C.
Compound 4, a yellow resin, gave the molecular formula C18H26N2O8 from its positive-mode HRESIMS m/z 399.1774 ([M + H]+ calcd. m/z 399.1762), and
negative-mode HRESIMS m/z 397.1610 ([M − H]− calcd.
m/z 397.1616). Compound 4 also showed to be very similar to those compounds described earlier. In comparison to 3
(Table 4), the only difference observed in the NMR spectra was the absence of the hydroxyl signals at C-5. Thus, the compound 4 was assigned as being Brazoide D. Also
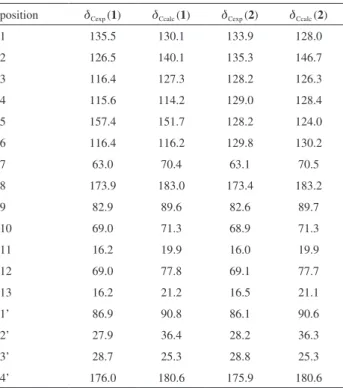
Table 2. Comparison of 13C NMR experimental data for 1 and 2, with calculated DFT-NMR
position dCexp (1) dCcalc (1) dCexp (2) dCcalc (2)
1 135.5 130.1 133.9 128.0
2 126.5 140.1 135.3 146.7
3 116.4 127.3 128.2 126.3
4 115.6 114.2 129.0 128.4
5 157.4 151.7 128.2 124.0
6 116.4 116.2 129.8 130.2
7 63.0 70.4 63.1 70.5
8 173.9 183.0 173.4 183.2
9 82.9 89.6 82.6 89.7
10 69.0 71.3 68.9 71.3
11 16.2 19.9 16.0 19.9
12 69.0 77.8 69.1 77.7
13 16.2 21.2 16.5 21.1
1’ 86.9 90.8 86.1 90.6
2’ 27.9 36.4 28.2 36.3
3’ 28.7 25.3 28.8 25.3
4’ 176.0 180.6 175.9 180.6
Table 3. Comparison of 1H NMR experimental data for 1 and 2, with calculated DFT-NMR
position dHexp (1) dHcalc (1) dHexp (2) dHcalc (2)
3 7.09, d (8.4) 6.49 7.32, d (7.8) 6.66
4 6.82, dd
(2.4, 8.4)
6.02 7.44, t (7.8) 7.07
5 7.41, t (7.8) 6.96
6 7.05, d (2.4) 6.32 7.61, d (7.8) 6.87
7 5.11, m 4.99, 5.42 5.20-5.16, m 5.03, 5.44
10 4.00, m 3.66 4.04, q (6.6) 4.19
11 1.15, d (6.6) 1.10 1.16, d (6.6) 1.31
12 4.00, m 4.19 3.96, q (6.0) 3.66
13 1.15, d (6.6) 1.32 1.14, d (6.0) 1.11
1’ 5.46, m 5.95 5.45, m 6.04
2’ 1.55, m;
1.99, m
1.62, 2.63 2.53, m; 2.05, m
2.67, 1.68
3’ 2.68, m;
2.49, m
2.15, 2.74 2.73, m; 2.48, m
isolated were the three known compounds, squalene,21
lupeol22 and the mixture of β-sitosterol and stigmasterol.23
C o m p o u n d s B r a z o i d e s A - D w e r e s u b j e c t e d to cytotoxicity tests against three strains, SF-295 (glioblastoma), PC-3 (prostate) and HCT-116 (colon), however none of the compounds showed activity against cell lines tested.
Conclusions
In this work four new alkaloides (1-4) were isolated from the EtOH extract of leaves of J. Gendarussa Burm. F. in addition to a three known compounds. The alkaloids did not show satisfactory results when subjected to cytotoxicity testing.
Supplementary Information
The supplementary information is available free of charge on the http://jbcs.org.br as a PDF file.
Acknowledgments
The authors thank CNPq/CAPES/PRONEX/FUNCAP for the fellowships and financial support. We also thank to
CENAUREMN, of the Universidade Federal do Ceará for the NMR data, and to Embrapa Agroindustria Tropical-CE for NMR and high-resolution mass spectra.
References
1. Corrêa, G. M.; Alcântara, A. F. C.; Braz. J. Pharmacog.2012,
22, 220.
2. Wasshausen, D. C.; Brittonia 2002, 54, 286. 3. Kottaimuthu, R.; Phytotaxa 2015, 213, 70. 4. Braz, D. M.; Phytotaxa 2015, 236, 184.
5. Oliveira, A. F. M.; Andrade, L. H. C.; Acta Amaz.2000, 30, 569.
6. Sonal, P.; Maitreyi, Z.; Asian J. Tradit. Med. 2011, 6, 61. 7. Senthilkumar, N.; Varma, P.; Gurusubramanian, G.; Parasitol.
Res.2009, 104, 237.
8. Bhagya, N.; Chandrashekar, K. R.; AsianJ. Pharm. Clin. Res. 2013, 6, 100.
9. Uddin, S.; Sinha, S.; Hossain, A.; Kaisar, A.; Hossain, K.; Rashid, M. A.; Dhaka Univ. J. Pharm. Sci. 2011, 10, 53. 10. Bhagya, N.; Chandrashekar, K. R.; Kalluraya, B.; Chem. Nat.
Compd. 2013, 49, 972.
11. Bachheti, R. K.; Pandey, D. P.; Joshi, A.; Rana, V.; Int. J. ChemTech Res. 2011, 3, 244.
12. Prajogo, E. W. B.; Guliet, D.; Queiroz, E. F.; Wolfender, J.
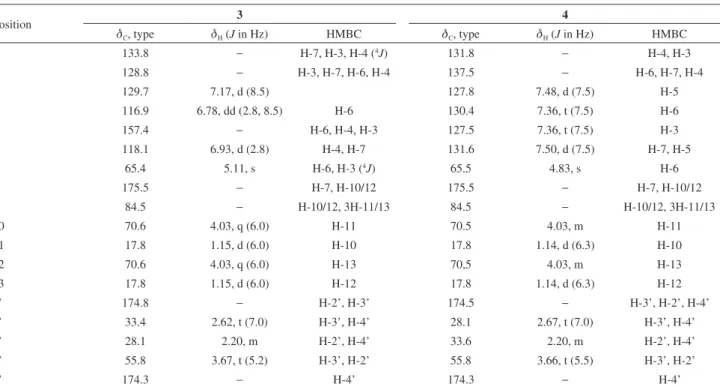
Table 4. 1H (500 MHz) and 13C (125 MHz) NMR for Brazoide C (3) and Brazoide D (4), including results obtained by heteronuclear 2D shift correlated HSQC (1J
CH) and HMBC (nJCH, n = 2 and 3), in MeOH-d4 as solvent. Chemical shifts (d, ppm) and coupling constants (J, Hz) in parenthesisa
Position 3 4
dC, type dH (J in Hz) HMBC dC, type dH (J in Hz) HMBC
1 133.8 − H-7, H-3, H-4 (4J) 131.8 − H-4, H-3
2 128.8 − H-3, H-7, H-6, H-4 137.5 − H-6, H-7, H-4
3 129.7 7.17, d (8.5) 127.8 7.48, d (7.5) H-5
4 116.9 6.78, dd (2.8, 8.5) H-6 130.4 7.36, t (7.5) H-6
5 157.4 − H-6, H-4, H-3 127.5 7.36, t (7.5) H-3
6 118.1 6.93, d (2.8) H-4, H-7 131.6 7.50, d (7.5) H-7, H-5
7 65.4 5.11, s H-6, H-3 (4J) 65.5 4.83, s H-6
8 175.5 − H-7, H-10/12 175.5 − H-7, H-10/12
9 84.5 − H-10/12, 3H-11/13 84.5 − H-10/12, 3H-11/13
10 70.6 4.03, q (6.0) H-11 70.5 4.03, m H-11
11 17.8 1.15, d (6.0) H-10 17.8 1.14, d (6.3) H-10
12 70.6 4.03, q (6.0) H-13 70,5 4.03, m H-13
13 17.8 1.15, d (6.0) H-12 17.8 1.14, d (6.3) H-12
1’ 174.8 − H-2’, H-3’ 174.5 − H-3’, H-2’, H-4’
2’ 33.4 2.62, t (7.0) H-3’, H-4’ 28.1 2.67, t (7.0) H-3’, H-4’
3’ 28.1 2.20, m H-2’, H-4’ 33.6 2.20, m H-2’, H-4’
4’ 55.8 3.67, t (5.2) H-3’, H-2’ 55.8 3.66, t (5.5) H-3’, H-2’
5’ 174.3 − H-4’ 174.3 − H-4’
L.; Cholies, Z. N.; Aucky, H.; Hostettmann, K.; Folia Med. Indonesiana2009, 45, 28.
13. Wahi, S. P.; Wahi, A. K.; Kapoor, R.; JRIM 1974, 9, 65. 14. Kiren, Y.; Deguchi, J.; Hirasawa, Y.; Morita, H.; Prajogo, B.; J.
Nat. Med.2014, 68, 754.
15. Chakravarty, A. K.; Dastida, R. P. P. G.; Pakrash, S. C.;
Tetrahedron 1982, 38, 1797.
16. Ferri, P. H. In Plantas Medicinais: Arte e Ciência - Um Guia de Estudo Interdisciplinar; Di Stasi, L. C., ed.; Editora UNESP:
São Paulo, p. 129.
17. Hohenberg, P.; Kohn, W.; Phys. Rev. B1964, 136, 864. 18. Hartree, D. R.; The Calculation of Atomic Structure; Wiley:
New York, USA, 1957.
19. Stewart, J. J. P.; J. Mol. Model. 2007, 13, 1172. 20. Mosmann, T.; J. Immunol. Methods 1983, 65, 55.
21. Cursino, L. M. C.; Mesquita, A. S. S.; Mesquita, D. W. O.; Fernandes, C. C.; Pereira Júnior, O. L.; Amaral, I. L.; Nunez, C. V.; Acta Amaz.2009, 39, 171.
22. Silva, F. O.; Oliveira, I. R.; Silva, M. G. V.; Braz-Filho, R.;
Quim. Nova2010, 33, 1874.
23. Souza, A. D. L.; Rocha, A. F. I.; Pinheiro, M. L. A. B.; Andrade, C. H. S.; Galotta, A. L. A. Q.; Santos, M. P. S. S.; Quim. Nova 2001, 24, 439.
Submitted: August 18, 2016