AR
TIGO ORIGINAL / ORIGINAL AR
TICLE
INTRODUCTION
Stomach cancer is a major contributor to mortality worldwide, but its incidence varies widely around the world in a way that our current understanding of etiology can not fully explain. According to GLO BOCAN 2008, about one million new cases of stom ach cancer was estimated in 2008 (988,000 cases, 7.8% of total), making it currently the fourth most common malignancy in the world behind lung cancer, breast and colorectal(1). Over 70% of cases (713,000 cases) occur in developing countries (467,000 men, 246,000 women), and half of the world total occurs in East Asia (especially China)(28).
Standardized incidence rates by age are twice as high in men as in women, ranging from 3.9 in North Africa to East Asia to 42.4 in men and 2.2 in South Africa to 18.3 in East Asia for women. Stomach cancer is the second leading cause of cancer death in both sexes worldwide (736,000 deaths, 9.7% of total). The highest mortality rates are estimated in East Asia (28.1 per 100,000 in men, 13.0 per 100,000 in women), the lowest in North America (2.8 and 1.5 respectively). High mortality rates are also present in both sexes in Central and Eastern Europe and Central and South America(13, 28).
TREND OF MORTALITY RATES FOR
GASTRIC CANCER IN BRAZIL AND REGIONS
IN THE PERIOD OF 30 YEARS (1980-2009)
Raphael Mendonça
GUIMARÃES
1and Camila Drumond
MUZI
2ABSTRACT – Context The most recent global estimate revealed the presence of about one million new cases of stomach cancer for
the year 2008, setting itself as the fourth most common cause of cancer. Objective The present study aims to assess the trend of
mortality from stomach cancer in Brazil according to regions between 1980 and 2009. Methods Data on deaths from stomach cancer were obtained from the Mortality Information System, and the demographic data, from the Brazilian Institute of Geography and Statistics. The rates of mortality were standardized by age according to world population. The trend curves were calculated for Brazilian regions by sex. The technique used was polynomial regression and joinpoint. Results The tendency for males and females
is similar in all regions, although the magnitude is higher among men in all places. Regions Midwest, South, Southeast tended to decline, while the Northern region showed no signiicant trend, and the Northeast tended to increase. Conclusion It is therefore a need to evaluate public health policies for gastric cancer aimed at the demographic transition (change of urbanization and lifestyle) that is occurring throughout the country.
HEADINGS – Stomach neoplasms, mortality. Stomach neoplasms, epidemiology. Brazil.
Declared conflict of interest of all authors: none.
1 Instituto de Estudos em Saúde Coletiva, Departamento de Medicina Preventiva, Universidade Federal do Rio de Janeiro; 2 Instituto Nacional do Câncer, Hospital do
Câncer I, Setor de Cirurgia Abdômino-Pélvica, Rio de Janeiro, RJ, Brasil.
Correspondence: Dr. Raphael Mendonça Guimarães - Avenida Horácio Macedo, s/n - Próximo à Prefeitura Universitária da UFRJ Ilha do Fundão - Cidade Universitária - 21941-598 - Rio de Janeiro, RJ, Brazil. E-mail: [email protected]
In the year 2012, it is estimated, for Brazil, 12,670 new cases of stomach cancer in men and women in 7,420. These values correspond to an estimated risk of 13 new cases per 100,000 men and 7 women to every 100,000. Without considering the nonmelanoma skin cancers, stomach cancer in men is the second most frequent in the North (11/100,000) and Northeastern (9/100,000) and fourth in the South (16/100,000), Southeast (15/100,000) and Midwest (14/100,000). For women, ranks fourth in the North (6/100,000), ifth in the Midwest (7/100,000) and sixth in the Southeast (9/100,000), Southern (8/100,000) and Northeast (6/100,000)(17).
Incidence data are scarce in Brazil, results inconsis tent data records and population bases are few studies on the etiologic pathway of carcinogenesis. Thus, the best evidence for the study of the magnitude of the problem in Brazil is the study of mortality in the country(6). Thus, this study aims to assess the trend of mortality from stomach cancer in Brazil according to regions between 1980 and 2009.
METHODS
and regions in the period 1980 to 2009. Data on death were obtained from the SIM (Mortality System Information) from the Ministry of Health and the demographics of the Brazi lian Institute of Geography and Statistics (IBGE), available
at DATASUS. The iles were extracted in DBC format(10).
The deaths for the period 1980 to 1995 were obtained considering the encoding of the Ninth Revision of the In ternational Statistical Classiication of Diseases and Related Health Problems (ICD9), from 1996 to 2006, used the Tenth Revision (ICD10). The codes are included, respectively, 151(8) and C16(9).
The trend of standardized mortality rates was assessed by polynomial regression, considering the rates standardized
according to world population(6) mortality from stomach
cancer, according to sex, and stratiied by Brazilian regions (Midwest, Northeast, North, Southeast, and South).
Initially, we made scatter diagrams between mortality rates and years of study, to visualize the kind of relationship between them. After that, we started the process of modeling, considering the mortality rates as the dependent variable (Y) and years of study as an independent variable (X). To study
the trend, we chose to estimate regression models. To avoid collinearity between the terms of the regression equation, we used time as a centeredvariable(12).
The irst model to be tested was the simple linear regres sion (Y = b0 + b1X) and then tested the models of higher order: second degree or parabolic (Y = b0 + b1X + b2X2) and third degree (Y = b0 + b1X + b2X2 + b3X3)(12). It was consi dered as the best model, the one with the highest coeficient
of determination (R2). When two models were similar, the
statistical point of view, to the same location, we chose the simplest model, i.e., the lower order. In the end, joinpoint analysis was performed in order to estimate the Average Annual Percent Change (AAPC) of the rates. Analyses were performed using SPSS® version 19 (Statistical Package for So cial Sciences) for polynomial regression and SEER Joinpoint Regression Program® version 3.5.3 for joinpoint analysis.
RESULTS
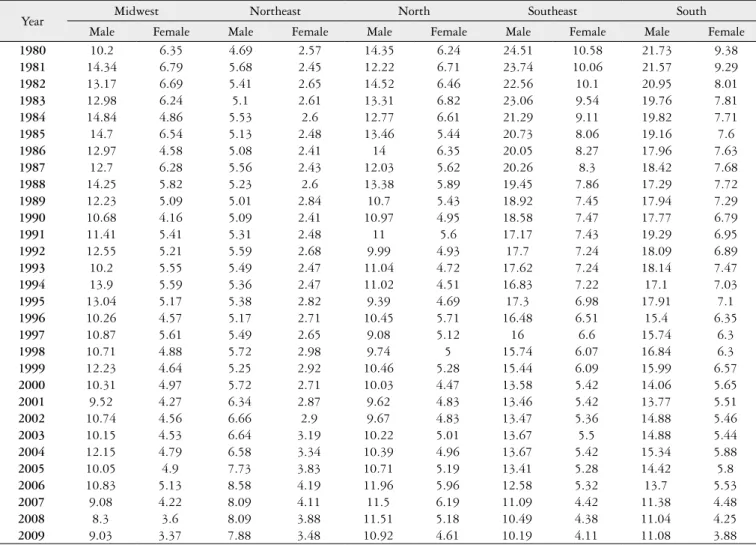
Table 1 shows the rates of stomach cancer mortality adjusted for age (by the world’s population), by sex, per
TABLE 1. Rates of stomach cancer mortality adjusted for age (by the world’s population), by sex, per 100,000 people in Brazil, according to regions, between 1980 and 2009
Year Midwest Northeast North Southeast South
Male Female Male Female Male Female Male Female Male Female
1980 10.2 6.35 4.69 2.57 14.35 6.24 24.51 10.58 21.73 9.38
1981 14.34 6.79 5.68 2.45 12.22 6.71 23.74 10.06 21.57 9.29
1982 13.17 6.69 5.41 2.65 14.52 6.46 22.56 10.1 20.95 8.01
1983 12.98 6.24 5.1 2.61 13.31 6.82 23.06 9.54 19.76 7.81
1984 14.84 4.86 5.53 2.6 12.77 6.61 21.29 9.11 19.82 7.71
1985 14.7 6.54 5.13 2.48 13.46 5.44 20.73 8.06 19.16 7.6
1986 12.97 4.58 5.08 2.41 14 6.35 20.05 8.27 17.96 7.63
1987 12.7 6.28 5.56 2.43 12.03 5.62 20.26 8.3 18.42 7.68
1988 14.25 5.82 5.23 2.6 13.38 5.89 19.45 7.86 17.29 7.72
1989 12.23 5.09 5.01 2.84 10.7 5.43 18.92 7.45 17.94 7.29
1990 10.68 4.16 5.09 2.41 10.97 4.95 18.58 7.47 17.77 6.79
1991 11.41 5.41 5.31 2.48 11 5.6 17.17 7.43 19.29 6.95
1992 12.55 5.21 5.59 2.68 9.99 4.93 17.7 7.24 18.09 6.89
1993 10.2 5.55 5.49 2.47 11.04 4.72 17.62 7.24 18.14 7.47
1994 13.9 5.59 5.36 2.47 11.02 4.51 16.83 7.22 17.1 7.03
1995 13.04 5.17 5.38 2.82 9.39 4.69 17.3 6.98 17.91 7.1
1996 10.26 4.57 5.17 2.71 10.45 5.71 16.48 6.51 15.4 6.35
1997 10.87 5.61 5.49 2.65 9.08 5.12 16 6.6 15.74 6.3
1998 10.71 4.88 5.72 2.98 9.74 5 15.74 6.07 16.84 6.3
1999 12.23 4.64 5.25 2.92 10.46 5.28 15.44 6.09 15.99 6.57
2000 10.31 4.97 5.72 2.71 10.03 4.47 13.58 5.42 14.06 5.65
2001 9.52 4.27 6.34 2.87 9.62 4.83 13.46 5.42 13.77 5.51
2002 10.74 4.56 6.66 2.9 9.67 4.83 13.47 5.36 14.88 5.46
2003 10.15 4.53 6.64 3.19 10.22 5.01 13.67 5.5 14.88 5.44
2004 12.15 4.79 6.58 3.34 10.39 4.96 13.67 5.42 15.34 5.88
2005 10.05 4.9 7.73 3.83 10.71 5.19 13.41 5.28 14.42 5.8
2006 10.83 5.13 8.58 4.19 11.96 5.96 12.58 5.32 13.7 5.53
2007 9.08 4.22 8.09 4.11 11.5 6.19 11.09 4.42 11.38 4.48
2008 8.3 3.6 8.09 3.88 11.51 5.18 10.49 4.38 11.04 4.25
100,000 people in Brazil, according to regions, between 1980 and 2009. It is observed that, historically, the male rates are larger than females, in all of the regions.
Figures 1 and 2 shows, respectively, the time serie of mortality rates for stomach cancer in Brazil according to regions for males (Figure 1) and females (Figure 2) bet ween 1980 and 2009. It was observed that the regions do not show the same trend. South, Southeast, and Midwest has a decreasing trend, for both sexes, while the Northern region shows relative stability in rates. On the other hand, the Northeast region has increased rates over the period, also for both sexes.
In fact, the linear trend was conirmed by joinpoint analy sis. When testing the modeling period to assess any effect, or some event during the series to demarcate historical change in trend over the 30 years of observation, it was observed that the trend of declining rates remained relatively homo geneous, as can observe the data in Table 2, which shows a statistically signiicant decline for the South, Southeast and Midwest. For North, there is a nonstatistically signiicant trend, and for Northeast a statistically signiicant increasing trend, for both sexes.
DISCUSSION
Malignant neoplasms are important contributors to mortality in Brazil, may be a magnitude greater than the oficial statistics and sometimes need to be corrected by 50% proportional redistribution of illdeined deaths in SIM. With this ix, the increase for all types of cancer becomes greater than 10% in the early 1980s and around 5% in 2006. As expected, the increase in capital was less than 2% in 1980, and slightly larger end of the period, which can be explained by increasing proportion of the total deaths(21) by cancers.
This paper summarizes the most current secondary data on the descriptive epidemiology of stomach cancer mortality in Brazil. The main inding of this analysis of recent trends in mortality from stomach cancer is the presence of stable and persistent declines in both sexes, both in capital and in the general Brazilian population. This is conirmed by joinpoints analysis.
Regression analysis of trends in other parts of the world shows that the decline in gastric cancer shows no evidence of stabilization not only in Brazil but also in Europe and in other areas of world(32).
TABLE 2. Results from trend analysis for stomach cancer mortality. Brazilian regions, 1980-2009
Region Sex Model R² P value (95% CI) AAPC Trend
Midwest Male y = -0.1463x + 13.881 0.5063 0.05 -1.3 (-1.7; -0.8) Decreasing
Female y = -0.0759x + 6.3219 0.5827 0.07 -1.5 (- 2.0; -1.0) Decreasing
Northeast Male y = 0.0993x + 4.413 0.6539 < 0.001 1.6 (1.1; 2.0) Increasing
Female y = 0.047x + 2.162 0.6351 < 0.001 1.5 (1.1; 2.0) Decreasing
North Male y = -0.1121x + 13.085 0.413 0.15 -0.9 (-1.4; 0.5) Non signiicant
Female y = -0.0468x + 6.1683 0.3448 0.13 -0.8 (-1.3; 0.4) Non signiicant
Southeast Male y = -0.4443x + 23.854 0.9747 0.001 -2.7 (-2.8; -2.5) Decreasing
Female y = -0.1965x + 10.007 0.9565 0.009 -2.8 (-3.0; -2.6) Decreasing
South Male y = -0.3123x + 21.555 0.8934 0.001 -1.9 (-2.2; -1.6) Decreasing
Female y = -0.1422x + 8.8622 0.8973 < 0.001 -2.2 (-2.5; -1.9) Decreasing
FIGURE 1. Time serie of mortality rates for stomach cancer in Brazil according to regions for males, 1980-2009
There is a predominance of cases in males, which is com patible with the natural history of disease and this pattern is also observed in the rest of the world(25).
The adjusted mortality rates for stomach cancer in men in Brazil is considered as an intermediate pattern, similar to Argentina, Colombia and Venezuela(14, 29). There are differences among Brazilian regions and states. In a Brazilian study it was observed that, in Belém(13) rates found in men were similar to that of Brazil(20) and in rural area of the state of Rio de Janei ro(16). On the other hand, they were higher than those observed for the state of Rio Grande do Sul(26). This inding shows that there are regional differences in mortality from stomach cancer, which may be due to cultural factors in eating patterns, the socioeconomic status and access to health services. Several factors are in explaining the differential reduction rates as a more accurate diagnosis and possibly earlier, the standardized surgical technique with high level teams in tertiary hospitals; support more specialized anesthetic, intensive care units with trained personnel and modern; nutritional assessment pre operative monitoring and more suitable food, and frequent monitoring of patients(3), and many of these associated con ditions for access and resolution of the health service, which is very heterogeneous among Brazilian regions.
With regard to women, the rates can also be classiied in the intermediate pattern and are similar to those found in the Americas, Mexico, and Venezuela(29). The Brazilian rates are higher than in developed countries such as Australia, Canada, United States, Spain, Germany and France(15, 30).
Following the global trend, Brazil showed a decrease in adjusted mortality rates of stomach cancer in both men and women on the last 30 years. This decrease was also observed
in much of Europe: Italy, the interior and Northern Spain(15), France(2), China(35), and Russia, Japan, South Korea, USA, and Australia(34).
The reasons for the general decline in rates of gastric cancer are complex and not fully understood. Almost certainly, these include a more varied diet and better food conservation, including refrigeration, as well as control of infection by Helicobacter pylori (Hpylori)(22, 23), decreasing of risk factors exposure, such as consumption of salt and salty foods, which can lead to damage of the protective layer of the mucosa of stomach(11, 22) and smoking(18).
In conclusion, despite the encouraging trends on mortali ty, stomach cancer remains a leading cause of death world wide, but further declines are likely. The decisionmaking by health managers should be based on the best approach that SIM data and other information systems that the Health System can provide. Assume the growth or decline in can cer mortality has implications for the assessment of health and may inluence the review of strategies for prevention and control. The data presented allow to draw a proile of cancer mortality in Brazil, mar kedly inluenced by unequal conditions of risk and access to services. Overcoming these inequalities necessarily the best measurement of a problem, which allows the construction of an effective policy for cancer control in different regions.
Primary prevention of stomach cancer through diet is feasible, encouraging highrisk populations to reduce the con sumption of meat and canned foods with salt, and increasing consumption of vegetables and fruits. Prevention may also be feasible through the eradication of Hpylori infection,
especially in childhood and adolescence.
Guimarães RM, Muzi CD. Tendência das taxas de mortalidade por câncer gástrico no Brasil e regiões no período de 30 anos (19802009). Arq Gastro enterol 2012;49(3):1848.
RESUMO – Contexto A mais recente estimativa mundial apontou a ocorrência de cerca de um milhão de casos novos de câncer do estômago para
o ano de 2008, conigurandose como a quarta causa mais comum de câncer. Objetivo O presente estudo tem por objetivo avaliar a tendência da
mortalidade por câncer de estômago no Brasil entre 1980 e 2009. Método Os dados sobre óbitos decorrentes de câncer de estômago foram obtidos no Sistema de Informações sobre Mortalidade e os demográicos, no Instituto Brasileiro de Geograia e Estatística. As taxas de mortalidade foram padronizadas por idade segundo população mundial. As curvas de tendência para o Brasil foram calculadas para regiões brasileiras de acordo com o sexo. A técnica utilizada foi a de regressão polinomial e por “joinpoint”. Resultados A tendência para os sexos masculino e feminino é semelhante nas
regiões, embora a magnitude seja maior entre homens em todos os locais. As regiões CentroOeste, Sul, Sudeste apresentaram tendência de declínio, enquanto a região Norte não apresentou tendência signiicativa e a região Nordeste apresentou tendência ao aumento. Conclusão Concluise, pois, sobre a necessidade de avaliar as políticas de saúde pública para câncer de estômago com vistas à transição demográica (mudanças de urbanização e estilos de vida) que está ocorrendo em todo o país.
REFERENCES
1. Azevedo, Gulnar, Mendonça, Silva. Evolução da mortalidade por câncer de estômago no Estado do Rio de Janeiro: uma comparação entre a região metro politana e o interior no período de 1979 a 1986. Cadernos de Saúde Pública 1997;13(suppl 1):7984.
2. Belot A, Grosclaude P, Bossard N, Jougla E, Benhamou E, Delafosse P, Guizard AV, Molinié F, Danzon A, Bara S, Bouvier AM, Trétarre B, BinderFoucard F, Colonna M, Daubisse L, Hédelin G, Launoy G, Le Stang N, Maynadié M, Monnereau A, Troussard X, Faivre J, Collignon A, Janoray I, Arveux P, Buemi A, Raverdy N, Schvartz C, Bovet M, ChériéChalline L, Estève J, Remontet L, Velten M. Cancer incidence and mortality in France over the period 1980–2005. Rev Épidémiol Santé Publique. 2008;56:15975.
3. Bertuccio P, Chatenoud L, Levi F, Praud D, Ferlay J, Negri N, Malvezzi M, La Vecchia C. Recent patterns in gastric cancer: a global overview. Int J Cancer. 2009;125:66673.
4. Bosetti C, Bertuccio P, Levi F, Lucchini F, Negri E, La Vecchia C. Cancer mor tality in the European Union, 1970–2003, with a joinpoint analysis. Ann Oncol. 2008;19:63140.
5. Bosetti C, Malvezzi M, Chatenoud L, Negri E, Levi F, La Vecchia C. Trends in cancer mortality in the Americas, 19702000. Ann Oncol. 2005;16:489511. 6. Chatenoud L, Bertuccio P, Bosetti C, Levi F, Curado MP, Malvezzi M, Negri
E, La Vecchia C. Trends in cancer mortality in Brazil, 19802004. Eur J Cancer Prev. 2010;19:7986.
7. Chen W, Weisburger JH, Fiala ES, Spratt TE, Carmella SG, Chen D, Hecht SS. Gastric carcinogenesis: 2chloro4methylthiobutanoic acid, a novel mutagen in salted, pickled Sanma hiraki ish, or similarly treated methionine. Chem Res Toxicol. 1996;9:5866.
8. Classiicação Estatística Internacional de Doenças e Problemas Relacionados à Saúde – CID10. Disponível em: <http://www.datasus.gov.br/cid10/v2008/cid10. htm>. Acesso em: 29/05/2012.
9. Classiicação Estatística Internacional de Doenças e Problemas Relacionados à Saúde – CID9. Disponível em: <http://www.datasus.gov.br/cid10/v2008/cid10. htm>. Acesso em: 29/05/2012.
10. DATASUS. Departamento de Informática do Sistema Único de Saúde (BR). Disponível em: <http://www2.datasus.gov.br/DATASUS/index.php>. Acesso em: 29/05/2012.
11. De Stefani E, Correa P, Boffetta P, DeneoPellegrini H, Ronco AL, Mendilaharsu M. Dietary patterns and risk of gastric cancer: a casecontrol study in Uruguay. Gastric Cancer. 2004;7:21120.
12. Doll R, Waterhouse J, Payne P. Cancer incidence in ive continents: a technical report. Berlin: International Agency for Research on Cancer; 1966.
13. Ferlay J, Shin HR, Bray F, Forman D, Mathers C, Parkin DM. Estimates of world wide burden of cancer in 2008: GLOBOCAN 2008. Int J Cancer. 2010:127:2893917. 14. Ferretti S, Gafà L. Upper gastrointestinal tract cancers: oesophagus, stomach,
liver, gallbladder and biliary ducts, pancreas. Epidemiol Prev. 2004;28:3442. 15. GarcíaEsquinas E, PérezGómez B, Pollán M, Boldo E, FernándezNavarro, P,
Lope V, Vidal E, LópezAbente G, Aragonés N. Gastric cancer mortality trends in Spain, 19762005, differences by autonomous region and sex. BMC Cancer. 2009;9:34655.
16. Hallal CAL, Gotlieb SLD, Latorre MRDO, Hallal AL, Gotlieb SLD, Latorre MRDO. Evolução da mortalidade por neoplasias malignas no Rio Grande do Sul, 19791995 Rev Bras Epidemiol. 2001;4:16877.
17. Instituto Nacional de Câncer. Estimativa 2012: incidência de câncer no Brasil. Rio de Janeiro: INCA; 2011.
18. La Torre G, Chiaradia G, Gianfagna F, De Lauretis A, Boccia S, Mannocci A, Ricciardi W. Smoking status and gastric cancer risk: an updated metaanalysis of casecontrol studies published in the past ten years. Tumori. 2009;95:1322. 19. La Vecchia C, Negri E, Franceschi S, Decarli A. Casecontrol study on inluence
of methionine, nitrite, and salt on gastric carcinogenesis in northern Italy. Nutr Cancer. 1997;27:658.
20. Latorre MRDO. A mortalidade por câncer de estômago no Brasil: análise do período de 1977 a 1989. Cad Saúde Pública. 1997;13(supl 1):6778.
21. Latorre MRDO, Cardoso MRA. Análise de séries temporais em epidemiologia: uma introdução sobre os aspectos metodológicos. Rev Bras Epidemiol. 2001;4:14552. 22. Lee SA, Kang D, Shim KN, Choe JW, Hong WS, Choi H. Effect of diet and
Helicobacter pylori infection to the risk of early gastric cancer. J Epidemiol. 2003;13:1628.
23. Meine GC, Rota C, Dietz J, Sekine S, Prolla JC. Relationship between cagAposi tive Helicobacterpylori infection and risk of gastric cancer: a case control study in Porto Alegre, RS, Brazil. Arq Gastroenterol. 2011;48:415.
24. Negri E, La Vecchia C, D’Avanzo B, Gentile A, Boyle P, Franceschi S. Salt prefe rence and the risk of gastrointestinal cancers. Nutr Cancer. 1990;14:22732. 25. Nomura A. Stomach cancer. In: Schottenfeld D, Fraumeni JF Jr, editors. Cancer
epidemiology and prevention. New York: Oxford University Press; 1996. p. 70724. 26. Oliveira Jr FJM, Cesse EAP. Morbimortalidade do câncer na cidade do Recife
na década de 90. Rev Bras Cancerol. 2005;51:2018.
27. Pereira LP, Waisberg J, André EA, Zanoto A, Mendes Jr JP, Soares HP. Detection of Helicobacterpylori in gastric cancer. Arq. Gastroenterol. 2001;38:2406. 28. Plummer M, Franceschi S, Muñoz N. Epidemiology of gastric cancer. IARC Sci
Publ. 2004;157:31126.
29. Resende AL, Mattos IE, Koifman S. Mortalidade por câncer gástrico no Estado do Pará, 19801997. Arq Gastroenterol. 2006;43:24751.
30. Roder DM. The epidemiology of gastric cancer. Gastric Cancer. 2002;5(suppl 1):511.
31. Shikata K, Kiyohara Y, Kubo M, Yonemoto K, Ninomiya T, Shirota T, Tanizaki Y, Doi Y, Tanaka K, Oishi Y, Matsumoto T, Iida M. A prospective study of die tary salt intake and gastric cancer incidence in a deined Japanese population: the Hisayama study. Int J Cancer. 2006;119:196201.
32. Silva GA, Gamarra CJ, Girianelli VR, Valente JG. Cancer mortality trends in Brazilian state capitals and other municipalities between 1980 and 2006. Rev. Saúde Pública, 2011;45:100918.
33. Ward MH, LópezCarrillo L. Dietary factors and the risk of gastric cancer in Mexico City. Am J Epidemiol. 1999;149:92532.
34. YakoSuketomo H, Katanoda K. Comparison of time trends in stomach cancer mortality (1990–2006) in the world, from the who mortality database. Jpn J Clin Oncol. 2009;39:6223.
35. Yang L. Incidence and mortality of gastric cancer in China. World J Gastroenterol. 2006;12:1720.