Revista
de
Administração
http://rausp.usp.br/ RevistadeAdministração52(2017)70–80
Strategy
and
Business
Economics
Ticket
consumption
forecast
for
Brazilian
championship
games
Previsão
de
consumo
de
ingressos
para
jogos
do
campeonato
brasileiro
Estimación
de
consumo
de
entradas
de
partidos
del
campeonato
brasile˜no
Adriana
Bruscato
Bortoluzzo
a,∗,
Mauricio
Mesquita
Bortoluzzo
b,
Sérgio
Jurandyr
Machado
c,
Tatiana
Terabayashi
Melhado
a,
Pedro
Iaropoli
Trindade
a,
Bruno
Santos
Pereira
aaInsperInstitutodeEnsinoePesquisa,SãoPaulo,SP,Brazil bUniversidadePresbiterianaMackenzie,SãoPaulo,SP,Brazil
cSecretariadePolíticaEconômica,Brasília,DF,Brazil
Received19February2016;accepted10August2016 Availableonline10October2016
Abstract
Fortheefficiencyofsalesandmarketingmanagementofathleticclubs,itiscrucialtofindawaytoappropriatelyestimatethelevelofdemand forsportingevents.Morepreciseestimatesallowforanappropriatefinancialandoperationalplanandahigherqualityofservicedeliveredtothe fans.ThefocusofthisstudyistoanalyzeandforecasttheticketconsumptionforsoccergamesinBrazilianstadiums.Wecomparetheresults oftheregressionmodelwithnormallydistributederrors(benchmark),theTOBITmodelandtheGammageneralizedlinearmodel.Themodels includeexplanatoryvariablesrelatedtotheeconomicenvironment,productquality,aswellasmonetaryandnon-monetaryincentivesthatpeople aregiventoattendsportingeventsatstadiums.Weshowthatmostofthesevariablesarestatisticallysignificanttoexplaintheamountoffansthat gotostadiums.WeuseddifferentmeasuresofaccuracytoevaluatetheperformanceofdemandforecastsandconcludedthatGammageneralized linearmodelpresentedbetterresultstoforecasttheticketconsumptionforBrazilianchampionshipgames,whencomparedtoabenchmark. ©2016DepartamentodeAdministrac¸˜ao,FaculdadedeEconomia,Administrac¸˜aoeContabilidadedaUniversidadedeS˜aoPaulo–FEA/USP. PublishedbyElsevierEditoraLtda.ThisisanopenaccessarticleundertheCCBYlicense(http://creativecommons.org/licenses/by/4.0/).
Keywords: Sportsmanagement;GLM;Ticketconsumption;Soccer
Resumo
Aestimac¸ãodademandaemeventosesportivoséumaquestãocrucialparaaavaliac¸ãodaeficiênciadevendasegestãodemarketingdeclubes desportivos.Estimativasmaisprecisaspermitemquesejafeitoumplanofinanceiroeoperacionalmaisadequadoequeoservic¸oprestadoaos fãspossuamaiorqualidade.Ofocodesteestudoéanalisarepreveroconsumodeingressosemjogosdefutebolnosestádiosbrasileiros.Foram comparadososresultadospreditivosdomodeloderegressãocomerrosnormalmentedistribuídos(benchmark),domodeloTobitedomodelolinear generalizadocomdistribuic¸ãoGama.Osmodelosincluemvariáveisexplicativasrelacionadascomoambienteeconômico,aqualidadedoproduto, bemcomoincentivosmonetáriosenãomonetáriosqueaspessoaspossuemparaassistiremaosjogosnosestádios.Amaioriadessasvariáveisfoi estatisticamenterelevanteparaexplicaraquantidadedepúblicopagantenosestádios.Foramutilizadasdiferentesmedidasdequalidadedeprevisão
∗Correspondingauthorat:RuaQuatá300,04546042SãoPaulo,SP,Brazil. E-mail:[email protected](A.B.Bortoluzzo).
PeerReviewundertheresponsibilityofDepartamentodeAdministrac¸ão,FaculdadedeEconomia,Administrac¸ãoeContabilidadedaUniversidadedeSãoPaulo –FEA/USP.
http://dx.doi.org/10.1016/j.rausp.2016.09.007
paraavaliarodesempenhodasprevisõesdedemandaeconcluímosqueomodelolineargeneralizadocomdistribuic¸ãoGamaapresentoumelhores resultadosparaprevisãodoconsumodeingressosparaosjogosdoCampeonatoBrasileirodefutebol,quandocomparadosaobenchmark. ©2016DepartamentodeAdministrac¸˜ao,FaculdadedeEconomia,Administrac¸˜aoeContabilidadedaUniversidadedeS˜aoPaulo–FEA/USP. PublicadoporElsevierEditoraLtda.Este ´eumartigoOpenAccesssobumalicenc¸aCCBY(http://creativecommons.org/licenses/by/4.0/).
Palavras-chave:Gestãoesportiva;GLM;Demandadeingressos;Futebol
Resumen
Laestimacióndelademandaeneventosdeportivosesuntemacrucialparalaevaluacióndelaeficienciadeventasygestióndemarketingdeclubes deportivos.Estimacionesmásprecisaspermitenquesecreeunplanfinancieroyoperativomásadecuadoyqueseofrezcaunserviciodemejor calidadalosaficionados.Elobjetivodeesteestudioesanalizaryestimarelconsumodeentradasparapartidosdefútbolenlosestadiosbrasile˜nos. Sehancomparadolosresultadosdelmodeloderegresiónconerroresnormalmentedistribuidos(benchmark),delmodeloTobitydelmodelo linealgeneralizadocondistribuciónGamma.Losmodelosincluyenvariablesexplicativasrelacionadasconelentornoeconómico,lacalidaddel productoylosincentivosmonetariosynomonetariosqueseofrecenalaspersonasparaqueasistanalospartidosenlosestadios.Sedemuestra quelamayoríadeestasvariableshasidoestadísticamentesignificativaparaexplicarlacantidaddepersonasquepaganparairalosestadios. Sehanutilizadodiferentesmedidasdecalidaddeestimaciónparaevaluareldesempe˜nodelasprevisionesdedemandaysehaconcluidoqueel modelolinealgeneralizadocondistribuciónGammamuestramejoresresultadosparaestimarelconsumodeentradasdelospartidosdefútboldel CampeonatoBrasile˜no,encomparaciónconelbenchmark.
©2016DepartamentodeAdministrac¸˜ao,FaculdadedeEconomia,Administrac¸˜aoeContabilidadedaUniversidadedeS˜aoPaulo–FEA/USP. PublicadoporElsevierEditoraLtda.Esteesunart´ıculoOpenAccessbajolalicenciaCCBY(http://creativecommons.org/licenses/by/4.0/).
Palabrasclave: Gestióndeportiva;GLM;Demandadeentradas;Fútbol
Introduction
Soccerplaysanundeniably important rolenot onlyinthe contextof Brazilian sports, but also inthe worldof interna-tionalsports.Nevertheless,Braziliansoccerclubs,someofthem atover100yearsold,havemanyorganizationalproblemsand are,ingeneral,overwhelmedwithchronicmismanagement.The professionalizationofthesportanditscommandstructuresare weakandlagbehindthelevelsoforganizationanddevelopment achievedbyitsEuropeancounterparts.
AsthemostpopularsportinBrazil,5.7millionfansattended soccergamesinBrazilianstadiumsduringthe 2013season– according tothe Brazilian SoccerConfederation (CBF) – an amount that could be considered meager when compared to the 13.6million fansthat attendedgames in Premier League stadiums during the same season (2012–2013). The flood of Europeanfanstotheirstadiums,especiallysincethe1990s,is adirectresultofthehighorganizationalstandardsofthe Euro-peanleagues(Sloane,1997).Thesehighstandardsmaintained inEuropeallowthemajorclubstoreachmaximumattendance capacityintheir stadiumsfor virtuallyeverygameofthe sea-son.InBrazil,bycontrast,thenumberoffansattendinggames hasbeendecliningoverthepastdecades(Giovannetti,Rocha, Sanches,&Silva,2006).
Planningisalwaysbasedoncertainassumptionsaboutthe futurecourseofevents.Futureconditionsareoftendifficultto forecast, and cannever be predicted perfectly. Yet, the mar-keterortheadministratormustplanandmakedecisionsusing whatconstitutesthe bestestimateaboutfuturedevelopments. Withoutaproperconsumption forecast,themarketing execu-tive cannot determine the type of marketing program touse in orderto attain the desired sales and marketing objectives (Santos,Bazanini,&Ferreira,2014).Therefore,evaluatingthe consumptionpotentialandpreparingaconsumptionforecastis
animportantfunctionofsalesandmarketingmanagers.Mentzer andMoon(2005)definedemandforecastas“aprojectioninto thefutureofexpecteddemand,givenastatedsetof environmen-talconditions”.Accordingtothem,oneofthekeymeasuresof salesforecastingperformanceistheaccuracyoftheforecast.For thispurpose,itisessentialtoidentifyandunderstandthefactors, bothpositiveandnegative,thatinfluenceattendanceatsporting events.Theaforementionedanalyseswillproveinstrumentalin Brazilianclubsastheseclubsseektoincreaseattendance,and willthuscontributetomoreefficientandprofessional manage-mentofthesport.Thefocusofthisstudy,therefore,istoexamine theticketconsumptionforsoccerstadiumsinBrazilthroughan analysisofthepayingpublicoftheCampeonatoBrasileiroSérie A(theAleaguedivisionoftheBrazilianchampionship)between 2004and2013.Thisstudyisoneofthelongestinvestigations everconductedinsportsliteraturewithsoccerdata.
Theobjectiveofthisstudyistocontributetothesports man-agementliteratureintwoways.First,ourframeworkintegrates differenttypesofexplanatoryvariablestoexplaintheticket con-sumptionofsoccergamesinBrazil,whichincludethoserelated totheeconomicenvironment,productqualityandmonetaryand non-monetaryincentivesthatpeoplearegiventoattendSporting eventsatstadiums.Formanagers,ourpaperelucidatesthe rele-vantmeasuresthatwillbecomethefocalpointofaclub’seffort toleverageitsgamerevenues.Second,weproducemore reli-ableforecastsofsoccerticketconsumptionbyusinggeneralized regressionmodelsthatconsidersboththepositiveskewnessof consumptiondistribution,andtherestrictionduetothecapacity ofstadiums.
The remainder of this paper is divided into the follow-ingsections:Section“Literaturereviewandthedescriptionof studyvariables” presentstheliteraturereviewanddescription ofvariablesincorporatedinthemodelbasedonthetheoretical framework,Section“Statisticalmethodology”brieflydescribes themethodology,Section“Results”presentstheinterpretation ofresults,andSection“Conclusion”presentsconclusionsand suggestionsforfutureresearch.
Literaturereviewandthedescriptionofstudyvariables
Amerely superficialanalysisof the Braziliansoccer man-agementprocess is sufficient todetect the indelible need for professionalandorganizationaldevelopmentaimedtoincrease theefficiencyofmanagement(Melo,2007).AccordingtoPark, Lee,andMiller(2012),sportsteamshavethreemainsources of revenue: ticket sales, sponsorship and the sale of broad-castrights.Anumberof factorscaninfluencethedemandfor sports,includingticketprices,fans’incomeandwealth, popu-lationdensitynearthestadium,thequalityoftheteamsandthe infrastructureof thestadiumswherethematchesoccur.Thus, it is important for clubs to study how these variables affect thedemandforchampionshipgames,sotheyareabletomake reliablypredictionsofsoccerticketrevenues.
Oneofthecrucialissuesofeffectivemanagementis embod-ied in the estimation of the levels of consumption for those sporting events in which a particular club will participate throughoutthe year.Themoreprecisetheestimate,the better equippedmanagementistoappropriatelyplantheorganization’s financial andoperationalneeds.Abetterplanmayresultina higherqualityofservicedeliverytothefans, and,whynot,in abetterperformanceof the clubonthe field. Together,these twofactorsleadtoagreaternumberoffansinthestadiumand, consequently,arevenueincreasegenerated bytheevent,thus formingaprofitablecycle.
Aspointedout bySmithandGroetzinger (2010,p.4),“it ispossibleit wouldbeprofitable forteamstodroppricesfor thepurposeofincreasingthechanceofvictory,astherevenue associated withan additional win could outweigh lost ticket revenue”.Evenifthatisthecase,it isessential tounderstand consumers’demandforsoccergames(Alonso&O’Shea,2013). GarcíaandRodríguez(2002)specifiedaconsumption equa-tionwiththeuseofeconomicvariablesandproxiestocontrol factors such as quality of the match, unpredictability of the
outcome ofthegame,andtheopportunitycostfor thematch. FalterandPérignon(2000)dividedtheexplanatoryvariablesof the consumptionforsportseventsintothreegroups:variables relatedto(i)theeconomicenvironment,(ii)productquality,and (iii)incentivestogotothestadium.Weunderstandthatatthis stageoftheliterature,thegroupingoftheexplanatoryvariables betweenfactorsisstillanarbitraryquestion,especiallybecause thesetwolastpapershadworkedwithsimilarvariablesinthe end.HereweoptedtousethesamegroupingdoneinFalterand Pérignon(2000)toaneasyunderstandoftheproblem.
The groupof economic environmentvariables, alsocalled structural variables, affects the consumption of thegood (the purchaseoftickets),whichaffectstheconsumer’sbudgetandis limitedbyavailableincome.Therefore,twoproxieswere cho-sentorepresenttheeconomicenvironment:percapitaincomein thecitywherethegameoccurs(PCI)andthepopulationofthe city(POP).Thelatterwasincludedbecauseagreaterinfluxof peopleisexpectedinthosestadiumslocatedinthemostdensely populated cities. Data on thesevariableswere obtained from thewebsiteoftheBrazilianInstituteofGeographyand Statis-tics[IBGE](http://www.ibge.gov.br,retrievedin25,February, 2015).
Income elasticity of consumption measures the sensitivity of theconsumptionof agoodrelatedtochangesinconsumer income,ceteris paribusAnegativeincomeelasticityof ticket consumptionisassociatedwithinferiorgoodswhileapositive oneisassociatedwithnormalgoods. Ifincomeelasticityofa normal goodis less thanunity, it isa necessitygood, andif incomeelasticityisgreaterthanunity,itisaluxuryorasuperior good.Bird(1982)foundthatanincreaseinhouseholdincome causesadropindemandforticketsinEnglishsoccer,suggesting that soccermatchticketsareaninferiorgood.Madalozzoand Villar(2009)foundanegativerelationshipbetweentheaverage percapitaincomeandticketconsumptioninBraziliangames.
Thesecondgroupincludesthosevariablesrelatedtoproduct quality,thatis,thequalityofthesoccerteamthatsellsitstickets andthequalityoftheopponent.Thesedataseektomeasurethe performanceofthehomeandvisitingteamsinthetournament. Szymanski (2001) examined 997 games over 22 years betweenthesameteamsinboththeEnglishPremiershipandFA Cup.Theauthorstatesthatthesumofthepositionof participat-ingteams(inthechampionship)reflectsstatisticallysignificant influenceontheconsumptionoftickets;thatis,betterpositioned teamsinthechampionshiparemorelikelytohaveanincreased numberoffansinthestadiums.
Thus,theimportanceofthematchforbothhomeandvisiting teamsisrelevanttounderstandingticketconsumption.This fac-torwillberepresentedinthestudybytheteams’positionsinthe leaguewhenthoseteamsarefacingeachotherinamatch. Vari-ablesthatwillbeimportantfor thereproductionofthe match willbethepositionofthehometeam(CLH)andtheposition of the visiting team (CLV) in the league on the date of the game.
team(PGH)andbythevisitingteam(PGV)wereaddedtothe modeltomeasuretheperformancesoftheteamrightbeforethe match.Thisstemsfromthepremisethatteamswithhighervalues forthesevariablesdemonstrateimprovedqualityandefficiency. Twoothervariablesthatseektomeasuretheexpectedquality ofgamesareaddedtothemodel.Thesevariablesrepresentthe sumofthegoalsscoredbythehometeam(GLH)andthevisiting team(GLV),inthethreepreviousroundstothegameinquestion. Itis impliedthat the greater the numberof goalsscored,the higherthequalityof thematch,as goalscoringisthepart of thegamethefansenjoyandappreciatemost.Gameswithmore goalstendtobeviewedasmoreentertaininggames,aspointed outbyCalster,Smits,andHuffel(2008).
Theimportance of thematchinthe leaguecanalso affect ticketconsumption.Asachampionshipseriesprogresses,the highertherelativevalueofthegame and,therefore,the more attendees.Forthisreason,agiventargetleaguewillbedivided into two phases for analysis; furthermore, the beginning and the ending of each phase will also be considered. Thus, the tournamentwillbe dividedinto fourpartstodifferentiatethe degreeofrelative importanceof matchesthat occur at differ-enttimesduringtheseason.Wewillhavevariablesindicating parts 2 (PT2), 3 (PT3) and 4 (PT4), and it is expected that as the championship rounds advance, public attendance will increase.
Therivalrybetweenteamsisdirectlyrelatedtothedegreeof importanceofamatch.Thehighertheequilibriumandrivalry betweenthe teams,the greater the interestof the fans inthe match;thus,thereshouldbeanincreaseintheticket consump-tion for the game. Aiming to represent the effect of rivalry betweenteams,a dummyvariable wasincluded betweenthe mosttraditionalteamsofthesamestate(CLS).Dueto histori-callyhighcompetitivenessbetweentwoin-stateteamsandthe greatrivalrybetweenthefans,thesematchesareexpectedtobe ofhighquality(Wooten,March5,2015).
AvariabletorepresentthepresenceofabigteamfromSao PauloorRiodeJaneiroasaguestofamatch(BIG)hasalsobeen addedtothemodel becausetheseteams havegreathistorical importanceinBraziliansoccerandhavemanyfansthroughout thecountry.Thisvariableassumesavalue1whenahometeam thatisnotfromSaoPauloorRiodeJaneirofacessuchteams asCorinthians,Palmeiras,SaoPaulo,Santos,Flamengo, Flumi-nense,BotafogoorVasco,andassumesavalueofzeroforother cases.Itisexpectedthat thepresenceofbigclubsfromthese twostateswillincreaseticketconsumption.
Thethird group of variablesrepresentsthe incentives that fansaregiventoattendasoccermatchatthestadium.Thereis asignificantmonetary incentiveassociated withticketprices. Accordingly, a variable representing the average ticket price (PRC)wasincluded,anditwasobtainedbydividingtheincome earnedinthegamebythenumberofpayingattendees.When priceelasticityoftheconsumptionofagoodiselastic,lowering itspricecausesanincreaseinrevenues,andwhenits consump-tionis inelasticrevenuesfall.Several studiesfound evidence ofinelasticconsumptionforticketsacrosssportsandcountries: Jennett(1984)intheScottishsoccerleague,BorlandandLye (1992)in the AustralianRules soccer, García andRodríguez
(2002) in the Spanish soccer league, Madalozzo and Villar (2009)forBraziliansoccerleague,andNilon(2010)forEnglish PremierLeague.
According to Kotler (1975), nonprofit organizations do not seek to stablish a price to profit maximization; instead, they try to stablish a “fair” price, according to its costs. Furthermore, thereare practical problemsinusing the profit-maximizing price among which we highlight: the trade-off between short-term and long-term profit; possibility of boy-cottofsupportersand;impossibilityofaccuratelyestimatethe demand.
InBrazil,football firms(hooligans),anddirectorsattached tothem,tendtoputpressureonthemanagerinthe establish-mentofalessaustere pricingpolicy.Ahighpricecouldthen cause variousproblemstothe manager.In the shortterm, he wouldhavetodealwithpublicdissatisfactionandpossibleloss ofmandate,whileinthelongrunhecanhaveagreatreduction ofsupporters(marketshare).Therefore,webelievethatmostof thetimetheleadersaremoreconcernedwithchargingaprice that coversthe operatingcostsof thestadiumthaninearning incomefrommatches.
Atleastintheshortterm,thefootballclubsaremonopolists inhomematches.Theyaretheonlysuppliersandsetthepriceof aticketdepartureofhisteam.Asonecanconsider,themarginal costofaticketsoldiszero(allcostsofafootballstadiumare fixed),themonopolyprofitmaximizationproblemcomesdown to maximizerevenue inthat match. Thisrequires selling the ticketatapricewheredemandhasaunitaryelasticity.Ifdemand iselastic,thantheleadercanincreasethenumberofviewersand profitwhileonlyloweringthepriceofadmission,whichwould leadtosatisfactionoffansandincreaseprofitatthesametime. However, ifdemand is inelastic,the profit increasewill only occurwithanincreaseinpriceanddissatisfactionofthefans. Soiftheestimateddemandisinelastic,wehavestrongevidence thattheleadersaremoreconcernedwiththesatisfactionoffans andlesswithprofit.
Therearealsoseveral“non-monetaryincentives”.According toKnowles,Sherony,andHaupert(1992)andSimmons(1996), the time and dayof the week inwhich games occur have a significantinfluenceonticketconsumption.Theauthors demon-stratethatmatchesheldduringtheeveningaremoreattractive tothepublicthandaytimegamesheldduringtheweek. Week-end games are evenmore attractivethan thoseplayed in the eveningsonweekdays.Variablesusedtoconveythesedesired effectsaregamesonweekends(WND)andgamesonweekdays after9:00PM(NGT).
Table1
Listofexplanatoryvariablesandtheexpectedeffect.
Variable Description Expected
effect
Economicenviromentvariables
PCI Annualpercapitaincomeinthe citywherethegametakesplace (inR$)
−
POP Citypopulationwherethegame occurs
+
Variablesrelatedtoproductquality(soccerspecificvariables)
CLH Classificationofthehometeam − CLV Classificationofthevisitingteam − PGH Pointswonbythehometeamin
thepast3games
+
PGV Pointswonbythevisitingteam inthepast3games
+
GLH Goalsscoredbythehometeamin thepast3games
+
GLV Goalsscoredbythevisitingteam inthepast3games
+
PT2 Value1ifthematchoccursonthe 2ndstageofthechampionship
+
PT3 Value1ifthematchoccurson the3rdstageofthechampionship
+
PT4 Value1ifthematchoccurson the4thstageofthechampionship
+
CLS Value1ifthematchisconsidered aclassic
+
BIG Value1ifthegamehasamajor leagueteamfromSPorRJ
+
Incentivevariables
PRC Averageticketprice − WND Value1ifthematchoccurredon
theweekend
+
NGT Value1ifthematchoccurred after9:00PM
+
RAN Rainfall(inmm) −
fromtheraininmostBrazilianstadiums),(ii)theexpecteddrop inqualityofamatchwhenthereisrain,and(iii)thedifficulties associatedwithtransportationtothestadiumonarainyday.
Consideringtheliteraturereview,weunderstandthatthereare 3constructsthataffectthepayingpublic,presentedinFig.1, andastheconstructsaremultidimensional,wechoosemorethan oneproxyintheliteratureinordertobetterrepresenteachone ofthem.Thusweaimtotest3hypotheses:
H1. Theeconomicenvironmenthassignificantinfluenceover thepayingpublic.
H2. Ahigherqualityproductimpliesahigherpayingpublic.
H3. Greaterincentivesentailahigherpayingpublic.
Thesehypothesescanbeconfirmedifwefindtheexpected signsofthevariablecoefficientsandstatisticalsignificance,such assummarizedinTable1.Thetabledescribesthevariablesthat couldexplainthepayingpublicandtheexpectedeffectofeach ofthemontheconsumptionaccordingtoliteraturereview.
Dataconcerning theaverageticketprice,dayof theweek, time and location of the matches were obtained through consultations and examinations of overviews and bordereau
on the website of the Brazilian Soccer Confederation, as well as from tables providedby the Placar magazine’s web-site. Data for cumulative amounts of precipitation were obtainedfromtheNationalInstituteofMeteorology[INMET] (http://www.inmet.gov.br/portal/,retrievedin15,may,2015).
Theunitofanalysisisthesoccermatchandbecausethe cross-sectional dataset spans theyears2004–2013, wewill include variablesindicatingtheyearofthematchestocontrolthe pos-sibleeffectoftimeinticketconsumption.
Finally, one explanatory variable related to the television broadcastofthesoccermatchmustbefactoredintotheequation, asAllanandRoy(2008)andCox(2012)havewarnedthatsuch transmissionsnegativelyaffectthenumberoffanswhogotothe stadiumtowatchthegame.Baimbridge,Cameron,andDawnson (1996)estimateanapproximate15%reductioninattendanceof theEnglishPremierLeaguegamesthataretelevisedduringthe week.InBrazil,asnotedbyMadalozzoandVillar(2009),“in the studyperiod,the TV(openandbysubscription) transmit-tedgamesinallroundsforallofBrazil,respectingtheconcept of nottransmittingthematchtothecity whereitwasplayed. Thesegameswereavailableonlyonpay-per-view”.Inspecific cases, as inthe finalgames of the championship,there were situationswherecertaingamesweretransmittedtothecitiesin whichthegameswereheldifthestadiumselloutcapacitywas reached.
Statisticalmethodology
Thestatisticalapproachusedsofarbystudiesonthe Brazil-ian context isnot ideal, as it neglectsthe fact that there isa restrictionduetothecapacityofstadiumsandthatthe consump-tionhasapositiveskewness.Aimingtoaccountforimportant featuresof thedistributionofticketconsumptionandtomake betterforecasts,wedecidedtoworkwithmoregeneral regres-sionmodelsthantheusualmultiplelinearregressionmodelwith normaldistributionfortheerrors.WeusetheTOBITmodelthat takesintoaccountthattheobservedconsumptioniscensoredby thecapacityofthestadiumandthegeneralizedlinearregression model(GLM)withGammaandInverseGaussiandistributions fortheresponsevariableinordertoadjustthepositiveskewness ofticketconsumption.
Paying public
Economic environment
Per capita income population
Average ticket price
weekend game
night game rainfall Classification of the teams
# of points recently earned
# of goals recently scored importance of the match
classic match
big team
Product quality Incentive
Fig.1.Multidimensionalconstructsthataffectthepayingpublicandtheselectedproxiesforthem.
Table2
Descriptiveanalysisofnumericalvariables.
Variable n Average Standarddeviation Minimum Maximum Skewness
PUB 3659 13,939 11,033 147 87,895 1.89
LOT 3660 42,259 22,525 9500 95,000 0.78
PCI 3660 2262 584 364 3835 −0.17
POP 3639 3,608,558 3,771,287 15,051 11,253,503 1.10
CLH 3660 10.57 6.14 0 24 0.07
CLV 3660 10.55 6.13 0 24 0.07
PGH 3602 3.83 2.31 0 10 0.25
PGV 3602 4.16 2.34 0 12 0.15
GLH 3601 3.89 2.14 0 13 0.45
GLV 3597 4.10 2.20 0 14 0.44
PRC 3583 20.36 12.27 1.00 39,099 10.08
RAN 3660 3.43 9.47 0 110 4.37
Thus,inourcasetheTOBITmodelexpressestheobserved response,Y,intermsofanunderlyinglatentvariable:
Y∗=X+ε and Y =min(LOT,Y∗),
whereXistheinformationmatrix,isthevectorofparameters,
εistherandomerror,ministhefunctionminimumandLOTis themaximumcapacityofthestadium.Themodelsatisfiesthe sameassumptionsoftheusualNormalregressionmodel: linear-ityinparameters,randomsampling,zeroerrorconditionalmean, errorhomoskedasticity,noperfectcollinearityanderrorswith Normaldistribution.Theestimation isdoneusingthemethod ofmaximumlikelihood.However,duetothecensureobserved, theprocessinvolvesaweightingofuncensoredwithcensored variablesinordertoeliminatethebiasofestimatorsandadapt themethodforlatentmodels.Thenthelog-likelihoodforeach observationiswrittenas
li(,σ|Yi,Xi)=I(Yi=LOT) log
1−Φ
X i
σ
+I (Yi<LOT) log 1
σφ
Yi−
Xi
σ
, (1)
whereσ isthestandarddeviationforε,Iistheindicator func-tion,ΦandφarethecumulativestandardNormaldistribution functionandthestandardNormaldensityfunction,respectively. Thelog-likelihoodforarandomsampleofsizenisobtainedby
summing(1)acrossalli.Themaximizationofthelog-likelihood requiresnumericalmethodsandweusedtheEviewspackageto obtainthemaximumlikelihoodestimatesofandσ.
MoredetailsabouttheTOBIT,itsestimationandasymptotic properties of estimators canbe foundin Wooldridge (2002), Greene(2003)andGujarati(2004).
TheideaofGLMistoexpandtherangeof optionsfor the errordistributionusedinthelinearregressionmodel,aswellas providegreaterflexibilitytothefunctionalrelationshipbetween the average of the response variableandthe linear predictor. Therefore,theresponsevariablecanhaveanydistributionthat belongstotheexponentialfamily,likePoisson,Gamma,Inverse Normal,Binomial,amongothers,leadingtoabetterfitof the regressionmodels,sincetheyworkwithdistributionsthathave differentcharacteristicscomparedtothenormaldistribution.
Generalizedlinearmodelsarecharacterizedbythe distribu-tionoftheresponsevariableandtherelationoftheaverageof thisvariableandthelinearpredictors
E(Yi)=µi =g−1(Xi), (2)
whereXiisthelinearpredictor(orinformationmatrix)andgis
0 10 000 20 000 30 000 40 000 50 000 60 000
2013 2012 2011 2010 2009 2008 2007 2006 2005 2004
PUB LOT
Fig.2.Evolutionoftheannualaveragepayingpublic(PUB)andtheaverage capacityofstadiums(LOT)intheBrazilianchampionshipfrom2004to2013.
distributionsarebothpositiveskewedandweconsiderthelog link function, that is, the mean and variance depend on the explanatoryvariablesthrough
Gamma: E(Yi)=µi=exp (Xi) andVar(Yi)=µ2i. (3)
InverseGaussian: E(Yi)=µi
=exp (Xi) andVar(Yi)=µ3i. (4)
Weused the maximum likelihood method to estimatethe parametersofGLMwiththeQuadraticHillClimbing optimiza-tionalgorithm.Thelog-likelihoodforeachobservationis
li(,σ|Yi,Xi)=
(Yiθi−b(θi))
τ +c(Yi,τ), (5)
whereτ isthedispersion parameter,typicallyisknownandis usuallyrelatedtothevarianceofthedistribution,θisthe canon-icalparameter,ingeneral equaltoµ,andcisaconstantthat dependsonthedistributionofY.MoredetailsabouttheGLM, its estimation andasymptoticpropertiesof estimators canbe foundinMcCullaghandNelder(1989).
Results
Asmentionedearlier, the dependentvariable (PUB)isthe payingpublicofthegamesanalyzed.Thecross-sectionaldataset isobtainedfromsummariesandbordereauonthewebsiteofthe BrazilianSoccerConfederation(CBF)from2004to2013and theunitofanalysisisthesoccermatch.Intotal,therewere3660 matches,butonly115(3.1%)ofwhichhadmaximumcapacity andwereregardedascensoredintheTOBITmodel.
Fig.2showsthegraphoftheevolutionoftheannualaverage payingpublicandtheannualaveragecapacityofthestadiums intheBrazilianchampionshipfrom2004to2013.Theaverage occupancyrate was34%offullcapacityduringthisperiod,a lowpercentage,especiallywhencomparedwithEuropean stan-dards,whichinthe2013–2014PremierLeagueseasonhadan averageoccupancyrateof95%.Itisnoteworthythattherewas anincreaseof approximately18%inthecapacityofstadiums from2005to2006,whereascapacityremainedconstantfrom 2006to2009,andtherewasadecreaseof27%intheaverage
Table3
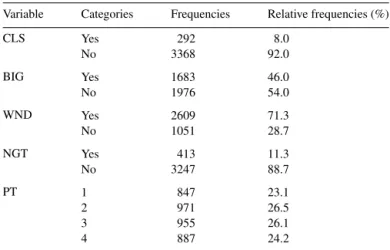
Descriptiveanalysisofcategoricalvariables.
Variable Categories Frequencies Relativefrequencies(%)
CLS Yes 292 8.0
No 3368 92.0
BIG Yes 1683 46.0
No 1976 54.0
WND Yes 2609 71.3
No 1051 28.7
NGT Yes 413 11.3
No 3247 88.7
PT 1 847 23.1
2 971 26.5
3 955 26.1
4 887 24.2
capacityofstadiumsfrom2009to2011.Intermsofaudience, therewasa62%increasefrom2004to2005anda40%increase from2006to2007;nomajorchangeswereindicatedfrom2007 to2011.Duetothisincreaseinaudiencesovertheassessedtime, weincludeyeardummyvariablesinthemodel.
Table2presentsthedescriptiveanalysisofnumerical vari-ablesusedinthestudyanddescribedinTable1.Notethatthe average attendanceinthe stadiumsduringthestudy periodis 13,939fanspergamewithahighdispersion.Theaverage max-imumcapacityofthe stadiumsintheBrazilianchampionship gamesduringthespecifiedperiodwas42,260,morethanthree timesthepayingpublic.Thereisgreatvariabilityinthesevalues withaminimumof9500andamaximumof95,000.Asalready pointedout,thepositiveskewnessofthepayingpublicguided thechoiceofthegeneralizedlinearmodel(GLM)withGamma andInverseGaussiandistributions.
In thedescriptive analysisofthe categoricalvariables pre-sented in Table3, we cannote that 8.0%of the games were consideredaclassic,46.0%ofthegamesincludethemajorteams fromSaoPauloorRiodeJaneiroasvisitors,71.3%ofthegames occurredonweekendsand11.3%ofthegamestookplaceafter 9:00PM.Also,weverifythatthereisnostrong multicollinear-ity amongexplanatory variablesas pointed by itscorrelation coefficients(Table4).
Themodelestimationused 3260observations,which3175 were complete,and 400 observations were left toassess the out-of-sampleforecasts.Wethencomparedtheaccuracyofthe forecastsofthein-sampleestimatedmodelusingthein-sample andout-of-sampleobservations.
Table4
Pearsoncorrelationfornumericalvariables.
PUB LOT PCI POP CLH CLV PGH PGV GLH GLV PRC RAN
PUB 1.000 0.382 −0.002 0.217 −0.241 −0.098 0.247 0.069 0.184 0.076 −0.347 −0.037 LOT 1.000 0.119 0.297 −0.111 −0.013 0.064 0.008 0.058 0.046 0.006 −0.022 PCI 1.000 0.086 −0.124 0.001 0.094 −0.016 0.151 0.073 −0.139 −0.019
POP 1.000 −0.176 0.007 0.080 −0.019 0.044 0.000 0.230 −0.045
CLH 1.000 −0.016 −0.348 0.056 −0.285 −0.019 −0.151 0.028
CLV 1.000 −0.034 −0.407 −0.029 −0.256 −0.043 0.003
PGH 1.000 0.148 0.541 0.028 0.079 −0.006
PGV 1.000 0.052 0.536 0.023 −0.013
GLH 1.000 0.120 0.028 0.002
GLV 1.000 −0.021 −0.014
PRC 1.000 −0.038
RAN 1.000
Table5
EstimatedregressionmodelsforticketconsumptionintheBrazilianchampionshipgames.
Variable LRM TOBIT Gamma-GLM
Coefficient Std.error Coefficient Std.error Coefficient Std.error
LogPCI −0.207** 0.064 −0.262** 0.062 −0.237** 0.054
LogPOP 0.166** 0.012 0.164** 0.011 0.151** 0.010
CLH −0.019** 0.002 −0.020** 0.002 −0.017** 0.002
CLV −0.012** 0.002 −0.013** 0.002 −0.009** 0.002
PGH 0.048** 0.006 0.049** 0.007 0.043** 0.006
PGV −0.005 0.006 −0.004 0.007 −0.008 0.006
GLH 0.025** 0.007 0.027** 0.007 0.022** 0.006
GLV 0.014* 0.007 0.013* 0.007 0.017* 0.006
PT2 0.148* 0.035 0.156* 0.038 0.135* 0.033
PT3 0.129* 0.035 0.133 0.038 0.116 0.033
PT4 0.221** 0.038 0.242** 0.038 0.272** 0.036
CLS 0.289** 0.043 0.301** 0.048 0.276** 0.040
BIG 0.226** 0.027 0.236** 0.028 0.200** 0.025
LogPRC −0.172** 0.032 −0.177** 0.030 −0.156** 0.025
WND 0.198** 0.032 0.201** 0.032 0.177** 0.029
NGT −0.013 0.051 −0.014 0.052 −0.001 0.047
RAN −0.002** 0.001 −0.002** 0.001 −0.002** 0.001
Constant 8.236** 0.496 8.725** 0.491 8.875** 0.428
Yeardummies Yes Yes Yes
nobservations 3175 3175 3175
Log-likelihood −3385 −3251 −32,593
Note.Asterisksdenotesignificance:
* Significantat5%.
** Significantat1%.Heteroskedasticity-consistentstandarderrors(std.error).
theInverseGaussianGLMandthevariables’signalsand statis-ticalsignificancewereverysimilar.TheInverseGaussianGLM resultsareavailablebyrequestingauthors.
AsinBraziliangamesthemanagersetstheticketpriceand itremainsfixeddespitetheattendance,weconsiderthatprice andquantityarenotsimultaneouslydetermined,sothereisno endogeneity.
Based on the results reported in Table 5, we see that all modelspresentedsimilarresultsforthesignalandstatistical rel-evanceofthevariablesaffectingticketconsumption.Variables representingtheeconomicenvironment,thatis,theresident pop-ulationandannualpercapitaincomeinthecity inwhichthe gameoccurredwerestatisticallysignificantinexplaining con-sumption.Withrespecttopopulation,theimpactwaspositive, asexpected.Theseresultsconfirmshypothesis1.Thenegative
impactwithrespecttoincomemeansthatticketsforthegames canbeconsideredinferiorgoods.Thisresultisinlinewiththose foundbyBird(1982)andtothat observedinMadalozzoand Villar(2009).Itcouldbearguedthatthisnegativeeffectis asso-ciatedwiththeexistenceofotherformsofentertainmentinthose citieswithahigherpercapitaincome,althoughthisassertion requiresfurtherempiricalstudy.
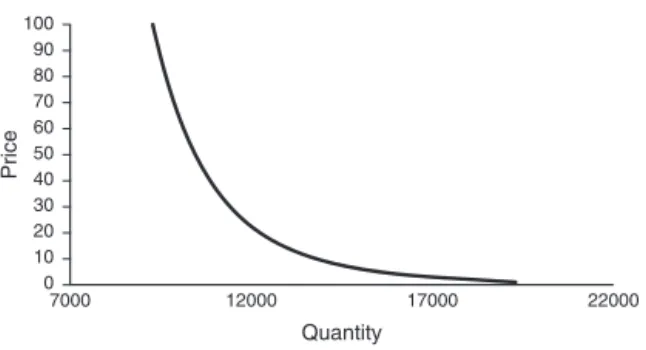
0 10 20 30 40 50 60 70 80 90 100
22000 17000
12000 7000
Price
Quantity
Fig.3.Estimateddemandcurve.
andgoalsscored,hasasignificantandpositiverelationshipwith thenumberofticketssoldforsuchagame,thusconfirmingthe hypothesis2thatthehighertheexpectedqualityofthematch, thegreaterthenumberoffansatthegame.
Asforthestageofthe tournament,itshouldbenotedthat thedemandincreasesasthechampionshipprogresses,thatis, thefinalphase(stage4)attractsmoreattendeesthantheearlier phasesandtheintermediatestages(stages2and3)attractmore attendeesthantheinitialphase(stage1).Asexpected,thefact thatagameisaclassic,thatis,arivalrybetweenmajorteams withastrongfanbase,hasapositiveeffectonthedemandfor tickets,asindicatedinWooten(2015).Moreover,ifthevisiting teamisoneofthemajorleagueteamsfromSaoPauloorRiode Janeiro,thedemandforticketsincreases.
Variablesrepresentingtheincentivesthatthepublichastogo tothestadium,suchastheaverageticketprice,thedayofthe gameandtheamountofrainfallalsoplayasignificantroleon demand,confirminghypothesis3.
Theaverageticketpricereflectedanegativesign,thus indi-catingthatthehighertheprice,thelowerthedemandandthe priceelasticityof−0.172issimilartothatfoundinBird(1982), Nilon(2010)andMadalozzoandVillar(2009),whatshowsthat thesoccerdemandisinelastic,accordingtoourpointofviewthat Braziliansoccermanagersdonotseekprofitmaximization.This elasticitymeansthat,everythingelseheldconstant,anincrease in pricesleads to adecrease inlower proportion in quantity demanded,sothatthereisanincreaseintotalrevenue.InFig.3, weplottheestimateddemandcurveforaclassicmatchbetween bignationalteamsinasunnyweekendafternoon,withallothers variablesheldconstantintheiraveragevalues.Asonecansee, ifthepriceissetatitsmediumvalue(R$20.36),therevenueis aboutR$248,452,whileapriceofR$50.00generatesarevenue ofR$522,783,morethan110%ofincrease.
Thelowestattendanceinthestadiumscoincidedwithgame daysthathadthemostrainfallintheareaofthegame,reflecting thepotentialproblemswithtransportationonrainydays.Finally, theyearsaresignificantvariablesincontrollingtheincreasein attendancebetween2004and2013,ascanbeseeninFig.2.
Asmentionedpreviouslyweleft400observationsoutof sam-pletoevaluatetheaccuracyofforecastingmodels.Theforecasts resultswereevaluatedaccordingtothreecriteriacommonlyused tocomparethem:therootmeansquareerror(RMSE),themean absoluteerror(MAE)andthemeanabsolutepercentageerror (MAPE).Thesemeasuresarecomputedasfollows:
Table6
RMSE,MAEandMAPEtocomparetheperformanceoftheforecastsin-sample andout-of-samplefortheregressionmodels.
Model LRM TOBIT Gamma-GLM
RMSE
Insample 9866 9548 9429
(3.22) (4.43) Outsample 42,349 38,026 30,064
(10.21) (29.01)
MAE
Insample 6707 6641 6382
(0.99) (4.85)
Outsample 10,938 9165 7238
(16.21) (33.83)
MAPE
Insample 73.34 72.56 61.65
(1.06) (15.94)
Outsample 59.32 58.03 50.62
(2.17) (14.66)
Notes.Theoutperformedresultforeachlineisshown inbold. Percentage improvementintheforecastofeachmodelrelativetotheLRM(benchmark) inparentheses:LRMrelative%=[1−(MODEL/LRM)]×100.Bestresultisin bold.
RMSE=
k
i=1(yi−yˆi)2
k , MAE=
k
i=1|yi−yˆi|
k
and MAPE=100
k
k
i=1
|yi−yˆi| |yi|
, (6)
whereyiandyˆiarethetruedemandandtheforecasteddemand for thegamei,respectively,andkisthenumberofforecasts. WeareparticularlyinterestedintheRMSEbecausethismeasure shouldreflecttheforecastedstandarddeviationsoftheestimated model.
Conclusion
The number of fans who attendthe stadiums in Brazilis not considered satisfactory, especially when compared with Europeanstandards.Thissituationconstitutesaprobleminthe developmentofBraziliansoccerastherevenueearnedbya soc-cerclubthroughticketsalescouldrepresentitsmajorfinancial resource.
Theaimsofthisstudyweretodemonstratehowticket con-sumption is affected by several variables so that corrective actionscanbeadoptedtoincreaseboththepresenceofthe pub-licinstadiumsandthesteadinessoftheattendance.Theapplied modelsincludedvariablesrelatedtotheeconomicenvironment, theproductqualityandtheincentivethatpeoplehavetoattenda sportingeventatastadium.Theeconometricapproachallowsus tomoreaccuratelyforecasttheticketconsumptionofBrazilian soccergames.TheGamma-GLMpresentedgreaterperformance thantheusualLRM,indicatingthatitispossibletoobtainbetter forecastsforconsumptionusingmoregeneralregression mod-els.InthecaseoftheTOBITmodel,whichtakesintoaccount thatthe observedconsumptioniscensoredbythe capacityof thestadium,theresultswereverysimilartotheLRMduetothe lowpercentageofcensure(3.1%).
Thethreeregressionmodelsusedforthepayingpublic pre-sentedsimilarresultsrelatedtostatisticalrelevanceandsignal variables.The analysis showsthat all variablesrelatedtothe economic environment,qualityof the productandincentives peopleare giventoattendamatchatastadiumareimportant toexplaintheconsumptionofsoccergamesinBrazilian stadi-ums,exceptthoseindicatingrecentvisitingteamperformance andwhetherthematchoccurredafter9:00pm.Thesearevery importantresultsforteammanagers.Sincetheyarenotableto controleconomicvariables,managersshouldfocusonquality andincentivevariables.Assuch,fromastrategicpointofview, threemainconclusionscanbedrawnfromtheresults.
First,teamshavetoincreaseincentivesiftheywanttokeepa loyalbaseoffansandmanagersshouldnotoverlooktheeffect ofaweakinfrastructureintheprocess,asthestudywasableto showthatrainfallnegativelyinfluencesthedemandfortickets, andthelackofcoveredstadiums(inwholeorinpart)istherule ratherthantheexceptioninBrazil.Fortunately,almostadozen ofnewarenaswithmuchbetterinfrastructurewerebuiltinBrazil tohost2014WorldCupandmanagersshouldtargetlongterm rentalagreementswiththe ownersofthesearenas,whichare inmanycasesstate-owned.Stadiumsshouldfeellikehomefor fans,helpingteamsacquireastrongeridentityandeventually leadingtomoreticketsales.FinancialdistressofBrazilianteams shouldnotbeconsideredadealbreakerasapublic-private part-nershipmaybeimplemented.Manystatesareprobablyeager togetridofmaintenancecosts(oratleastpartofit)associated withthealreadybuiltarenas.
Thesecondstrategyislinkedtotheoverallperformanceof boththechallengingteamandthe hometeam.Thesefactors, notablythelatter,haveatremendousinfluenceonthedemand forticketsandareofparamountimportancetoclubmanagers withrespecttotaking correctiveactionsoas tostimulatethe influxoffanstostadiums.Tomitigatethenegativeeffectonthe
demand(andthereforeontherevenueearned)ofateam’s(andits sub-par)performance,itisessentialthatasignificantportionof theticketsbesoldbeforethebeginningofthechampionshipsas issuccessfullydoneinEuropewhereclubsofferticketpackages withgreat advantagestothe fans. Teamsshould successfully appealtodedicatedfans.
Finally,ourresultssuggestthatBraziliansoccermanagersdo notseekprofitmaximization.Whetherthisisaconsequenceof pressurefromwellorganizedgroupslikefootballfirmsorany otherfactorisyettobedemonstratedbyotherstudies.Butthis approachtosetthepriceofticketsleadstoasignificantdecrease ontheexpectedrevenue,hamperingtheabilityofthesoccerclub toprovidefanswiththoseincentivesdiscussedabove.Assuch, Brazilian managers should change the basis of setting ticket prices.
Theanalysisisnotexhaustiveandthereisroomforfurther studiesthat,forexample,willdemonstratetheeffectofthehabit ofgoingtothestadiumor,additionally,willexplainthenegative influenceofthepercapitaincomeofthecityontheticket con-sumptionofsoccergames.Nevertheless,theresultsobtainedare robustandcanbeusedassubsidiesforthestrategicplanningof soccerassociationsinBrazil.
Conflictsofinterest
Theauthorsdeclarenoconflictsofinterest.
References
Allan,G.,&Roy,G.(2008).Doestelevisioncrowdoutspectators?New evi-dencefromtheScottishpremierleague.JournalofSportsEconomics,9(6), 592–605.http://dx.doi.org/10.1177/1527002508321458
Alonso,A.D.,&O’Shea,M.(2013).Thelinks betweenreasonsforgame attendanceofanewprofessionalsportsleagueandrevenuemanagement: Anexploratorystudy.InternationalJournalofRevenueManagement,7(1), 56–74.http://dx.doi.org/10.1504/IJRM.2013.053359
Baimbridge, M., Cameron, S., & Dawson, P. (1996). Satellite television and the demand for football: A whole new ball game? Scottish Journal of Political Economy, 43(3), 317–333.
http://dx.doi.org/10.1111/j.1467-9485.1996.tb00848.x
Bird,P.J.W.N.(1982).Thedemandforleaguefootball.AppliedEconomics,
14(6),637–649.http://dx.doi.org/10.1080/00036848200000038
Borland, J., & Lye, J. (1992). Attendance at Australian Rules foot-ball: A panel study. Applied Economics, 24(9), 1053–1058.
http://dx.doi.org/10.1080/00036849200000083
Calster, B. V., Smits, T., & Huffel, S. V. (2008). Thecurse of scoreless drawsinsoccer:Therelationshipwithateam’soffensive,defensive,and overall performance. Journal of Quantitative Analysisin Sports, 4(1.)
http://dx.doi.org/10.2202/1559-0410.1089
Cox,A.(2012).Livebroadcasting,gaterevenue,andfootballclubperformance: Someevidence.InternationalJournaloftheEconomicsofBusiness,19(1), 75–98.http://dx.doi.org/10.1080/13571516.2012.643668
Falter,J.-M.,&Pérignon,C.(2000).Demandforfootballandintramatch win-ningprobability:Anessayonthegloriousuncertaintyofsports.Applied Eco-nomics,32(13),1757–1765.http://dx.doi.org/10.1080/000368400421101
Falter, J.-M., Pérignon, C., & Vercruysse, O. (2008). Impact of overwhelming joy on consumer demand: The case of a soc-cer world-cup victory. Journal of Sports Economics, 9(1), 20–42.
http://dx.doi.org/10.1177/1527002506296548
league. Journal of Sports Economics, 3(1), 18–38. http://dx.doi.org/ 10.1177/152700250200300103
Giovannetti, B., Rocha, B. P., Sanches, F. M., & Silva, J. C. D. (2006). Medindo a fidelidade das torcidas brasileiras: Uma análise econômicanofutebol.RevistaBrasileiraDeEconomia,60(4),389–406.
http://dx.doi.org/10.1590/s0034-71402006000400004
Greene,W.H.(2003).Econometricanalysis(5thed.).NewJersey:Prentice Hall.
Gujarati,D.N.(2004).Basiceconometrics(4thed.).New York: McGraw-Hill/Irwin.
Jennett,N.(1984).Attendances,uncertaintyofotucomeandpolicyin Scot-tishleaguefootball.ScottishJournalofPoliticalEconomy,31(2),176–198.
http://dx.doi.org/10.1111/j.1467-9485.1984.tb00472.x
Knowles, G., Sherony, K., & Haupert, M. (1992). The demand for major league baseball: A test of the uncertainty of outcome hypothesis. American Economist, 36(2), 72–80. Retrieved from
http://www.jstor.org/stable/25603930
Kotler,P.(1975).Marketingfornon-profitorganizations.NewJersey:Prentice Hall.
Madalozzo, R., & Villar, R. (2009). Brazilian football: What brings fans to the game? Journal of Sports Economics, 10(6), 639–650.
http://dx.doi.org/10.1177/1527002509335572
McCullagh,P.,&Nelder,J.A.(1989).Generalizedlinearmodels(2nded.). London:ChapmanandHall.
Melo,L.M.(2007).Brazilianfootball:Technicalsuccessandeconomicfailure? InR.D.Miller,&L.Crolley(Eds.),FootballintheAmericas.Instituteof LatinAmericanStudies.
Mentzer,J.T.,&Moon,M.A.(2005).Salesforecastingmanagement:Ademand managementapproach(2nded.).ThousandOaks,CA:SAGEPublications.
Nilon, J. (2010). An inelastic phenomenon: Analyzing the elasticity of demand for soccer in England per geographical region (creative dis-traction 2010, 14th edition). pp. 41–57. Retrieved from University of Queensland Economics Society website: http://www.uqes.com. au/system/files/ESA%20Creative%20Distraction%202010%20Edition% 20141.pdf
Park, K. W., Lee, S., & Miller, P. (2012). Ticket pricing per team: The case of major league baseball (MLB). In Allied academies internationalconference:Proceedingsoftheacademyofeconomicsand eco-nomiceducation(p.15).Retrievedfromhttp://www.alliedacademies.org/ pdfs/AEEEProceedings15%282%29Fall2012.pdf
Santos, R. B., Bazanini, R., & Ferreira, A. A. (2014). Entrepreneur-ship in the society of spectacle: Soccer management in a global-ized world. Global Journal of Management and Business Research: A Administration and Management, 14(9), 57–68. Retrieved from
http://journalofbusiness.org/index.php/GJMBR/article/view/1477/1384
Simmons, R. (1996). The demand for English league football: A club-level analysis. Applied Economics, 28(2), 139–155.
http://dx.doi.org/10.1080/000368496328777
Sloane,P.(1997).Editorial:Theeconomicsofsport:Anoverview.Economic Affairs,17(3),2–6.http://dx.doi.org/10.1111/1468-0270.00034
Smith,E.E.,&Groetzinger,J.D.(2010).Dofansmatter?Theeffectof atten-danceontheoutcomesofmajorleaguebaseballgames.Journalof Quanti-tativeAnalysisinSports,6(1)http://dx.doi.org/10.2202/1559-0410.1192
Souza,F.A.P.(2004).UmEstudoSobreADemandaPorJogosDeFutebolNos EstádiosBrasileiros(Master’sDegreedissertation).SãoPaulo,SP,Brazil: FaculdadedeEconomia,Administrac¸ãoeContabilidade–Universidadede SãoPaulo.
Szymanski, S. (2001). Income inequality, competitive balance and the attractiveness of team sports: Some evidence and a natural exper-iment from English soccer. Economic Journal, 111(469), 69–84.
http://dx.doi.org/10.1111/1468-0297.00599
Tobin,J.(1958).Estimationofrelationshipsforlimiteddependentvariables.
Econometrica,26(1),24–36.http://dx.doi.org/10.2307/1907382
Wooldridge,J.M.(2002).Econometricanalysisofcrosssectionandpaneldata
(2nded.).Cambridge:TheMITPress.
Wooten, J. J. (2015, March). Rivalries in US professional soc-cer. http://dx.doi.org/10.2139/ssrn.2394631. Retrieved from