DOI: 10.1590/1808-057x201603000
Reducing information asymmetry from the management control
perspective: discussion of practices in transparent companies*
Márcia Maria dos Santos Bortolocci Espejo
Universidade Federal do Mato Grosso do Sul, Escola de Administração e Negócios, Campo Grande, MS, Brazil
Franciele do Prado Daciê
Universidade Paranaense, Departamento de Ciências Contábeis, Umuarama, PR, Brazil
Received on 01.03.2016 – Desk acceptance on 01.21.2016 – 3rd version approved on 08.01.2016
ABSTRACT
he capital market is supplied with information daily, but when this is made available in an incomprehensible way, it becomes a potential barrier to investment. In order to overcome this shortcoming, constantly improved regulations intensify the need for more and better information. In the managerial context, empirical studies indicate that there is a low level of use of modern Management Accounting tools; however, on a theoretical level, Accounting heory prescribes that Accounting must efectively meet the needs of its external and internal users. It is thus believed that not only inancial but also management information would be apparent in its reports. his investigation aims to verify whether there are diferences with regards to the level of reporting of management control practices in the inancial statements of companies nominated for the Transparency Award, organized by the National Association of Finance, Administration, and Accounting Executives (ANEFAC), the Accounting, Actuarial, and Financial Research Institute (FIPECAFI) and Serasa Experian, compared with the other companies listed on the São Paulo Stock, Commodities, and Futures Exchange (BM&FBOVESPA). hese elements were deined based on a discourse analysis of Management Reports (MRs) and the evidence was tested using Multiple Correspondence Analysis. he sample consists of 19 MRs from publicly-traded companies that were nominated for the Transparency Trophy and 129 MRs from companies listed on the BM&FBOVESPA. he indings show that the companies nominated for the award have some special informational categories in the discourses of their MRs and that these elements are not enough to show diferences in the level of transparency of management control practices.
Keywords: management control practices, ANEFAC Transparency Award, informational transparency, accounting information, disclosure.
1 INTRODUCTION
he prominent paper Relevance Lost, from Johnson and Kaplan, published in 1987, describes the status of Accounting as essentially concerning the elaboration of inancial statements for external users, with inadequate management control systems and little interaction between reality and theory. However, the discussion proposed by the authors and linked to studies such as those from Kaplan and Norton (1992) became representative for Management Accounting, until then labeled as being “without relevance”, to materialize for discussion of the management control practices applied in organizations, especially from a strategic perspective. Since then, research in the area which narrows the gap between academic knowledge and reality has come to gain importance.
Recent studies, such as those from Bhimani, Gosselin, Ncube, and Okano (2007), Soutes and Zen (2005), and Sulaiman, Ahmad, and Alwi (2004), suggest that management tools can be applied in various areas, such as the inancial market, life-cycle analysis, investment, client and production sectors, and in interdepartmental communication. However, their findings show that, in practice, the adoption of management practices that are considered as modern is proceeding at a slow pace.
hus, despite the early situation highlighted by the authors, it is perceived that Accounting is, in general, potentially useful with regards to organizational language. This said, accounting reports act as an information disseminating element, and in order to accomplish this, they present informational discourses in which inancial and strategic data can be made available to interested parties (Graham, 2013). From this perspective, it is understood that organizational reports are not limited to a list of mechanized and impartial data, but rather, convey a useful message for decision making. Moreover, this proposition leads to the idea that inancial and managerial aspects should be made available in a harmonious way in accounting statements.
herefore, it is acknowledged that in essence accounting provides support in meeting the needs of information users, with theory and practice being consolidated in inancial and management Accounting based on meeting external and internal user demand (Hendriksen & Van Breda, 2014). Consequently, it is understood that managing the reporting of information can potentially exert an inluence over inancial performance and value creation for companies (Solomon & Solomon, 2006), primarily when it is related to the transparency of the management practices adopted in an organization. hese aspects are related with the pillars of communicating relevant information in order to add value and establish stewardship, as laid out in the Global
Moreover, it makes sense to consider that this scope of information made available by company reports can attract more investments in the inancial market, given that Accounting acts as a facilitating instrument for communication between internal and external actors (Solomon & Solomon, 2006). hus, it is understood that the current economic and social environment incentivizes efficient management to be tied to better control of information and that reporting of managerial aspects becomes relevant for the disclosure of decisions that afect a company’s future, that is, its outlook, forecasts, diferences in relation to competitors, and corporate strategies (Browmich, 1988).
However, presentation of information of a managerial nature is also noted as being a critical point for companies, since it involves outlooks that can be strategically captured by competitors (Solomon & Solomon, 2006). It is believed that the alternative to this condition is the adoption of a predominantly inancial proile for accounting statements, which converges with the current view of disclosure. It is therefore understood that the process of communicating with investors focuses to a greater degree on reporting indicators involving investment, share liquidity, portfolio expansion, market image consolidation, and in a supericial way, on the practices applied in achieving these results (Hendriksen & Van Breda, 2014; Solomon & Solomon, 2006).
Trophy present “better information”. It is also assumed that the term used (better information) comprises inancial and managerial aspects, proposing that awarded companies would meet these requirements efectively.
In light of the reasons for this proposition, it should be noted that the award is considered as a traditional stamp guaranteeing corporate transparency in the market (ANEFAC, 2014), which suggests that the companies chosen present relevant information in their statements. Backed by the discussion, this study aims to answer the following question: is there evidence of a greater level of reporting of management control practices in the accounting statements of companies nominated for the ANEFAC/ Accounting, Actuarial, and Financial Research Institute (FIPECAFI)/Serasa Experian Transparency Award, which diferentiates them in relation to other companies?
his study assumes the view that there is, in some way, a greater level of reporting of management control practices in
the accounting statements of companies nominated for the ANEFAC/FIPECAFI/Serasa Experian Transparency Award in relation to the other companies listed on the São Paulo Stock, Commodities, and Futures Exchange (BM&FBOVESPA). It is therefore suggested that transparent reporting stimulates, assists, and matures the view of investors, and that based on presentation of information that meets managerial and inancial proiles, both users’ shortcomings can be overcome. For this, we explored whether this proposition is met, by using the list of companies considered as being transparent.
As well as the introduction, this paper is organized into four other sections. he irst presents the theoretical framework for the study, laying out the role of reporting accounting information to the market and the development of Accounting and managerial control. he second describes the methodological procedures adopted, the third describes and discusses the main indings, and the last one ofers the inal remarks.
2 THEORETICAL FRAMEWORK
2.1 he Role of Reporting Information in the Market
he introduction of regulations regarding reporting accounting information is based on promoting more and better information for the market. Seminal studies claim that this incentive involves a positive aspect, especially for evaluating companies, considering that public appreciation adds value to them (Berle & Means, 1932; Ripley, 1927). However, in recent decades it has been argued from a cynical viewpoint, observing that reporting certain “valuable” information could beneit market competitors (Hayes & Lundholm, 1996; Leuz & Wysocki, 2006; Wagenhofer, 1990). Although there can be some “vulnerability” involved in publishing certain information, corporate reporting has the potential to alter a company’s value, afecting strategically taken actions, and consequently inluencing the distribution of future cash lows (Leuz & Wysocki, 2006). Investigations also accept that sharing more and better information reduces market ineiciencies and adverse selection, allowing for apt global policies (Allcott & Greenstone, 2012).
he idea of incentives for reporting information aligned with the market is old, from even before the corporate inancial scandals (Grossman, 1981; Grossman & Hart, 1980). he discussion is based on the tendency to present optimistic reports, since via these stakeholders distinguish between good and bad investments, and consequently evaluate them using the results and arguments presented. However, theoretically the efect of the frequency of report presentation on information asymmetry is inconclusive. Some studies argue that more reporting causes a reduction in information asymmetry, providing investors with equal
access to information (Diamond, 1985; Lundholm, 1991). Others point to the hypothesis that the fact that explains asymmetry is exogenous, considering that large investors have inancial resources to acquire and anticipate future information (Verrecchia, 2001).
hus, it is understood that the reporting mechanism is treated as an interactive process, since sharing information generates a continuous dialogue between companies and users, helping interested parties’ understanding and in company practices (Madsen, 2009). hus, this discussion assumes that reporting practices linked with organizations’ management is implicit in the communication process that exists between companies and users and that the more extensive and transparent it is, the more eicient the market becomes. Reported managerial control its within this context.
2.2 he Development of Management Accounting
and its Application Tools
he evolution of Accounting originates from the historical development of society and conlicts between meeting the demands, interests, and aims of owners and managers. As there was a need for information involving diferent focuses, such as tactical and operational management decisions, the general idea of Accounting becomes diferent between Accounting Sciences and its sub-area, Management Accounting (Anderson, Needles & Caldwell, 1989).
Cost Accounting. Its structure came to be discussed in US studies in the 1980s, showing the initial information that the systems used made available to companies, limiting them to staying competitive and evolving technologically (Ott, 2004). With regards to its focus of activity, Anthony (1970) highlights that Management Accounting concerns operations management and that the main diferent from Financial Accounting is the fact that it takes responsibility for the nature of the content made available in reports, that is, for the internal activities that go hand in hand with determining the monetary terms presented in Financial Accounting. Based on this aim, Management Accounting implements managerial control and comes to act as a tool for potentially supporting the provision of information for decision making and achieving organizational aims (Otley, 2003).
he International Federation of Accountants notes that managerial control supports processes, methodologies, and techniques via management, so that limited resources are applied eiciently, leading organizations to achieve their objectives (International Federation of Accountants [IFAC], 2009). he improvements that have taken place over time in these management tools have been of great interest to researchers (Falconer, 2002; Jarvenpaa, 2007, Scapens, 2006). As well as becoming a “lapidated” element over the course of its evolutionary stages, as described in International Accounting Management Practice 1 (IMAP 1), its evolution has also caused a change in focus and objective, as well as its positioning in relation to planning and decision making in companies (Jarvenpaa, 2007; Scapens, 2006).
hus, the development of the area has experienced periods in which its focus was the calculation of product costs, in others, systems of production and internal administration, then cost control in order to reduce residual resources applied in their processes, and inally (and closer to reality), the use of technologies that allow for eicient management and adding client and shareholder value (IFAC, 2009). Domestically, the study from Soutes (2006) was pioneering in proposing the classiication of the accounting artifacts proposed in IMAP 1 into three categories (focus, performance evaluation, and management philosophies and models) and four evolutionary stages. he author’s proposal presents the evolution of managerial control tools as a process for overcoming the shortcomings that arise throughout the stages and not only as exclusive stages.
From a complementary perspective, studies such as
those from Chenhall and Langield-Smith (1998), Ferreira and Otley (2006), Soutes (2006), and Sulaiman et al. (2004) classify managerial control tools as traditional and contemporary. he latter are essentially diferent in terms of how users are addressed, since the traditional tools are regularly used in the irst and second evolutionary stages. In contrast, contemporary techniques provide a broader focus on evaluating production process performance, and are aimed towards strategic results (Chenhall & Langield-Smith, 1998).
Operationally, studies such as those from Abbade, Zanini, and Souza (2012), Frezatti, Carter, and Barroso (2014), Kotler (1998), and Sullivan, Warren, and Westbrook (1998), have described some of the tools that are frequently used in organizations. Among these are inancial and stock controls, billing and sales reports, controls which help to deine advantages in relation to competitors, and market factors. By using them, these users are able to evaluate organizational performance and validate company management.
However, unlike the conditions established in Financial Accounting reporting, the principles of Management Accounting do not obey the authority of a regulatory body (Anthony & Govindarajan, 2006). his factor makes it more complex to identify, in an organizational context, which information is concerned with this area, primarily due to elements being involved that are essentially concerned with meeting the informational needs of insiders (Guerreiro, Pereira & Frezatti, 2008).
3 METHODOLOGICAL DESIGN
3.1 ANEFAC Award: he Best Reported Accounting
Information
Every year companies are nominated for the ANEFAC Transparency Trophy award, the most important accounting reward event in the country, which recognizes those companies that publish the most transparent accounting statements in Brazil, contemplating 24 publicly-traded and/ or privately-held companies from the most diverse sectors for each award. Out of these, one is classiied as the best (ANEFAC, 2014).
he process for selecting the organizations involves irms based throughout the whole country and classiied among the biggest and best companies. Regarding levels of transparency, the classiication process is based on seven criteria that are published publicly and established by FIPECAFI (ANEFAC, 2014). he institutional website lists the following aspects that are evaluated in reported inancial statements: (1) quality and level of the information contained in the statements and explanatory notes; (2) transparency of the information disclosed; (3) quality of the Management Report (MR) and its consistency with the information reported; (4) adherence to accounting principles; (5) opinion given by the independent auditors (nature and reservations); (6) presentation of the report with regards to layout, readability, conciseness, clarity; and (7) reporting of relevant aspects that are not legally required but are important for the business (ANEFAC, 2016).
However, it should be considered that although the categories applied in the analysis are named, some of them are not so clear, as occurs with criteria 1, 2, and 6. Terms used such as “quality and level of information”, “transparency”, or even “conciseness, clarity” do not exactly specify their meaning, that is, as they are operationalized during the evaluation process, they create uncertainty about the exact aspects that are relevant in reporting information.
On the other hand, it is believed that, for example, the level of transparency of information involves a “panoramic” presentation of the company, as well as its inancial results, its organizational characteristics (mission, vision, values), its future plans, and the good practices adopted in the corporate environment. Considering the recognition that nomination for the award provides to companies and the visibility to investors, aspects relating to managerial control could be contemplated in their analysis, revealing transparency with respect to management.
It is thus hoped that this reporting aspect occurs voluntarily, since it is not clearly speciied in the award criteria. It becomes quite attractive for investors to know the good practices adopted in the management process,
since it may indicate that a company is committed to future prospects and to actions that improve inancial and operational performance over the course of its activities.
Studies such as those from Guerreiro, Cornachione Jr., and Soutes (2011), Pinheiro and Boscov (2015), and Soutes (2006) apply, as an analysis parameter, companies awarded with the ANEFAC Trophy. his study adopts a proposal similar to that of Guerreiro et al. (2011), in which it was veriied, using a survey of 90 companies, whether those that stand out for the quality of their user information also stand out for better use of modern Management Accounting tools. However, this study adds value to the aforementioned one by deining, as the focus of analysis, the reporting of information to external users and not only its intra-organizational use. Also, the choice of companies nominated for the award considers the seriousness involved in the event’s evaluation process, since studies regularly use these “model” companies for investigations on a national level.
3.2 Classification of the Study, Sample, and
Procedures for the Data Analysis
his investigation has empirical methodological aspects, considering the systematic processes that are applied to the reality being studied (Cooper & Schindler, 2011). he procedures were segmented into three stages: (i) the categorizations (reporting parameters) of managerial practices were deined using a discourse analysis of the MRs from the companies nominated for the award; (ii) based on the categories established, a discourse analysis of the MRs from the other companies listed on the BM&FBOVESPA was carried out; and (iii) ater determining the existence (or not) of reporting of practices, the Multiple Correspondence Analysis (MCA) technique was applied in order to compare whether there is some proof of the initially adopted assumption. Microsot Excel sotware spreadsheets were used in the irst two stages to elaborate the reported practice checklists. he last stage applied the Statistical Package for the Social Sciences – 20 sotware.
It should be highlighted that the subject of the analysis in this study was the MRs referring to the close of year 2013, considering these to be elements that are potentially aligned with the proposed objective. he year chosen was based on the understanding that the awards taking place in 2014 refer to the inancial statements from the previous year. he reporting of managerial control tools is shown via an analysis of the discourses in the aforementioned accounting statements.
procedures, as a parameter for assisting in the RM analysis, the management control tools mentioned in the study from Soutes (2006) were used, since no previous studies were found that created a classiication model for the tools used in Management Accounting. Moreover, the study carried out domestically adjusts to the subject of study, that is, MRs from companies that are listed on the Brazilian stock exchange. hus, deinition of the parameters for reporting management practices was initially carried out based on discourse analysis of the MRs from the companies nominated for the award. In this procedure, the classiication proposed in the seminal study (Soutes, 2006) was compared to the tools that are publically laid out in the reports, adapting when necessary to the study proposal.
It should be highlighted that, in order to compose the list for analysis of companies nominated for the award, companies listed in the Privately Held category were excluded from the population, considering the aim of equating with the subsequently selected sample (BM&FBOVESPA companies). Moreover, one company was excluded from the analyses given that its reports were not available on the website in the collection period (December 2014). hus, the analyzed MRs are represented by those referring to the close of 2013 for 19 publicly-traded companies nominated for the Transparency Trophy.
he initial technique allowed passages to be detected in which the focuses, performance evaluation measures, and philosophies reported by the companies can be understood and classiied. Examples from the reports include expressions such as: “It is important to mention that all of the Company
development programs; [...] are proceeding as planned”; “he distributer strongly undertakes to combat losses”, or even, “he company has continuous interest in improving [...]”. It is understood that the exhibition of some management tools adopted in the companies is intrinsic to the analysis of these phrases, such as information on managerial control and planning (2nd stage), the focus on reducing losses (3rd
stage), and the Kaizen Philosophy (3rd stage).
he second stage was carried out based on a comparison between the parameters for reporting management practices (categorized in the spreadsheets in the irst stage) and the management practices reported in the MRs from the other companies listed on the BM&FBOVESPA. In this stage the company MRs were read (discourse analysis) and it was veriied in which aspects they met the established criteria.
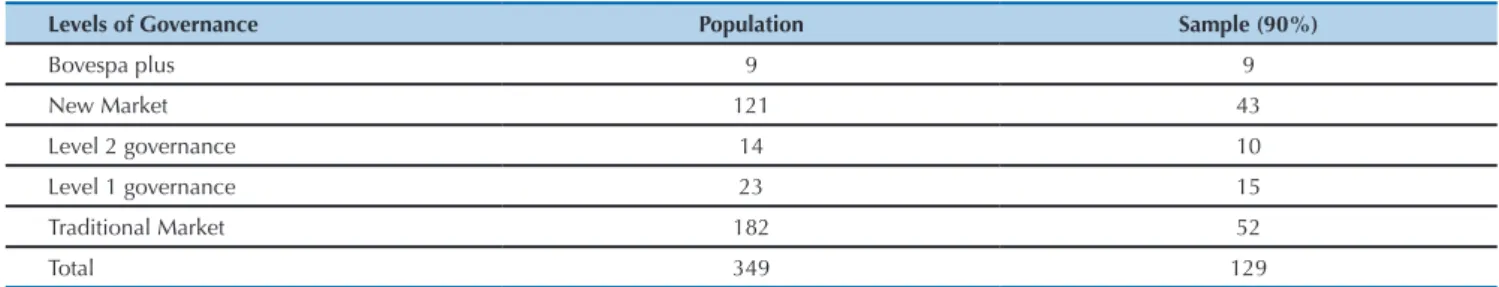
Selection of the sample of companies listed on the BM&FBOVESPA and not nominated for the Transparency Trophy took place via simple random sampling, estimating 90% conidence for each corporate governance classiication level. For this stage, irst companies from the inancial sector were excluded from the population, and then a random formula was used in Microsot Excel for each level of corporate governance. At the end of this process, the existence of companies that were simultaneously selected in the sampling process and were among those nominated for the award was veriied. As a result, ive companies were eliminated, being considered only as part of the population of companies nominated for the award. In the end, the sample totaled 129 companies, as in the distribution presented in Table 1.
Table 1 .Random sample of companies belonging to the BM&FBOVESPA
Levels of Governance Population Sample (90%)
Bovespa plus 9 9
New Market 121 43
Level 2 governance 14 10
Level 1 governance 23 15
Traditional Market 182 52
Total 349 129
Similarly to the process adopted in the irst stage, the evaluation of reported management practices was carried out using interpretative analysis of the discourse in the MRs from the 129 companies. At this point, the categorical variables relating to level of corporate governance, nomination for the Award, and management control practices presented were mapped out. To identify corporate governance the following codes were attributed: 1: Bovespa Plus, 2: New Market, 3: Level 2 governance, 4: Level 2 governance, and 5: Traditional Bovespa. With regards to identifying the companies nominated for the award, the dummy 1 was used for those that compose the group, and 0 for the rest. he same procedure was adopted for the management control practices variable, that is, the indicator 1 was used when the practice was perceived in an MR and 0 was used when it was not identiied.
Ater carrying out the tabulation of the data, MCA was used as a method of quantitative analysis of the data. MCA is a hybrid method involving multidimensional scaling that uses non-metric data and creates perceptual maps that position connections between subjects and attributes/variables speciied by the researcher (Greenacre, 2007). his technique
allows the relationships that exist between the subjects and their characteristics to be explored, graphically representing, in a simpliied way, the construction of typologies for the observations (Crivisqui, 1995). Carvalho (2004) reports that the MCA approach identiies factors that structure the most complex phenomena, and it is recommended for the investigation of categorical data in the area of Social Sciences. Although it is considered to be a descriptive technique of an exploratory character, MCA is derived from multivariate analyses from the French school in which one alternative to non-inferential statistical tests is conirming conclusions based on a graphic distribution of results (Benzécri, 1992). Application of MCA created a two dimensional graph, since the curve formed by the inertias in the scree plot was considerably higher in the irst factor and intermediary in the second. From this perspective, level of governance in the companies analyzed (Bovespa Plus, New Market, Level 2, Level 1, and Traditional Bovespa) was assumed as the object of veriication, and the following as variables: (i) the reporting of management control practices published in the MRs (1 = yes; 0 = no) and (ii) the occurrence of nomination for the Transparency Award (1 = nominated; 0 = not nominated).
4 PRESENTATION AND ANALYSIS OF THE RESULTS
4.1. Presentation of the Indicators
The indicators of management control practices reported in the companies’ accounting statements were deined based on discourse analysis of the MRs from the companies nominated for the award. hus, by reading
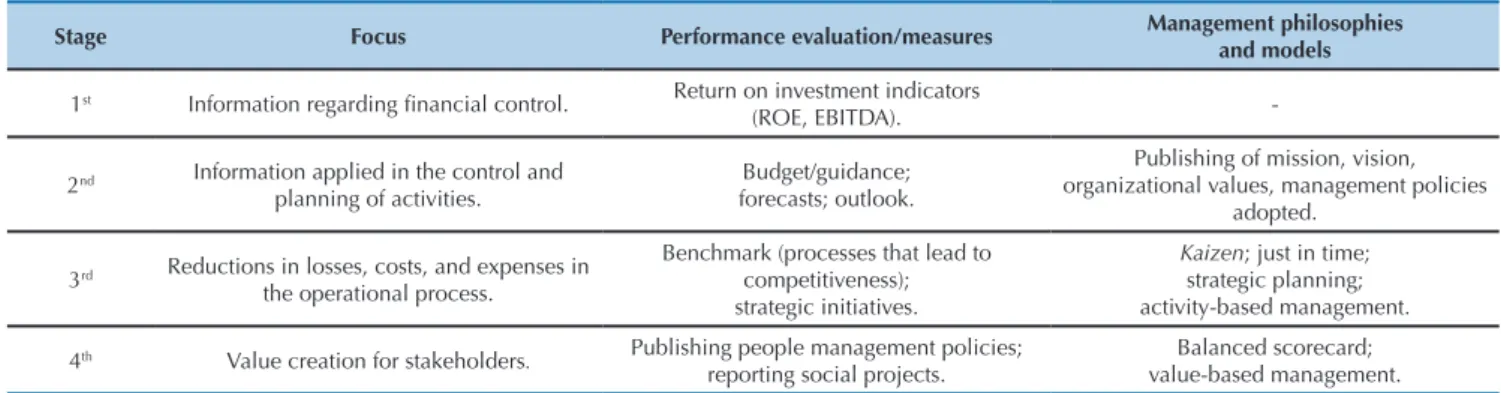
and understanding the discourses, the adaptation of the management control presented by Soutes (2006) was developed, indicating reported practices that are directly or indirectly related to company management. Table 2 presents the operationalization of the established indicators.
Table 2 .Managerial indicators analyzed in the Management Reports
Stage Focus Performance evaluation/measures Management philosophies and models
1st Information regarding inancial control. Return on investment indicators
(ROE, EBITDA).
-2nd Information applied in the control and
planning of activities.
Budget/guidance; forecasts; outlook.
Publishing of mission, vision, organizational values, management policies
adopted.
3rd Reductions in losses, costs, and expenses in
the operational process.
Benchmark (processes that lead to competitiveness); strategic initiatives.
Kaizen; just in time; strategic planning; activity-based management.
4th Value creation for stakeholders. Publishing people management policies;
reporting social projects.
Balanced scorecard; value-based management.
Note. EBITDA = earnings before interest, tax, depreciation, and amortization; ROE = return on net equity.
It should be highlighted that from the discourse analysis it was not possible to detect costing methods employed by the companies; the indicators described measured the frequency of disclosure in the managerial dimension of the elements: focus, performance measures, management philosophies and models.
4.2 Descriptive Analysis of the Companies Nominated
for the Transparency Award
he analyses carried out regarding management control
were preceded by descriptive mapping of the sample. he awarded companies it, respectively, into the following levels of corporate governance: 37% into the New Market, 16% into Level 2 governance, and 21% were not categorized into any levels of governance. It was observed that the MR structure is regularly presented in four main sections: (i) economic context for the sector, (ii) company market share, (iii) economic-inancial analysis of organizational performance, and (iv) share performance in the capital market. A description of the sections is laid out in Table 3.
It was found that some MRs dedicate part of their structure to describing their commitment to social responsibility and expectations for the activities. From this standpoint, corporate policies and programs, social projects, and growth prospects and forecasts are also reported, though in little detail.
he analysis carried out indicated an important focus on describing inancial performance indicators, presenting action plans and strategic initiatives, and creating value for
stakeholders. On the other hand, reporting of elements such as mission, vision and organizational values was limited, although many companies declare they have a Management Council or Committee – a body for structuring ethical guidelines, policies, and internal company procedures, which assumes the adoption of regulations and good internal practices in these companies. Among the list nominated for the award, only Embraer S.A. explicitly reports the respective elements adopted in its Action and Strategic Plans (Table 4). Table 3 .Description of the general structure of the companies’ Management Reports
Sections Description
Economic context of the sector Presentation of the country’s and/or region’s economic-inancial situation.
Market service Discourses regarding growth in market service and regional share.
Economic-inancial performance analysis
Reporting of the main balance sheet items. These include the result accounts, such as revenues (per activity or product sold), expenses, inancial results, and investments. They
also include the section on inancial indicators, such as EBITDA and ROE. Capital structure/Shares on the capital market Valuation or devaluation of shares, preference and ordinary shares, dividend payments.
Note. EBITDA = earnings before interest, tax, depreciation, and amortization; ROE = return on net equity.
Source: Elaborated by the authors.
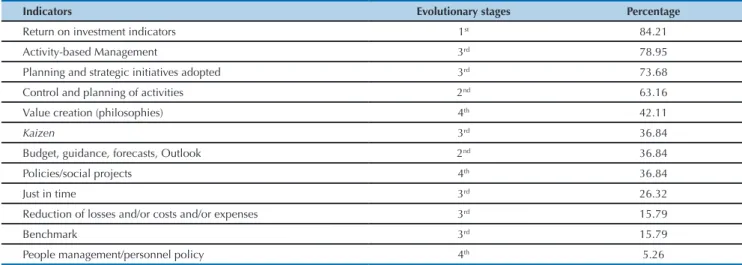
Table 4 .Indicators veriied in the analysis of the Management Reports from the companies nominated for the ANEFAC Trophy
Indicators Evolutionary stages Percentage
Return on investment indicators 1st 84.21
Activity-based Management 3rd 78.95
Planning and strategic initiatives adopted 3rd 73.68
Control and planning of activities 2nd 63.16
Value creation (philosophies) 4th 42.11
Kaizen 3rd 36.84
Budget, guidance, forecasts, Outlook 2nd 36.84
Policies/social projects 4th 36.84
Just in time 3rd 26.32
Reduction of losses and/or costs and/or expenses 3rd 15.79
Benchmark 3rd 15.79
People management/personnel policy 4th 5.26
It is worth noting that the production and distribution of electrical power sector was veriied as being the most representative out of those nominated for the award, with discussion of the operational dimension of the client portfolio being common in their MR structure. he presentations from this segment sometimes ignore reporting on the principles that guide company management, as well as their organizational structure. Regarding these considerations, it is believed that the MR structure from this segment could be explored in future studies.
4.3 Descriptive Analysis of the Companies Not
Nominated for the Award
he descriptive analysis of the proile of the MRs from the 129 companies selected from the BM&FBOVESPA indicated
four main aspects that support the accounting information context: (i) the main activities and products sold, (ii) the variations in revenues, expenses, costs, inancial results, (iii) the levels of debt, and (iv) the market value of shares. However, it is perceived that the level of detail of these indicators difers between the levels of governance.
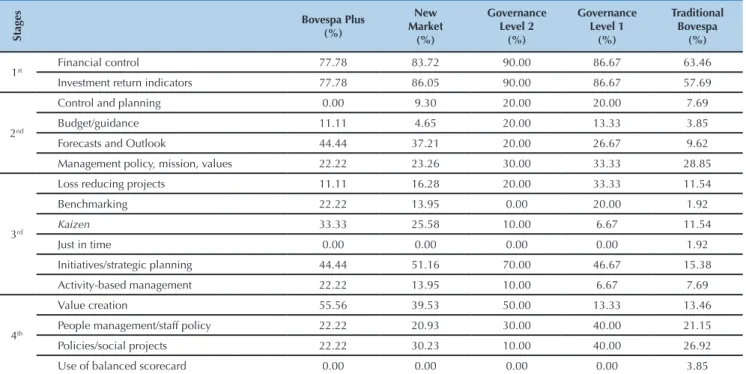
he Bovespa Plus and New Market levels briely report on their management strategies, social policies, and staf beneits, while the others tend to describe these elements more broadly. The discourses related to management philosophies or models are oten explained with the initial comments from company management, introducing the context to be described in the following pages. In light of the above, a detailed analysis was carried out based on each level of corporate governance. he quantiications are presented in Table 5.
Table 5 .Calculation of the management indicators analyzed in the Management Reports
Stages
Bovespa Plus (%)
New Market
(%)
Governance Level 2
(%)
Governance Level 1
(%)
Traditional Bovespa
(%)
1st Financial control 77.78 83.72 90.00 86.67 63.46
Investment return indicators 77.78 86.05 90.00 86.67 57.69
2nd
Control and planning 0.00 9.30 20.00 20.00 7.69
Budget/guidance 11.11 4.65 20.00 13.33 3.85
Forecasts and Outlook 44.44 37.21 20.00 26.67 9.62
Management policy, mission, values 22.22 23.26 30.00 33.33 28.85
3rd
Loss reducing projects 11.11 16.28 20.00 33.33 11.54
Benchmarking 22.22 13.95 0.00 20.00 1.92
Kaizen 33.33 25.58 10.00 6.67 11.54
Just in time 0.00 0.00 0.00 0.00 1.92
Initiatives/strategic planning 44.44 51.16 70.00 46.67 15.38
Activity-based management 22.22 13.95 10.00 6.67 7.69
4th
Value creation 55.56 39.53 50.00 13.33 13.46
People management/staff policy 22.22 20.93 30.00 40.00 21.15
Policies/social projects 22.22 30.23 10.00 40.00 26.92
Use of balanced scorecard 0.00 0.00 0.00 0.00 3.85
Source: Elaborated by the authors.
The analysis of the reports from the Bovespa Plus companies indicated a synthetic disposition in the reporting of management activities. he focus adopted in the 1st
stage of Management Accounting is highly present in the analyzed reports. Models focused on creating value reached a signiicant frequency – 55% of the analyses. Moreover, forecasts and outlook for the market and some strategic organizational initiatives are presented in around 45% of the reports. Focus on reducing losses and applying benchmarking represents 11% and 22% of the analyses, respectively. Finally, the performance measures included in the 4th evolutionary
stage were the least reported ones – 22% of the statements.
he analysis of the MRs from the New Market segment companies indicated a peculiarly diferent element of those presented. Although presenting behavior regarding the reporting of aspects belonging to the 1st stage, part of their
MRs presents well described people management practices, beneits, assistance plan, and position and salary policies. As in the calculations displayed in Table 5, the strategic initiative,
Kaizen management models, and benchmark evaluation
categories were perceived less oten in the MRs, although a higher level of detail was observed in these features.
supericially exposes the reporting of management practices and the performance evaluation measures adopted in the companies. In general, the 3rd evolutionary stage indicators
were found less oten, with activity-based management models and adhesion to the Kaizen philosophies being veriied in around 10% of the MRs.
The companies that constitute Level 1 corporate governance feature level of detail on their people management policies and incentives destined to social projects as a predominant characteristic in their MRs. Philosophies rooted in value creation are briely presented in 13.33% of the MRs, discourses regarding control and planning of activities account for 20% of the frequencies, while guidance indicators and market forecasts and outlook show up in 13.33% and 26.67% of the observations, respectively.
Compared to the other levels of governance in the BM&FBOVESPA, the reports from the companies listed in the Traditional Bovespa are more focused on presenting productivity and extension of activities. The MRs are presented less extensively and with compact descriptions, a factor that may compromise perception of some indicators, such as the benchmark (2%), guidance presentation (3.85%), and the organizational forecasts and outlook (9%).
It was veriied, on this level, that some companies more clearly describe the strategies adopted for better performance, as well as plans drawn up to reduce bad debts. Out of the sample, the occurrence of six companies in receivership was perceived. It is believed that the context stimulates reporting of organizational values and discourses predominantly focused on social and strategic company projects as a way of keeping market share or attracting investors who wish to take a risk on a company that makes an efort to overcome the diiculties that afect it.
4.4 Advances in Terms of Disclosure: he Application
of MCA
Choosing to use MCA to carry out the diagnostics allowed for the diagram of management control practices reported in the MRs to be grouped, indicating the possible existence of relationships between the company categories (awarded and not awarded) and the “transparency” of the reports. With the technique adopted, the representativeness of the results is observed via inertia, an index which indicates the contribution from the elements (variables) in constructing the axes, that is, how much the variability in
the data is explained in each dimension (Crivisqui. 1995). Regarding this indicator, Hair Jr., Black, Babin, Anderson, and Tatham (2009) suggest that dimensions with inertias higher than 0.20 (20%) should be considered. Moreover, the dimensional diagram (perceptual map) is understood to be a graphic representation of the spread of variables, with the results being visually observed based on clusters (Pestana & Gageiro. 1998). It is expected in this study that the categories of companies “nominated for the award” and “not nominated for the award” are close to their respective reporting of management control practices variables, thus showing the existence of larger or smaller connections between the groups.
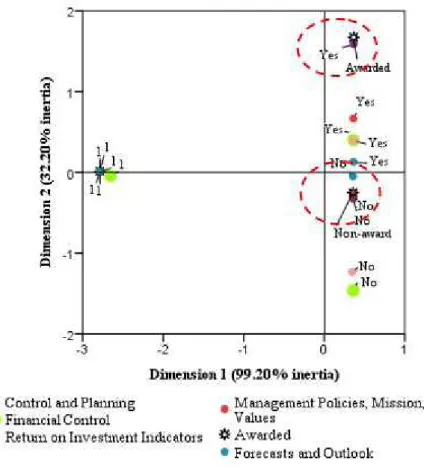
he data analysis – displayed in Figure 1 – highlights the connections between the companies and reporting of the management control that its into the 1st and 2nd evolutionary
stages. Segmented analysis was chosen in order to present a clearer graphic visualization of the events. hus, the perceptual map has two dimensions: the companies not nominated for the Transparency Trophy displayed in the irst of these, and the nominated ones in the second. he indings show consistency in the dimensions (inertia > 0.2), with it being possible to infer that the variance in data is explained in around 99% of the cluster of categories presented in dimension 1 (inertia 0.992, eigenvalue 5.950). It should be highlighted that the results may be derived from the main variable that characterizes the quadrant, that is, the concentration of companies not nominated for the award. he second dimension, in turn, shows that 32.20% of the data variance can be explained by the set of elements represented there (inertia 0.332; eigenvalue 1.993).
Unlike the aforementioned, dimension 2 shows ive positively categorized management control practices on its plane with regards to reporting information in the MRs. However, it is observed that only the variable related to information on control and planning of operations is associated with the proile of companies nominated for the award. From this perspective, it is clear that the companies nominated for the ANEFAC/FIPECAFI/Serasa Experian Transparency Award behave similarly with regards to level of description and support for information related to control and planning of operations. his inding may be related to the organizations’ image in society, such as in the operations carried out or in their operating sector. Moreover, it is understood that presenting company conidence to investors, with regards to future projects, may be a suiciently attractive strategy when the aim is to maintain their shares.
MCA was used again for the other variables regarding the management control practices reported in the MRs (3rd
and 4th evolutionary stages) and for the nomination for the
Transparency Trophy categories. he indings show that around 99% of the variance in the data is explained in the spread of the irst dimension of the perceptual map (0.995 inertia; eigenvalue 10.948). he second dimension, in turn, was able to represent 24% of the spread of observations (0.246 inertia; eigenvalue 2.708). Just as in the previous analysis, it is understood that the disparity in the explanatory power of the dimensions derives from the concentration of observations related to the not nominated for the award category in dimension 1, in light of the small nominated group in the second dimension. Figure 2 presents three main groups in the perceptual map, two of them formed from nomination for the award categories.
Figure 1 .Dimensional graph for reporting of management control practices (1st and 2nd evolutionary stages) and companies nominated for the Transparency Award
The clusters displayed in Figure 2 show peculiar characteristics with regards to reporting of management control practices in the MRs of the companies nominated for the award. Although it is perceived that the variables from the second dimension exhibit a proactive tendency with regards to reporting these practices, the dimensional graph proposes that the awarded category is strongly associated only with reporting of philosophies and contemporary management models – just in time. In contrast, it is observed that the greatest tendency is for omitting this management control, as presented in dimension 1.
he cluster formed in the irst dimension presents strong evidence that, in general, the other companies listed on the BM&FBOVESPA do not have any level of transparency (or it is imperceptible) in relation to the management practices listed in the perceptual map. From this perspective, it is believed that the companies listed in the not nominated for the award category correspond to the proile of MRs involving other (for example, strictly inancial) focuses, or
even that they are strategically elaborated in order to omit their internal practices, opting for an information barrier from competitors.
Although relationships have not been observed regarding the category of companies nominated for the award, it is noted that the main diference in this aspect was determined by the just in time variable, indicating that somehow these companies report the adoption of “right time” type production management, avoiding possible costs derived from holding stock. It is understood that this indicator may also be presented in the MRs as a strategic action for reducing expenses, and consequently, eiciency in the results. his study conirms indings from Brazilian studies such as that from Aillón, Silva, Pinzan, and Wuerges (2013), who describe that, although some characteristics associated with the companies nominated for the award are observed, in general there is a low level of transparency of managerial information in their reports. his study also broadens previous proposals, such as those from Aillón et Figure 2 .Dimensional graph for reporting of management control practices (3rd and 4th evolutionary stages) and companies nominated for the Transparency Award
al. (2013), and Guerreiro et al. (2011), since the irst veriies adopted (but not reported) management practices and the second carries out an investigation, in explanatory notes, of companies that compose the Brazil 50 Index. Moreover, the evidence presented in this investigation suggests that
nomination for the ANEFAC-FIPECAFI-Serasa Experian Transparency Award is not the only factor that relates with the level of transparency of information regarding management practices.
5 FINAL REMARKS
Over the course of this investigation, the reader’s attention is drawn to market incentives for companies to adopt measures for more transparency in reported accounting information. In this context, as a transparency parameter, the MRs from the companies nominated for the 2014 Transparency Trophy are explored, assuming that the context of disclosure is related with inancial and managerial aspects and that the companies would possibly fulill these conditions on a diferent level from the others.
It is also understood that a transparent position in reporting good management practices may be a strategic action, since it is related to a responsible position of control and resource eiciency, a factor that can attract potential investors (Solomon & Solomon, 2006). In this context, the study aimed to verify whether there is evidence of a greater degree of reporting management control practices in the accounting statements of those companies nominated for the ANEFAC/FIPECAFI/Serasa Experian Transparency Award, in relation to the other companies.
he methodological design used to map the proiles for reporting of management control indicators was supported in the discourse analysis of the MRs in order to categorize the analysis variables and subsequently group them using MCA. he study was carried out for 19 companies nominated for the Transparency Award in 2014 and a sample of 124 companies listed on the BM&FBOVESPA.
The findings from this study did not allow for identification of the dominant profile with regards to reporting of management control practices in the MRs of the companies nominated for the award, showing that only two of the variables analyzed show a strong association with degree of transparency, these being control and planning practices and the just in time model. In this context, it is understood that the relationships found are not enough to airm that elements of transparency of management practices exist that distinguish the reporting carried out by the publicly-traded companies nominated for the 2014 ANEFAC Transparency Award, in relation to the other companies listed on the BM&FBOVESPA.
Moreover, regarding the qualitative aspect, the discourse analysis indicated that the practices related to management
and strategic positions are subtly presented in the MRs. It is believed that this is adopted in parts as a way of counter-balancing revealing strategic information to competitors, as was addressed in the theoretical framework of this investigation. However, it is observed that this summarized nature of the discourses is partially mitigated with reductions in levels of governance hierarchy, that is, the management indicators appear with more detailed information in decreasing segment levels. It is suggested that this viewpoint be addressed in future research.
It is worth highlighting that the analysis also derives merit from the subjectivity regarding the preliminary interpretation of passages from the reports, an element that was used in the classiication of management indicators. Moreover, the analyses were carried out based on company MRs and could be extended to other reports, guaranteeing more robustness in the information presented up to now. It was also observed that the institutional website for the event (Transparency Trophy) presents the evaluation criteria in the format of topics, a feature that could somehow compromise descriptive understanding of the conditions evaluated in the statements, as was mentioned in the section on the methodological procedures for this study. he possibility is suggested of clarifying the elements that involve each indicator, also creating opportunities for other studies to consider these factors in a more systematic way. Moreover, it is believed that the inclusion of Management Accounting practices as one of the evaluation criteria could stimulate reporting of them to users and promote the discussion initiated by the CGMA (2014).
References
Abbade, E. B., Zanini, R., & Souza, A. M. (2012). Orientação para aprendizagem, orientação para mercado e desempenho
organizacional: evidências empíricas. Revista de Administração
Contemporânea (online), 16(1), 118-136.
Aillón, H. S., Silva, J. O., Pinzan, A. F., & Wuerges, A. F. E. (2013). Análise das informações por segmento: divulgação de informações gerenciais
pelas empresas brasileiras. Revista Contemporânea de Contabilidade,
10(19), 33-48.
Allcott, H., & Greenstone, M. (2012). Is there an energy eiciency gap?
Journal of Economic Perspectives, 26(1), 3-28.
Anderson, H. R., Needles, B. E., & Caldwell, J. C. (1989). Managerial
accounting. Boston, MA: Houghton.
Anthony, R. N. (1970). Self review in management accounting. Richard D.
Irwin: Learning Systems Co.
Anthony, R. N., & Govindarajan, V. (2006). Sistemas de controle gerencial. São Paulo, SP: Atlas.
Associação Nacional dos Executivos de Finanças, Administração e
Contabilidade. (2014). Troféu Transparência 2014. Retrieved from
http://www.anefac.com.br/trofeutransparencia.aspx. Associação Nacional dos Executivos de Finanças, Administração
e Contabilidade. (2016). Troféu Transparência 2016, Critérios
de seleção. Retrieved from http://www.anefac.com.br/
TrofeuTransparencia_internas.aspx?ID=2.
Benzécri, J. P. (1992). Correspondence analysis handbook. New York, NY:
Marcel Dekker.
Berle, A., & Means, G. (1932). he Modern Corporation and Private
Property. New York, NY: Macmillan.
Bhimani, A., Gosselin, M., Ncube, M., & Okano, H. (2007). Activity
based costing: how far have we come internationally? Cost
Management, 21(3), 12-17.
Browmich, M. (1988). Managerial accounting deinition and scope –
from a managerial view. Management Accounting, 66(8): 26-27.
Carvalho, H. (2004). Análise multivariada de dados qualitativos:
utilização da Homals com o SPSS. Lisboa, Portugal: Edições Sílabo.
Chenhall, R. H., & Langield-Smith, K. (1998). he relationship between strategic priorities, management techniques and management accounting: an empirical investigation using a systems approach.
Accounting, Organizations, and Society, 23(3), 243-264.
Cooper, D. R., & Schindler, P. S. (2011). Métodos de pesquisa em
administração (10a. ed.). Porto Alegre, RS: Bookman.
Crivisqui, E. (1995). Apresentação da análise fatorial de correspondência simples e múltiplas. Programme de Recherche et D’Enseignement en
Statistique Appliquée. Presta, Belgique: Université Libre de Bruxelles.
Diamond, D. (1985). Optimal release of information by irms. he
Journal of Finance, 40(4), 1071-1094. Retrieved from http://www.
jstor.org/stable/2328395.
Falconer, M. (2002). Research and practice in management accounting:
improving integration and communication. he European Accounting
Review, 11(2), 277-289.
Ferreira, A., & Otley, D. (2006). Exploring inter- and intra-relationships between the design and use of management control system [Working Paper]. Social Science Research Network. Retrieved from http://ssrn. com/abstract=896228.
Frezatti, F., Carter, D. B., & Barroso, M. F. G. (2014). Accounting without accounting: Informational proxies and construction of organisational discourses. Accounting, Auditing & Accountability Journal, 27(3), 426-464.
Global Management Accounting Principles. (2014). Princípios globais
de contabilidade gerencial. Retrieved from http://www.cgma.org/
Resources/Reports/Pages/GlobalManagementAccountingPrinciples. aspx.
Graham, C. (2013). Teaching accounting as a language. Critical
Perspectives on Accounting, 24(2), 120-126.
Greenacre, M. (2007). Correspondence analysis in practice (2a ed.). Barcelona, Spain: Chapman and Hall/CRC.
Grossman, S. J. (1981). he informational role of warranties and private
disclosure about product quality. Journal of Law and Economics,
24(3), 461-483.
Grossman, S. J., & Hart, O. D. (1980). Disclosure laws and takeover bids.
Journal of Finance, 35(2), 323-334.
Guerreiro, R., Cornachione Jr., E. B., & Soutes, D. O. (2011). Empresas que se destacam pela qualidade das informações também se destacam pela utilização de artefatos modernos de contabilidade gerencial? Revista Contabilidade & Finanças, 22(55), 88-113. Guerreiro, R., Pereira, C. A., & Frezatti, F. (2008). Aplicação do modelo
de Burns e Scapens para avaliação do processo de institucionalização da contabilidade gerencial. Organizações & Sociedade, 15(44), 45-62. Hair Jr., J. F., Black, W. C., Babin, B. J., Anderson, R. E., & Tatham, R. L.
(2009). Análise multivariada de dados (6a. ed.). Porto Alegre, RS: Bookman.
Hayes, R. M., & Lundholm, R. (1996). Segment reporting to the capital
market in the presence of a competitor. Journal of Accounting
Research, 34(2), 261-279.
Hendriksen, E. S., & Van Breda, M. F. (2014). Teoria da contabilidade. São Paulo, SP: Atlas.
International Federation of Accountants. (2009). Management accounting
concepts. Retrieved from http://www.mia.org.my/handbook/guide/
IMAP/imap_.htm#MANAGEMENT%20ACCOUNTING%20 AND%20THE%20MANAGEMENT%20PROCESS. International Federation of Accountants (IFAC). (March 1998).
International Management Accounting Practice Statement:
Management Accounting Concepts. New York: Financial and
Management Accounting Committee, 82-100.
Jarvenpaa, M. (2007). Making business partners: a case study on how
management accounting culture was changed. European Accounting
Review, 16(1), 99-142.
Kaplan, R. S., & Norton, D. P. (1992). he balanced scorecard: measures
that drive performance. Harvard Business Review, January-February,
71-79.
Kotler, P. (1998). Administração de marketing: análise, planejamento,
implementação e controle (5a ed.). São Paulo, SP: Atlas.
Leuz, C., & Wysocki, P. (2006). Economic consequences of inancial reporting and disclosure regulation: What have we learned?
[Working paper]. University of Chicago, Chicago, IL. Retrieved from
http://ssrn.com/abstract=1105398.
Lundholm, R. (1991). Public signals and the equilibrium allocation of information. Journal of Accounting Research, 29(2), 322-349. Madsen, W. C. (2009). Collaborative helping: a practice framework for
family-centered services. Family Process, 48(1), 103-116. Otley, D. (2003). Management control and performance management:
whence and whither? he British Accounting Review, 35(4), 309-326.
Ott, E. (2004). Responsabilidade social, balanço social e demonstração
do valor adicionado [Caderno de estudos da disciplina Teoria da
Contabilidade]. São Leopoldo, RS: Unisinos.
Pestana, M. H., & Gageiro, J. N. (2000). Análise de dados para Ciências
Sociais. A complementariedade do SPSS (2a ed.). Lisboa, Portugal:
Edições Sílabo.
Pinheiro, V. A. A., & Boscov, C. P. (2015). Análise de informações por segmento das empresas premiadas pelo Troféu Transparência
ANEFAC/FIPECAFI/SERASA 2013. ConTexto (Porto Alegre), 15(29),
96-112.
Ripley, W. Z. (1927). Main Street and Wall Street. Boston, MA: Little Brown & Co.
Scapens, R. W. (2006). Understanding management accounting practices: a personal journey, he British Accounting Review, 38(1), 1-30. Solomon, J., & Solomon A. (2006). Private social, ethical, and
environmental disclosure. Accounting, Auditing, & Accountability
Journal, 19(4), 564-591.
Soutes, D. O., & Zen, M. J. C. M. (2005). Estágios evolutivos da contabilidade gerencial em empresas brasileiras. In Anais eletrônicos
do Congresso USP de Controladoria e Contabilidade, São Paulo, SP.
Retrieved from http://www.congressoeac.locaweb.com.br.
Soutes, D. O. (2006). Uma investigação do uso de artefatos da
contabilidade gerencial por empresas brasileiras (Master’s Degree).
Sulaiman, M., Ahmad, N. N., & Alwi, N. (2004). Management accounting practices in selected Asian countries: a review of the literature.
Managerial Auditing Journal, 19(4): 493-508.
Sullivan, T.A., Warren, E., & Westbrook, J. (1998). Financial diiculties of small businesses and reasons for their failure, U.S. Small Business Administration, Business Bankruptcy Project, Townes Hall, the
University of Texas at Austin. Retrieved on November 15, 2014 from
http://www.sba.gov/advo/research/rs188tot.pdf.
Verrecchia, R. (2001). Essays on disclosure.Journal of Accounting &
Economics, 32(1-3), 97-180.
Wagenhofer, A. (1990). Voluntary disclosure with a strategic opponent. Journal of Accounting & Economics, 12(4), 341-364. doi:10.1016/0165-4101(90)90020-5.
Correspondence address:
Márcia Maria dos Santos Bortolocci Espejo
Fundação Universidade Federal de Mato Grosso do Sul, Escola de Administração e Negócios Avenida Senador Filinto Muller, 1555 – CEP: 79070-900