Article
Piassava Fibers (Attalea funifera): NMR Spectroscopy of their Lignin
Adilson R. Gonçalvesa*, Ulf Schuchardtb, Maria L. Bianchib and Antonio A. S. Curveloc
a
Departamento de Biotecnologia, Faculdade de Enghenharia Química de Lorena, CP 116, 12600-000, Lorena - SP, Brazil
b
Instituto de Química, Universidade Estadual de Campinas, CP 6154, 13083-970, Campinas - SP, Brazil
c
Instituto de Química de São Carlos, Universidade de São Paulo, CP 780, 13560-970, São Carlos - SP, Brazil
Lignina de piaçava (Attalea funifera) foi analisada por espectroscopia RMN de hidrogênio e carbono-13. A natureza HGS dessa lignina foi confirmada, mas unidades p-cumarato tambem estão presentes na estrutura da lignina. Os conteúdos de hidroxilas fenólicas e metoxilas por unidade fenilpropânica, determinados por RMN de 1H, foram 0,57 e 0,68, respectivamente e estão em concordância com os dados obtidos por métodos clássicos. A pequena extensão da condensação da lignina (35%) foi explicada pelo alto conteúdo de estruturas de álcool cinamílico, evidenciadas por RMN de 13C-DEPT. Uma fórmula C
9 estendida foi determinada para a lignina da piaçava: C9.00H2.25H O (OH) (OH) (OCH )
ar 3.73 al
0.89 0.69
ph
0.86 al
3 0.57
Lignin of piassava (Attalea funifera) was analyzed by 1H- and 13C-NMR spectroscopy. The
HGS-nature of this lignin was confirmed but p-coumarate units are also present in the lignin. Methoxyl
and phenolic hydroxyl contents per phenylpropanic unit were determined by 1H-NMR spectroscopy to be 0.57 and 0.68, respectively and are in agreement with wet chemistry methods. A small extent of lignin condensation (35%) was explained by the high content of cinnamyl alcohol structures, evidenced by 13C-NMR-DEPT. An extended C9-formula for the piassava lignin was established to be
C9.00H2.25ar H O (OH) (OH) (OCH )
3.73 al
0.89 0.69
ph
0.86 al
3 0.57
Keywords: piassava fibers, lignin, NMR-spectroscopy
J. Braz. Chem. Soc., Vol. 11, No. 5, 491-494, 2000.
Printed in Brazil
c 2000 Soc. Bras. Química 0103 - 5053 $6.00+0.00
Introduction
In a previous paper lignocellulosic material of piassava fiber (Attalea funifera, a palm tree) was characterized by chemical analysis and submitted to alkaline solvolysis in dioxane/water1. The results concerning the piassava lignin were remarkable. The Klason lignin content was unusually high (ca. 45%) and the distillable oils, obtained by alkaline solvolysis in 40% yield (based on the raw material), consisted mainly of phenol, with some guaiacol, syringol and their alkyl derivatives. Methoxyl group analysis of the lignin showed a content of 0.54 OMe for each phenyl-propane unit, suggesting that the lignin of piassava is rich in hydroxyphenyl units.
In this work piassava lignin was submitted to further in-depth analysis using NMR spectroscopy. 1H- and 13C-NMR spectroscopy has been used as an alternative and
non-degradative technique for the characterization of lignocellulosics. As shown in the literature2, hydrogen signals can be assigned in a 1H-NMR spectrum of acetylated lignin. The assignments of carbon signals in a 13C-NMR spectrum of lignin can also be improved by means of pulse sequence procedures such as DEPT. In the recent literature these techniques were used for monitoring production or reduction of lignin in pulps3 and for characterizing residual and isolated lignins from pulps4. Other modern techniques such as 1H-13C correlation spectra have been used for the characterization of grass lignins5. Since piassava lignin has not been well characterized until now, we present here the results of the NMR analysis of this lignin.
Materials and Methods
Extraction of lignin from piassava fibers
Piassava fibers obtained from palm tree (Attalea funifera), used in brooms, were exhautively washed with water and the
492 Gonçalves et al. J. Braz. Chem. Soc.
extraction was performed with dioxan: HCl 2 mol L-1 (9:1) at reflux temperature, for 5 h. After evaporation of the solvent, extracted lignin was obtained and characterized for molecular weight distribution, FTIR and elementar analysis as described elsewhere1.
Nuclear Magnetic Resonance
The extracted piassava lignin was acetylated by a 1:1 pyridine/acetic anhydride solution at 50oC for 24 h in a sealed flask6.
The 1H-NMR spectrum of the acetylated lignin was recorded on a Bruker 300 MHz. The spectrum was measured at 24oC with 32K data points and 128 scans, using 30 mg of the sample dissolved in 1 mL of CDCl3 with TMS as internal standard. Pulse of 3.5 µs and relaxation delay 1 s. The 13C-NMR spectrum of the non-acetylated lignin was recorded
on a Bruker 300 MHz at 24oC with 32K data points and 19096 scans, using 30 mg of the sample dissolved in 1 mL of DMSO (TMS as internal standard). Total spectrum measured by decoupling 1H at acquisition time (0.88 s), using the POWGATE software (Inverse Gated Decoupling); irradiation pulse of 6.4 ms, relaxation time of 5 s. After the quantitative analysis, the DEPT (Distortionless Enhancement by Polarization Transfer) experiment was performed to assign the regions according to the type of carbon atom. The spectra were measured in the same spectrometer at 24oC with 32K data points and 11000 scans and acquisition time 0.95 s. Three basic subspectra were recorded with pulses of 45o, 90o and 135o and the CH, CH
2 and CH3 pure subspectra were calculated and analyzed according to Chen and Robert2,7.
Results and Discussion
1H-NMR spectrum of acetylated piassava lignin
The analyses of molecular weight distribution and FTIR spectra of the extracted lignin published in the
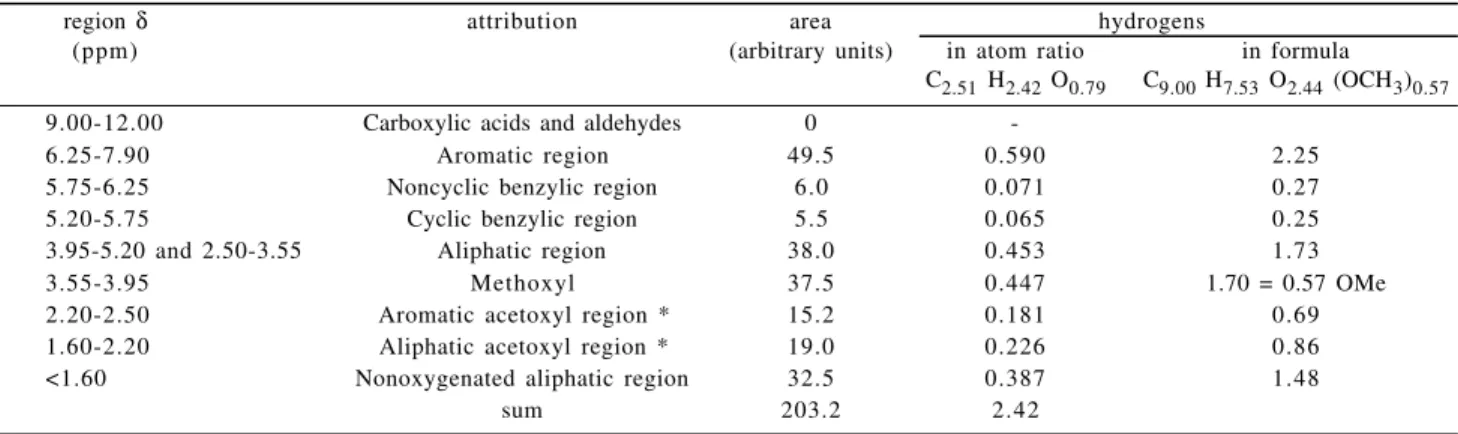
previous work, showed that no contaminants (such as tannins or other extractives) were present in the sample1. The results of the semiquantitative analysis of the 1H-NMR spectrum are shown in Table 1, where the hydrogen signals and areas are subdivided into the corresponding regions.
From the elemental analysis of extracted piassava1 (54.5% C; 5.84% H; 0.52% N), and subtracting the holocellulose content (54.73% measured as C6H10O5), we obtained the following atomic ratio for the piassava lignin: C2.51 H2.42 O0.79, where the nitrogen content was neglected and the oxygen content calculated by difference. In lignin chemistry the empirical formula of the macro-molecule is commonly given as a hypothetical hydroxy-phenyl structure unit. This is known as the C9-formula, with 6 carbon atoms at the benzene ring plus three carbon atoms of the propyl side-chain. Besides these 9 carbon atoms, only the carbon atom of the methoxyl units (-OCH3) is present in the macromolecule. For the calculation of the C9-formula the first step is to determine the methoxyl content and subtract it from the total carbon. This determination is easily made either by wet chemistry or by
integration of the hydrogen signal of the 1H-NMR
spectrum, since the methoxyl region is well defined. The integration of the hydrogen signals (Table 1) results in a total area of 203.2 arbitrary units which corresponds to the 2.42 protons in the above-given ratio. The integration of the methoxyl region (δ 3.55-3.95) results in 0.15 methoxyl units (0.44 hydrogen atoms divided by 3 hydrogen atoms per methoxyl group). Subtracting this value from the total carbon and oxygen atoms as well as subtracting the hydrogen atoms corresponding to the methoxyl units, we can establish a new relation: C2.36 H1.98 O0.64 (OCH3)0.15 . Making the carbon atoms to 9.00, the C9-formula was calculated to: C9.00 H7.53 O2.44 (OCH3)0.57 (Table 1). The calculated value for OCH3 per C9 unit is 0.57 which is in agreement with the value of 0.54 obtained in the previous paper1. These values are
Table 1. 1H-NMR data of the acetylated piassava lignin (Area and total protons are divided into regions according to Chen and Robert2).
region δ attribution area hydrogens
(ppm) (arbitrary units) in atom ratio in formula C2.51 H2.42 O0.79 C9.00 H7.53 O2.44 (OCH3)0.57
9.00-12.00 Carboxylic acids and aldehydes 0
-6.25-7.90 Aromatic region 49.5 0.590 2.25
5.75-6.25 Noncyclic benzylic region 6.0 0.071 0.27
5.20-5.75 Cyclic benzylic region 5.5 0.065 0.25
3.95-5.20 and 2.50-3.55 Aliphatic region 38.0 0.453 1.73
3.55-3.95 Methoxyl 37.5 0.447 1.70 = 0.57 OMe
2.20-2.50 Aromatic acetoxyl region * 15.2 0.181 0.69 1.60-2.20 Aliphatic acetoxyl region * 19.0 0.226 0.86 <1.60 Nonoxygenated aliphatic region 32.5 0.387 1.48
sum 203.2 2.42
Vol. 11 No. 5, 2000 Piassava Fibers (Attalea funifera): NMR Spectroscopy of their Lignin 493
also in agreement with those obtained by Berns et al.8 from analytical pyrolysis of piassava fibers. These authors found a H/G/S ratio of 51/40/9, which correponds to an average methoxyl content of 0.58 OCH3 / C9 unit.
The condensation degree of the lignin can be calculated from the methoxyl content and the 1H-NMR spectrum. For each C9 unit a maximum of 4 aromatic hydrogen atoms is expected, since the carbons at positions 1 and 4 are linked to the propyl chain and to the phenolic hydroxyl/ ether linkage, respectively. Some of the aromatic positions are occupied by methoxyl groups and for the piassava lignin a maximum of 3.43 aromatic hydrogens (4.00 minus 0.57 OCH3) is expected. The aromatic region (δ 6.25 to
7.90) corresponds to 2.25 hydrogens per C9 unit, thus allowing the determination of the condensation degree (34%) by the difference to the maximum aromatic hydrogens. This value is similar to that of lignins obtained by steam explosion, which ranges from 38% to 41%9. The conden-sations are mostly due to 5-5 and β-1 linkages between phenylpropanic units.
Determination of phenolic hydroxyl groups by NMR
(0.69/C9, Table 1) is also in agreement with the
chromatographic method (0.72/C9)1. Additionally, the aliphatic OH groups amount to 0.86 per C9 unit. Thus the C9 formula can be expanded to
C9.00H2.25H O (OH) (OH) (OCH )
ar 3.73 al
0.89 0.69
ph
0.86 al
3 0.57
The amount of aldehyde and acidic protons is negligible (signal above δ 9). This corresponds to a small content of terminal γ-carbonyl and carboxyl groups, showing that most carbonyl groups are located in α and β positions of the propyl chains.
13C-NMR spectrum of the piassava lignin
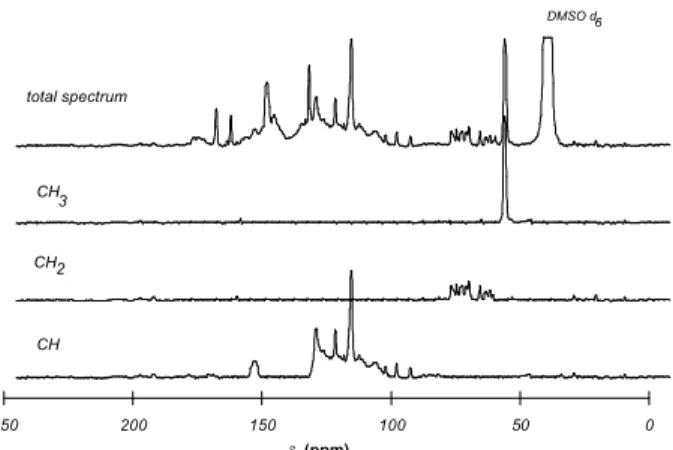
The 13C-NMR spectrum of the extracted piassava lignin is shown in Figure 2. It has characteristic H signals found at
δ 161.5, 131.3, 116.0 and 121.32 and also typical
p-coumarate signals in the region around δ 150. Furthermore
these signals have the highest intensities confirming the high H content of this lignin, evidenced by other techniques, or the high incorporation of p-coumarate units as attached moieties, as described for other lignins10,11.
The non-aromatic region (δ 50-103) has a small
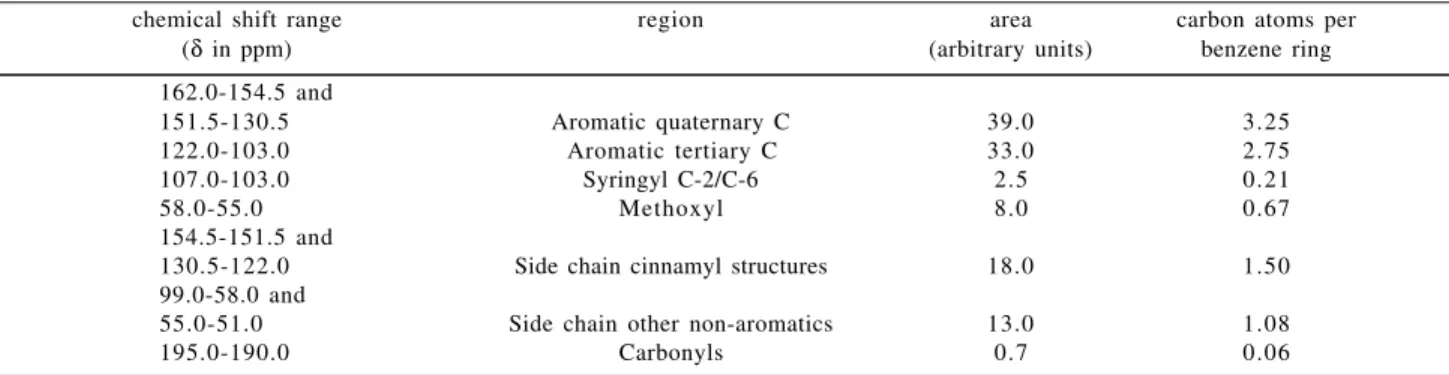
intensity. Since each C9-unit contains 6 aromatic and 3 aliphatic carbons, the integration of the non-aromatic region is expected to amount to about half of that of the aromatic region. In order to verify the presence of aliphatic structures such as cinnamic acids in the aromatic region, a DEPT spectrum was recorded to separate CH, CH2 and CH3 signals (Figure 2). The aromatic region (δ 103-160) is only contaminated by C-α and C-β of cinnamyl-type structures, and the integration of these signals (δ 122-130.5 and δ 151.5 to 154.5, respectively) must be considered to be part of the non-aromatic region (carbons of propyl side chain). With respect to the C9-formula the aromatic region must correspond to 6 carbon atoms. The total integration of this region (δ 103 to 155) is 72.0 arbitrary units which corresponds to 12.0 arbitrary units/carbon atom. Table 2 shows the results of the application of this factor to all regions of the 13C-NMR spectrum.
0 1 2 3 4 5 6 7 8 9 10
δ (ppm)
Figure 1. 1H-NMR spectrum of acetylated piassava lignin.
Table 2. 13C-NMR data of piassava lignin lignin (Area and total carbons are divided into regions according to Chen and Robert2).
chemical shift range region area carbon atoms per (δ in ppm) (arbitrary units) benzene ring
162.0-154.5 and
151.5-130.5 Aromatic quaternary C 39.0 3.25
122.0-103.0 Aromatic tertiary C 33.0 2.75
107.0-103.0 Syringyl C-2/C-6 2.5 0.21
58.0-55.0 Methoxyl 8.0 0.67
154.5-151.5 and
130.5-122.0 Side chain cinnamyl structures 18.0 1.50 99.0-58.0 and
55.0-51.0 Side chain other non-aromatics 13.0 1.08
195.0-190.0 Carbonyls 0.7 0.06
494 Gonçalves et al. J. Braz. Chem. Soc.
C-2 and C-6 per aromatic ring. This is equivalent to 0.105
S units per C9 unit or 10.5% S units in piassava lignin. Analytical pyrolysis furnished a similar value of 9%8.
C9 unit) and phenolic hydroxyl (0.69 OHph per
C9 unit) contents agree with those obtained by other
methods. An extended C9-formula was obtained
C9.00H2.25H O (OH) (OH) (OCH )
ar 3.73 al
0.89 0.69
ph
0.86 al
3 0.57. The
piassava lignin has a HGS nature, with high content of
p-coumarate, and the presence of cinnamyl alcohol
structures was evidenced by 13C-NMR. The degree of piassava lignin condensation is low (34%), which explains its high reactivity under basic hydrolysis conditions.
Acknowledgements
Financial support from FAPESP and CNPq are acknowledged. The authors thank M. E. M. Coelho for technical assistance.
References
1. Schuchardt, U.; Bianchi, M. L.; Gonçalves, A. R.; Curvelo, A. A. S.; Biscolla, F. C.; Peres, L. O. Cellul.
Chem. Technol. 1995, 29, 705.
2. Chen, C. L.; Robert, D. In Methods in Enzimology,
161, Wood, W. A.; Kellog, S. T., Eds.; Academic Press;
New York, 1988, p. 137.
3. Labidi, A.; Robert, D.; Pla, F. Holzforschung 1993,
47, 213.
4. Pan, X.; Lachenal, D.; Neirinck, V.; Robert, D. J. Wood
Chem. Technol. 1994, 14, 483.
5. Galkin, S.; Ärmmälahti, E.; Kilpeläinen, I.; Brunow, G.; Hatakka, A. Holzforschung 1997, 51, 130. 6. Chen, C. L. In Methods in Lignin Chemistry, Lin, S.Y.;
Dence, C.W., Eds.; Springer Verlag; Berlin, 1992, p. 409. 7. Robert, D. In Methods in Lignin Chemistry, Lin, S.Y.; Dence, C.W., Eds.; Springer Verlag; Berlin, 1992, p. 250. 8. Berns, J; Meier, D. and Faix, O. Analytical pyrolysis of piassava, unpublished results, personal communication. 9. Silva, F. T., Ph. D. Thesis, State University of
Campinas, Campinas, Brazil, 1995.
10. Ralph, J.; Hatfield, D. J. Agric. Food Chem. 1991,
39, 1426.
11. Ralph, J.; Hatfield, R.D.; Quideau, S.; Helm, R.F.; Grabber, J.H.; Jung, H. -J. G. J. Am. Chem. Soc. 1994,
116, 9448.
Received: July 14, 1999 Published on the web: August 31, 2000
FAPESP helped in meeting the publication costs of this article. 0
50 100
150 200
250
(ppm)
DMSO d6
total spectrum
CH CH CH3
2
δ
Figure 2. 13C-NMR spectrum and CH
3-, CH2-, CH-subspectra of
piassava lignin.
Methoxyl content is calculated by integration of the
δ 55 to 58 region, giving a total area of 8.0 arbitrary units, which correspond to 0.67 OMe/C9. This value is 24% higher than the 0.54 OCH3 per C9 unit found by wet chemistry methods1.
A close analysis was performed with respect to the aromatic region. Table 2 shows that the integration of CH signals (tertiary carbons) amounts to 2.75 carbons. A corresponding analysis of 1H-NMR spectrum revealed only 2.25 hydrogens for this region. A higher intensity for the tertiary carbons could be attributed to the Nuclear Overhauser Effect, although the difference is high (22%). The values obtained from the 1H-NMR analysis are accepted as being correct.
The aliphatic region containing cinnamyl structures has an unusual integration area, corresponding to 1.5 carbons per C9 unit. This accounts for the small conden-sation of this lignin. It seems that the original structures were preserved in the piassava lignin biosynthesis, in spite of its high H content.
Conclusions
1H- and 13C-NMR spectroscopy was used in this work