Article
0103 - 5053 $6.00+0.00
*e-mail: [email protected]
Li Diffusion and Electrochromism in Amorphous and
Crystalline Vanadium Oxide Thin Film Electrodes
Jair Scarminio,*,a Paulo R. Catarini,a Alexandre Urbano,a Rogério V. Gelamo,b
Francisco P. Rouxinolb and Mário A. Bica de Moraesb
aDepartamento de Física, Universidade Estadual de Londrina, 86051-970, Londrina-PR, Brazil
bInstituto de Física Gleb Wataghin, Universidade Estadual de Campinas, 13083-970, Campinas-SP, Brazil
Filmes amorfos de óxido de vanádio foram depositados sobre substratos de vidro recobertos com ITO, pela técnica de deposição de filmes de óxidos metálicos por filamento aquecido. Os espectros de difração de raios-X mostraram que os filmes como-depositados tratados termicamente em atmosfera de argônio em 200 e 300 oC continuaram amorfos e os tratados a 400 e 500 oC
tornaram-se policristalinos, com a estrutura do V2O5. Os eletrodos foram eletroquimicamente reversíveis sob intercalação de Li+, exibindo o efeito eletrocrômico, observado por medidas da
transmitância ótica em 632,8 nm. O coeficiente de difusão do Li, DC, foi medido pela técnica de titulação galvanostática intermitente (GITT) em função da carga inserida. Para os filmes cristalinos, a absorbância ótica e o DC aumentam com a quantidade de Li inserido, nas regiões de fase única de LixV2O5 cristalino e decrescem nas regiões de duas fases. Para essas, um DC efetivo foi considerado. Nos filmes cristalinos foi inferida a presença de outros óxidos de vanádio misturados à matriz de V2O5, através das medidas de cronopotenciometria e de DC.
Amorphous vanadium oxide films were synthesized onto ITO-coated glass substrates by the hot filament metal oxide deposition technique. The as-deposited samples were heat-treated in an argon atmosphere. X-ray diffraction analysis revealed that the films treated at 200 and 300 oC were
still amorphous, while those treated at 400 and 500 oC were crystalline, with a V
2O5 structure. All
electrodes were electrochemically reversible for Li+ intercalation, exhibiting the electrochromic
effect, observed from optical transmittance measurements at 632.8 nm. The Li-diffusion coefficient, DC, was measured by the galvanostatic intermittent titration technique (GITT) as function of the inserted charge. For the crystalline films it was observed that the optical absorbance and the DC increase with increasing Li insertion in the single-phase regions of crystalline LixV2O5 and decrease in the two-phase regions. For the latter, an effective DC was considered. The presence of other vanadium oxides mixed to the V2O5 matrix was inferred for the crystalline films from the chronopotentiometric and DC measurements.
Keywords: vanadium oxide film, chronopotentiometric, DC measurements
Introduction
Thin films of vanadium oxides have been extensively studied as electrodes for lithium electrochemical insertion. Owing to the usually high charge intercalation capacity of these films, they are highly promising as cathodes for secondary microbatteries1 and electrochromic devices.2
The interest in these oxides lies on their performance as high Li intercalation capacity, high potential, high energy density, good cycling performance and on the unusual
double electrochromic effect. The latter is the appearance of an anodic coloration in the near-ultraviolet region and a cathodic coloration in the near-infrared region as Li is intercalated.3
Amorphous and crystalline vanadium oxide thin film electrodes have been prepared using chemical4 or physical5
vapor techniques as well as wet chemical6,7 and electrochemical8
were reported on the potential and on the optical transmittance of amorphous and crystalline vanadium oxide thin film electrodes, under lithium electrochemical intercalation.9 In
polycrystalline V2O5 electrodes, Li intercalation induces the formation of LixV2O5 phases, whose structures are, at present, well known.10
Recently we developed a thin film deposition process, the hot filament metal oxide deposition (HFMOD),11 with
which tungsten and molybdenum oxide film electrodes were produced, and their electrochromic properties for Li intercalation were studied.12,13
In this paper, we investigate the optoelectrochemical properties of vanadium oxide films synthesized onto ITO-coated glass substrates by the HFMOD technique. The investigations were carried out in the amorphous as-deposited films and in those thermally-treated at 200, 300, 400 and 500 oC. The electrochemical characterization
was made by cyclic voltammetry and chronopotentiometry. We also measured the chemical diffusion coefficient, DC, an important parameter to characterize the kinetic in Li-insertion electrodes. The galvanostatic intermittent titration technique (GITT) was used for these measurements. The electrochromic effect was observed by measuring the optical transmittance at 632.8 nm during the electrochemical experiments.
Experimental
Vanadium oxide films were obtained by the HFMOD technique heating a metallic vanadium wire in a rarified oxygen atmosphere. Details of the deposition apparatus can be found elsewhere.11,12 The deposition chamber was
kept at a pressure of 0.24 Pa of oxygen, introduced via
a high precision mass flowmeter. During deposition, the chamber was continuously pumped. The temperature of the vanadium wire during the depositions was 1370 ±10 oC,
as measured with an optical pyrometer. The films were deposited onto indium tin oxide (ITO)-coated glass slabs.
Controlling the deposition time, a set of vanadium oxide films with different thicknesses was obtained. Subsequently, the films were thermally treated under argon flow in a quartz tube furnace, at temperatures of 200, 300, 400 and 500 oC
for 1.5 h each. The film thickness was measured using a high resolution profilometer.
The optoelectrochemical measurements were carried out in a hermetic three-electrode cell with lithium wires as reference and counter electrodes. The electrolyte was a 1 mol L-1 LiClO
4-PC (propylene carbonate) solution. The
electrolyte and the cell were handled inside a glove box filled with Ar and at a water vapor concentration lower than 10 ppm. A potentiostat (Radiometer, VoltaLab 10)
was used to perform the Li insertion and extraction of the vanadium oxide electrodes. Electrochemical Li insertions into the polycrystalline films were made above 2.0 V versus
Li/Li+ or with x in the range 0 < x < 1 in Li
xV2O5, in which
the electrochemical reactions are reversible.14
The redox reaction of the V2O5 electrodes were observed by cyclic voltammetries performed at scan rates of 10.0 mV s-1
(samples A, B, C and D) and 1.0 mV s-1 (sample E).
Galvanostatic charge-discharges (chronopotentiometry) were applied to record the EMF curves of the electrodes and to observe their electrochromic effect. The applied current was ± 15 µA in an electrode geometric area of 1.0 ± 0.1 cm2.
To characterize the Li diffusion mass transport trough the vanadium oxide film the GITT technique was employed by applying current pulses of -100 µA during 10 s, each one followed by 40 min with the cell in open circuit. The diffusion coefficient was calculated using the expression
(1)
where I is the pulse current intensity, L the film thickness, Ve is the potential at the end of the open circuit, V is the
transient electrode potential during the current application and Q is the charge inside the vanadium oxide electrode. DC
is calculated from the titulation curve dVe/dQ and from the
slope of the potential transient curve dV/d√–t. Description and
experimental details of this method can be found, particularly, in reference 15. This equation is valid just for single-phase regions, but current pulses were applied in both single and two-phase regions generated during the Li intercalation in these vanadium oxide electrodes. The lithium DC measured in these two-phase regions can be considered only as an effective one. Measurements of DC in two-phase intercalation systems are frequently found in the literature.16,17
The electrochromic effect was observed in situ from optical
transmittance measurements of a laser beam at 632.8 nm during galvanostatic charge-discharge experiments. A light intensity photodetector was used to measure the transmitted beam throughout the film electrode. The transmittance and the potential curves were recorded simultaneously.
The crystallinity of the as-deposited and of the thermally treated vanadium oxide films were observed from grazing incidence angle X-ray diffraction measurements, using the
monochromatized Cu-Kα radiation of 0.154518 nm.
Results and Discussion
and heat-treated vanadium oxide films. The as-deposited film was black. Under annealing at 200 and 300 oC the films
became transparent, with a bluish green color, and, when annealed at 400 and 500 oC, with a yellow color. The latter
is characteristic of vanadium pentoxide films. Although these colors may be due to light interference, it should be noted that the bulk oxides are also colored, with V2O5 being yellow, V6O13 being green, VO2 being deep blue, V2O3 being black and VO being metallic grey.18 These observations
strongly suggest that the as-deposited films are formed by V2O3 or VO, which, when thermally-treated to 200 and 300 oC, change to higher oxides or a mixture of these, and
when treated at 400 and 500 oC change to V
2O5 or even to
a mixture of V2O5 and an other lower oxides.
The X-ray diffraction patterns for the as-deposited and the heat-treated films are shown in Figure 1, as well as for the ITO-coated glass substrate. As it can be seen, only ITO peaks are exhibited in the as-deposited sample and in those treated at 200 and 300 oC. An amorphous structure is thus
ascribed to them. However, when heat-treated at 400 and 500 oC (samples D and E, see inset) the films present a
crystalline structure, since other peaks, aside from those of ITO, are observed. These peaks were assigned to the (001),
(101), (110) and (400) planes of the orthorhombic V2O5
polycrystalline lattice, in accordance with our preliminary observations regarding the film yellow color.
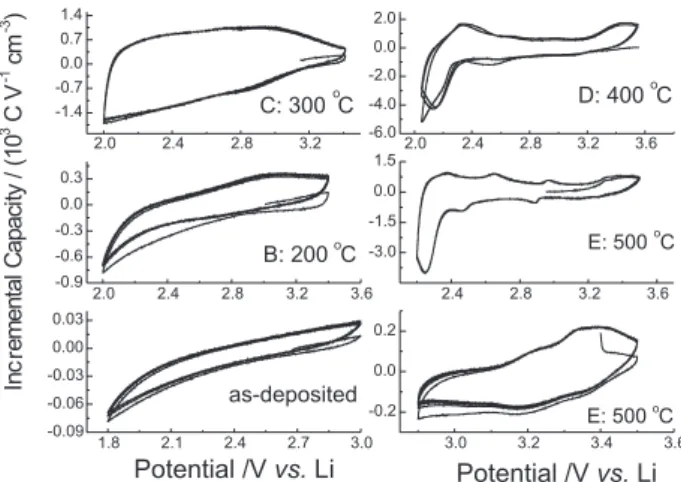
Figure 2 presents the differential intercalation and deintercalation capacity, Cdiff, as function of the electrode
potential for the as-deposited and thermally-treated films.
Cdiff = dQ/dE = I v-1 was calculated from the corresponding
cyclic voltammograms(I vs.E) and provides an adequated
form to compare cyclic voltammetries performed at different v scan rates. In the Figure 2, C
diff is presented
normalized to the film thickness.
The shapes of the voltammograms (presented in Figure 2 on their differential form) of the as-deposited film and of those annealed at 200 and 300 oC, confirm their
amorphous structure. The almost proportional dependence observed between the applied potential and the resulting differential capacity indicates a bad intercalation electrode
for the as-deposited film, but reversible electrodes with higher capacities were obtained for the oxide films treated at 300, 400 and 500 oC. The differential capacity curves of the films
annealed at 400 and 500 oCindicate that a polycrystalline
vanadium oxide was formed, as also observed from the X-ray diffractograms (Figure 1). However, it is observed from the two voltammograms of the films treated at 500 oC that besides the
well known reduction potential at 2.25, 3.2 and 3.4 V, attributed to the Li insertion into the oxide V2O5,19 reduction peaks are
also observed at 2.55 and 2.9 V, which can be attributed to ionic insertion into another vanadium oxide, mixed to the V2O5 oxide. These and the X-ray diffraction results suggest that the films annealed at 400 and 500 oC could be a V
2O5 composite
oxide although only diffraction peaks for vanadium pentoxide were observed in the spectra of Figure 1.
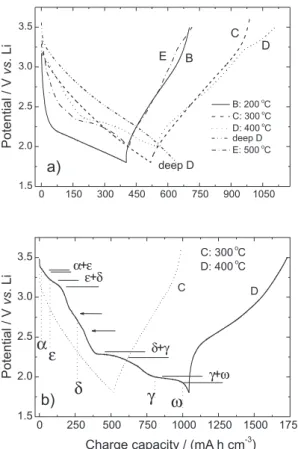
The galvanostatic charge-discharge curves as function of the electrode charge capacity (in mA h cm-3) for the
Table 1. Vanadium oxides samples, their thicknesses, annealing temperatures and the corresponding visual film appearances
Sample Thickness/(Å) Treatment
temperature/(o C) Visual appearance
A 2000 - black
B 740 200 bluish green
C 1200 300 bluish green
D 900 400 yellow
E 660 500 yellow
Figure 1. X-ray diffractograms for as-deposited and annealed vanadium
oxide films. The inset shows the diffractograms for samples D and E. The diffractogram of the ITO-coated glass substrate is also shown.
Figure 2. Differential capacity for the deposited and for the annealed
vanadium oxide thin film electrodes. Annealing was performed at 200, 300, 400 and 500 oC in argon atmosphere. Electrolyte: 1 mol L-1 LiClO
thermally-treated films are displayed in Figure 3. Figure 3a shows that the B and C samples present no step during the charging process, a typical behavior of amorphous electrodes. The deep ohmic drop observed in sample B is due to its low conductivity. Charge-discharge curves for D and E samples present steps and plateaus corresponding to phase regions of the crystalline LixV2O5 compound. Lithium intercalations were performed down to 1.8 V for the amorphous B and C samples and down to 2.0 V for the crystalline D and E samples. The latter voltage is the limit of the safe region for the reversibility of crystalline vanadium oxide electrodes, since deeper Li intercalation promotes an amorphyzation in the oxide structure, as shown in the curve deep D (Figure 3a), obtained after sample D was charged down to 1.8 V. The highest capacity was observed for the amorphizated D sample (deep D) and the lowest one for the amorphous B sample. The charge capacities for the electrodes annealed at 300 and 400 oC are almost similar but when treated at 500 oC
the electrode capacity decreases (sample E). Very similar results were found for vanadium pentoxide electrode films prepared by the sol-gel technique.6,20
Figure 3b shows the first galvanostatic charge-discharge curves as a function of the charge capacity for the amorphous
film treated at 300 oC (sample C) and for the crystalline
film treated at 400 oC (sample D), both charged from the
equilibrium potential down to 1.8 V. For the crystalline film the step and plateau regions in the charge-discharge curve closely match those of powders10and crystalline Li
xV2O5
films.20,21 The potential step observed in the beginning of the
Li insertion is attributed to the formation of the α-LixV2O5 phase (0 < x < 0.1). The next smooth step is caused by the settlement of ε-LixV2O5 phase (0.3 < x < 0.55) and, between them, the mixed α+ε phase. The deep step starting at 3.1 V and ending at 2.3 V would be the single δ-LixV2O5 phase (0.9 < x < 1.0) for a pure vanadium pentoxide, but between them small shoulders are observed at 2.8 and 2.6 V. Upon further lithium insertion a δ+γ two-phase region is formed before the single γ-LixV2O5 phase, when the electrode potential drops to 2.0 V. At this region lithium insertion make the oxide structure irreversible.22 Under deeper Li
insertion a weakly crystalline ω-LixV2O5 single phase occurs, starting at 1.8 V.10
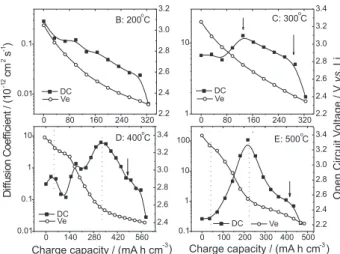
The dependence of the Li+ diffusion coefficient, DC, and
of the electrode open circuit voltage, Ve, as function of the
electrode charge capacity for the Li insertion are shown in Figure 4 for the annealed films. All data were obtained from the GITT procedure applied to the diffusion measurements. It should be stressed that the DC values calculated in the two-phase regions of LixV2O5, as previously outlined, are just effective diffusion coefficients. It can be seen that the shapes of Ve and DC curves are markedly dependent of the
film annealing temperatures. From the Ve potential curves,
Figure 4, or even from the dynamic chronopotentiometric curves, Figure 3, we can see that during the charge insertion process, the electrode potential decreases monotonically with the inserted charge for the films annealed at 200 and 300 oC
but, presents plateaus and steps for the films annealed at 400 and 500 oC, indicating, respectively, the amorphous and the
crystalline nature of the vanadium oxides.
Figure 4 shows that the diffusion coefficient decreases with the inserted charge in a scattered way for the film annealed at 200 oC, while a broad peak and shoulder are
seen on the DC curve of the film annealed at 300 oC. These
are true DC measurements of an amorphous single-phase film. On the other side, peaks and shoulders are observed at the diffusion coefficient curves of the films
thermally-treated at 400 and 500 oC. The magnitude of DCis also
dependent of the film annealing temperature, with the lowest and the highest values observed, respectively, for the amorphous films treated at 200 oC and for the crystalline
film treated at 500 oC, while intermediate DCvalues are
observed for the films treated at 300 and 400 oC. The
maximum DC was measured in the crystalline film E and is one order of magnitude higher than the maximum DC
Figure 3. a) Galvanostatic charge-discharge curves performed at ±15 µA
observed in the amorphous film C and in the crystalline film D. However, the charge capacity for the electrode E is not the highest among those of all other electrodes.
Significant conclusions about the dependence of DC on the crystalline phases of LixV2O5 can be drawn from Figure 4, for the crystalline films (D and E samples). Analyzing the diffusion coefficient and its concurrent Ve curves in Figure
4, it can be seem that a correlation exists between them, with DC increasing with the inserted charge in the step regions of the Ve curves and, decreasing with the charge in the plateau
regions of these curves. Therefore, a dependence of DC on the crystalline phases of the compound LixV2O5 can be inferred, according to the discussion regarding Figure 3 for the crystalline film. From these results it can be concluded then, that DC increases with Li content in the single-phase regions of LixV2O5 and decreases in the two-phase regions. In fact, is easily observable from Figure 4, that in the
δ-single phase region (the deep step in the Ve curve of the
D and E crystalline films), DC increases from 0.1×10⁻¹²
to 10×10-12 cm2 s-1 for the D sample and from 0.2×10⁻¹² to
100×10-12 cm2 s-1 for the sample E. After that, the effective
DCdecreases in the neighbor (δ+γ) two-phase region for both crystalline films. The dotted vertical lines in Figure 4 help to visualize the phase boundaries. The increase of the DC in the single-phase regions of crystalline LixV2O5 was already observed for a thin film electrode obtained by pulsed laser deposition.16
On this hypothesis, the small peak at the beginning of the DC curve of sample D can be explained as due to an increase in DC with the charge inserted during ε-single phase region of the compound LixV2O5,followed by a decrease in the effective DC with the charge, at the neighbor
ε+δ two-phase region.
Some other particular features are seen in the DC curve of the crystalline film D, such as the small peak around 2.85 V in the respective Ve, between the δ-single phase
region and a shoulder in the effective DC curve, in the range 2.4-2.5 V. These potentials are in good correspondence to those observed for the reduction peaks of the voltammogram of sample E (Figure 2). A correlation seems to exist between the peaks and shoulders in the DC curve, as well as in the effective DC curve, with the peaks at the voltammograms for the crystalline vanadium electrodes. In fact, extensive studies about the correlation between the DC and the redox potential in intercalation electrodes have been carried out by Levi and co-workers.23
Figure 4 shows that the dependence of DC on the crystalline phases for sample E is very similar to that obtained for sample D, for which the DC increases with the inserted charge in the δ single-phase region and with the effective DC decreasing in the δ+γ two-phase region. The absence of the two peaks in the DC curve of sample E, one at the region comprising the ε single-phase and
ε+δ two-phase, and the other at the middle of the δ phase, can be assigned to the low resolution in the experimental data of this sample, as it can be seen by the scarceness of points on its DC and potential curves, when compared to the experimental data points of sample D.
On this supposition, we inquire also if the peak and the shoulder observed in the DC curve of the film treated at 300 oC (sample C), around 2.7 and 2.4 V in the
corresponding Ve curve, would not be due to the presence of
micro or nanocrystallites phases in the film composition. In the literature,16,17,24-26 measurements of DC as a
function of the Li-inserted charge in crystalline LixV2O5 electrode films confirm our results of a dependence between the Li-diffusion coefficient and the crystalline phases of this compound.
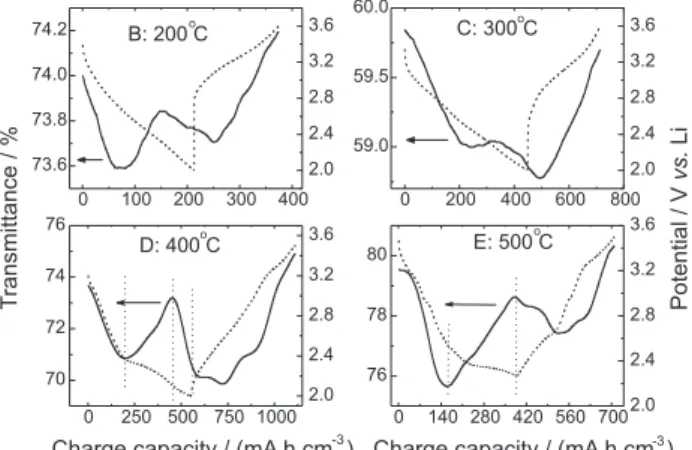
Figure 5 shows the electrochromic effect measured by the optical transmittance at 632.8 nm as a function of the charge, for one galvanostatic charge-discharge cycle and the concurrent electrode potential curves. An overall low variation in the optical transmittance with the inserted charge is seen for all electrodes. Furthermore, it is observed for all films, that the optical transmittance decreases with increasing inserted charge until the electrode potential decays to a minimum value between 2.2 and 2.4 V, depending on the film treatment temperature. After that, the transmittance increases with the charge and turn to decreases till the end of the charge insertion. In the deintercalation processes the transmittance increases with the extracted charge, but a synergetic effect is observed on it at the end of the intercalation and at the beginning of the deintercalation processes. For the polycrystalline
Figure 4. The dependence of the Li diffusion coefficient (DC), obtained from the galvanostatic intermittent titration technique (GITT), and the electrode open circuit voltage (Ve) with the charge capacity for the
D and E films, the transmittance presents better defined minimum and maximum. It should be noted that the ending intercalation potential are not the same for all electrodes. These unusual electrochromic effect in vanadium oxide electrodes, scarcely reported in the literature,20,27 was never
completely understood.
From the transmittance and the concurrent potential curves for the crystalline films (samples D and E, Figure 5), it can be seen that there is a correlation between the crystalline phases of LixV2O5 and the variation in the optical transmittance: the transmittance decreases with the inserted charge in the single-phase regions and increases with the charge in the two-phases regions. (In Figure 5, the vertical dotted lines in D and E curves help to define the phase boundaries). Figure 5 shows that for sample D, the optical transmittance decreases in the δ-single phase region, increases in the (δ+γ)-two phase region and turns to decrease at the γ-single phase region. The same behavior between the optical transmittance and phases is seen for sample E, although the γ-phase was not attained for this sample and a synergetic effect on the transmittance is observed at the end of charge insertion and at the beginning of the charge extraction, generating a minimum in the transmittance during the deintercalation process.
The transmittance decreases till 2.3 V for the crystalline films because this is the end of the δ-LixV2O5 single phase region in the crystalline Li-vanadium pentoxide. Since a minimum in the transmittance was also observed for the amorphous B and C samples during the charge insertion, it can be supposed that these films have in fact, a micro or nanocrystalline structure, as was already inferred from the Li-diffusion coefficient curve for sample C (Figure 4).
The dependence between the electrochromic effect and the LixV2O5 crystalline phases is cited in the literature9 but,
as far as we know, never relating the changes in the optical transmittance with the single and two-phase regions.
From Figure 4, a correlation is proposed between the Li-diffusion coefficient and the crystallographic phases of LixV2O5 electrodes. On other hand, a correlation was also found between the optical transmittance and these crystallographic phases, as observed from Figure 5. Thus, a correlation between DC and the optical absorbance (or transmittance) due to the electrochromic effect is supposed to exist: The diffusion coefficient and the optical absorbance at 632.8 nm increase in the single-phase regions of LixV2O5 and decrease in the two-phase regions. The electrochromic effect is then a Li-diffusion controlled process.
Conclusions
We have made Li electrochemical intercalation experiments in electrodes of vanadium oxide films, measured the electrochromic effect at 632.8 nm and the Li diffusion coefficient as function of the inserted charge. The films were obtained by heating a vanadium wire in a rarified oxygen atmosphere (HFMOD technique). Some of the films were thermally treated in an argon atmosphere at 200, 300, 400 and 500 oC. It was observed that, depending
on the temperature, the film composition and structure changed with thermal treatment. As indicated by the X-ray diffraction spectra, the films treated at 200 and 300 oC were
still amorphous, as the as-deposited films. A V2O3 or VO composition was supposed for the as-deposited films due to their black color. For the films annealed at 200 and 300 oC
other compositions are supposedly formed due the different film colors. The yellow color and the X-ray diffractograms of the films treated at 400 and 500 oC assure to them a
polycrystalline V2O5 structure. However, the curve of the electrode potential as a function of the inserted charge strongly indicated, for these films, the presence of another oxide mixed in the V2O5 matrix. The change in the optical absorbance (due to the electrochromic effect) and the diffusion coefficient were seen to depend on the Li inserted charge and on the film structure. For the crystalline films, the electrochromic effect and the diffusion coefficient are directly related to the crystalline phases of LixV2O5. It was observed that for these films the optical absorption and the diffusion coefficient increase in the single phase LixV2O5 regions and decrease in the two-phase regions (in fact, a effective diffusion coefficient is measured in the two-phase region). A small peak observed in the diffusion coefficient curve, between the δ-LixV2O5 single-phase of crystalline sample D and a shoulder observed at the δ+γ two-phase of
Figure 5. Changes in the optical transmittance at 632.8 nm (electrochromic
D and E samples were supposed to belong to crystalline phases other than LixV2O5 phases.
Acknowledgments
Funding for this work at Universidade Estadual de Londrina (UEL) was partially provided by Sercomtel Celular S.A. We also thank the Brazilian agencies - Fundação de Amparo à Pesquisa do Estado de São Paulo (FAPESP), Conselho Nacional de Desenvolvimento Cientifico e Tecnológico (CNPq), and Coordenação de Aperfeiçoamento de Pessoal de Nível Superior (CAPES) - for financial support. The authors are grateful to Dr. Lisandro P. Cardoso for use of the X-ray diffraction facilities under his supervision.
References
1. Kim, H.-K.; Seong, T.-Y.; Yoon, Y. S.; J. Vac. Sci. Technol.B,
2003, 21, 754.
2. Granqvist, C. G.; Handbook of Inorganic Electrochromic
Materials, 1st ed., Elsevier: Amsterdan, 1995.
3. Wu, G.; Du, K.; Xia, C.; Kun, X.; Shen, J.; Zhou, B.; Wang, J.;
Thin Solid Films2005, 485, 284.
4. Le Van, K.; Groult, H.; Mantoux, A.; Perrigaud, L.; Lantelme, F.; Linström, R.; Badour-Hadjean, R.; Zanna, S.; Lincot, D.;
J. Power Sources2006, 160, 592.
5. Talledo, A.; Granqvist, C. G.; J. Appl. Phys.1995, 77, 4655.
6. Wang, J.; Curtis, C. J.; Schulz, D. L.; Zhang, J. G.;
J. Electrochem. Soc.2004, 151, A1.
7. Özer, N.; Thin Solid Films1997, 305, 80.
8. Lindström, R.; Maurice, V.; Zanna, S.; Klein, L.; Groult, H.; Perrigaud, L.; Cohen, C.; Marcus, P.; Surf. Interface Anal. 2006,
38, 6.
9. Scarminio, J.; Talledo, A.; Andersson, A. A.; Passerini, S.; Decker F,.; Electrochim. Acta1993, 38, 1637.
10. Concciantelli, J. M.; Doumerc, J. P.; Pouchard, M.; Broussely, M.; Labat, J.; J. Power Sources1991, 34, 103.
11. Rouxinol, F. P. M.; MScDissertation, Instituto de Física, Universidade Estadual de Campinas, Brazil, 2003.
12. Scarminio, J.; Bica de Moraes, M. A.; Dias, R. C. E.; Rouxinol, F. P.; Durrant, S. F.; Electrochem. Solid-State Lett.2003, 6, H9.
13. Bica de Moraes, M. A.; Trasferetti, B. C.; Rouxinol, F. P. M.; Landers, R.; Scarminio, J.; Urbano, A.; Chem. Mater.2004, 16,
513.
14. Pecquenard, B.; Gourier , D.; Baffier, N.; Solid State Ionics
1995, 78, 287.
15. Silva, P. R. C.; MScDissertation, Depto. de Física, Universidade
Estadual de Londrina, Brazil, 2006.
16. McGraw, J. M.; Bahn, C. S.; Parilla, P. A.; Perkins, J. D.; Readey, D. W.; Ginley, D. S.; Electrochim. Acta1999, 45, 187. 17. Sato, Y.; Asada, T.; Tokugawa, H.; Kobayakawa, K.; J. Power
Sources 1997, 68, 674.
18. Greenwood, N. N.; Earshaw, A.; Chemistry of the Elements,
2nd ed., Elsevier Science & Technology: United Kingdom,
1997, p. 981.
19. Tranchant, A.; Blengino, J. M.; Farcy, J.; Messina, R.;
J. Electrochem. Soc.1992, 139, 1243.
20. Šurca, A.; Orel, B.; Dražic, G.; Pihlar, B.; J. Electrochem. Soc.
1999, 146, 232.
21. Park, Y. J.; Ryu, K. S.; Kim, K. M.; Park, N. G.; Kang, M. G.; Chang, S. H.; Solid State Ionics2002, 154-155, 229.
22. Cocciantelli, J. M.; Ménétrier, M.; Delmas, C.; Doumerc, J. P.; Pouchard, M.; Broussely M.; Labat, J.; Solid State Ionics1995,
78, 143.
23. Levi, M. D.; Aurbach, D.; Electrochim. Acta1999, 45, 167.
24. Vivier, V.; Farcy, J.; Ramos, J. P. P.; Electrochim. Acta1998,
44, 831.
25. Bae, J. S.; Pyun, S.-I.; J. Alloys Compd.1995, 217, 52. 26. Lantelme, F.; Mantoux, A.; Groult, H.; Lincot, D.;
J. Electrochem. Soc.2003, 150, A1202.
27. Passerini, S.; Tipton, A. L.; Smyrl, W. H.; Sol. Energy Mater. Sol. Cells1995, 39, 167.
28. Lu, Z.; Levi, M. D., Salitra, G. Gofer, Y.; Levi, E.; Aurbach, D.;
J. Electroanal. Chem. 2000, 491, 211.
Received: September 29, 2007
Web Release Date: May 8, 2008